
The fantasy community speculates continuously about rookie roles in their first year. How much opportunity will they get? Will they produce? In the case of Alvin Kamara, we got a huge bang. In the case of John Ross, not so much.
When drafting for dynasty, fantasy players are not as worried about immediate returns as they are long-terms gains. However, for redraft and Best Ball, it is difficult to decide which rookies will produce immediate value in their rookie seasons. How much of this value is based on their actual draft capital? To answer this, I took the pick numbers from the last five NFL drafts and players’ respective rookie seasons (via PlayerProfiler’s Data Analysis Tool) to see the recent relationship between draft capital and rookie production and usage. This can help us better understand how to value rookies this year.


Quarterbacks
Quarterbacks are the most obvious case of draft capital mattering. A first-round pick is much more likely to play, let alone produce, in his rookie year than a day 2 or 3 pick. For example, 2019 pick 1.01 Kyler Murray had 542 (No. 9 among qualified quarterbacks) pass attempts for 3,722 (No. 15) passing yards his rookie season. In contrast, fourth-rounder Ryan Finley saw 87 (No. 45) pass attempts for 474 (No. 47) yards. A team that invests higher draft capital into a QB is more likely to give that guy an opportunity given the high investment in the most important position in football.
Digging into 2019 rookie QBs…#KylerMurray is going to be a stud in 2020.
2019 #FantasyStats:
– #9 in passing attempts (33.9 p/g)
– #9 in deep ball attempts (4.4 p/g)
– #6 in deep ball comp % (44.3%)
– #2 in rush yards (544)
– #3 in RZ carries at QB (1.2) pic.twitter.com/WJdaZeV4kj— Marvin Elequin (@FF_MarvinE) February 18, 2020
Logic dictates that more attempts mean more fantasy points. So, a higher draft capital QB will be in line for greater usage and fantasy production. Throughout the data of the last five NFL drafts and rookie seasons gathered, there were a few moderate correlations between QB draft pick and rookie usage and production (UDFAs filtered out):
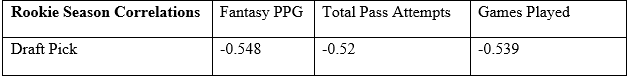
All three are negative correlations because draft picks start at 1 and increase, so a pick closer to 1 correlates with higher attempts.
Fantasy Points Per Game, total pass attempts, and games played have around the same moderate correlation to draft picks. This means a higher QB pick generally leads to increased production and usage, with exceptions. The exceptions come from teams sitting their highly drafted QBs behind veterans for their rookie season, like Patrick Mahomes.
Rookie QBs are straightforward and intuitive to analyze for redraft and Best Ball. A higher pick, like Trevor Lawrence, Trey Lance, Zach Wilson, or Justin Fields gives you the best chance at fantasy production their rookies seasons. Just monitor if a guy like Fields will be sitting behind Andy Dalton.
Running Backs
Now we get to the meat and bones position of fantasy. Running backs are the first players off the board in traditional leagues and generate volatility yearly. We have seen first round backs like Saquon Barkley and Christian McCaffrey perform at a high level. However, mid to late round picks like Alvin Kamara and Jordan Howard have also been top fantasy rookies. So how should we factor in draft capital when drafting rookie RBs?
First, let’s visualize the relationship between draft capital and efficiency and usage for rookie RBs.
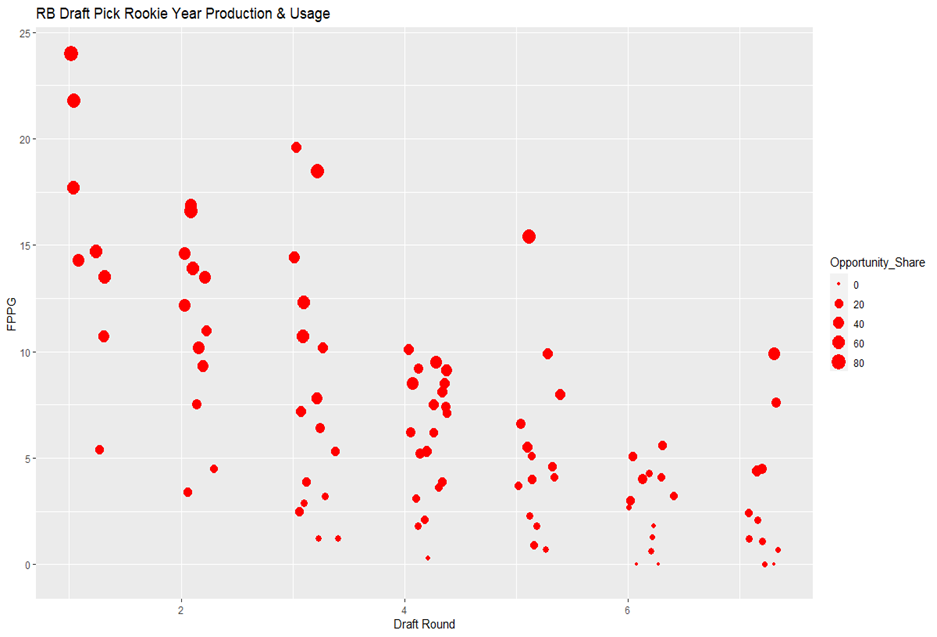
The above graph shows the relationship between the draft pick an RB was taken, his rookie Fantasy Points Per Game, and Opportunity Share (as a percentage here). Backs taken before round 4 are generally higher up and a larger dot than the rest. This means they averaged more fantasy points per game and received a higher Opportunity Share than the rest. There is a gradual decrease in the clusters of each round in Fantasy Points Per Game and Opportunity Share, with some day three outliers receiving sizeable opportunity, leading to greater fantasy production.
Over the last five drafts and respective rookie seasons, there was a high-moderate negative correlation between RB draft pick and usage and production. Again, the correlations are negative due to picks starting at 1 and increasing.
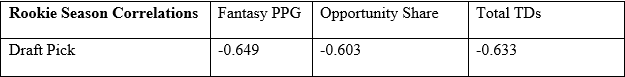
These correlations show that Fantasy Points Per Game has a high to moderate correlation with a player’s draft pick, higher than for QBs. Opportunity Share and total touchdowns are in the same range, showing that draft capital does have an impact on RB usage and production for their rookie seasons.
Running backs are rarely drafted in the top 15. Those who are (Barkley, McCaffrey, etc.) will see a great amount of opportunity, leading to touchdown and yardage production. A team investing a first-round pick at a position becoming increasingly less valued in the NFL will want to give that RB the opportunity to match that investment. However, getting to the lower end of the draft, teams are drafting for RB depth, and those later round RBs (Aaron Jones, Chris Carson) are less likely to make immediate impacts their rookie years rather than later.
|| RB THREAD ||
Rookie RBs since 2000 w/ 1000+ rushYds, 10+ total TDs, weighing 220+ who were under 22.5 years old to start their rookie year:LaDainian Tomlinson (2000)
Ezekiel Elliott (2016)
Saquon Barkley (2018)
JONATHAN TAYLOR (2020)As elite as it gets… Now, here's CEH
— Josh Larky (@jlarkytweets) January 21, 2021
(Notice all RBs in DOA Josh Larky’s tweet were top 45 picks)
Let’s look at the 2018 RB class for an example. Barkley was pick 1.02, and subsequently received an 80.1-percent Opportunity Share his rookie year. Additionally, Seven of eight RBs taken in the first three rounds saw rookie Opportunity Shares above 20-percent. The lone outlier being Derrius Guice, who tore his ACL in the preseason. Meanwhile, just five of 12 RBs taken on day three saw Opportunity Shares above 20-percent.
Draft capital matters for RB rookie year production.
Draft Najee Harris and Travis Etienne expecting high usage. Trey Sermon and Javonte Williams will get usage, but to a lower extent. Fourth-rounder Michael Carter, however, may disappoint with lower usage. Don’t expect later picks like Kenny Gainwell and Rhamondre Stevenson to be useful in 2021 redraft and Best Ball leagues.

Wide Receivers
Wide Receivers are the second-most drafted position in traditional leagues. DeAndre Hopkins and Justin Jefferson are examples of alpha-level production coming into the league. However, Mike Williams and John Ross are examples of first-round duds, with injuries and inconsistencies. Historically, late picks like Darius Slayton and Tyreek Hill have seen high volume as rookie receivers, providing fantasy relevant seasons. So, how does draft capital factor into rookie receiver usage and production?
Like RBs, let’s visualize WR rookie year draft pick, production, and usage.
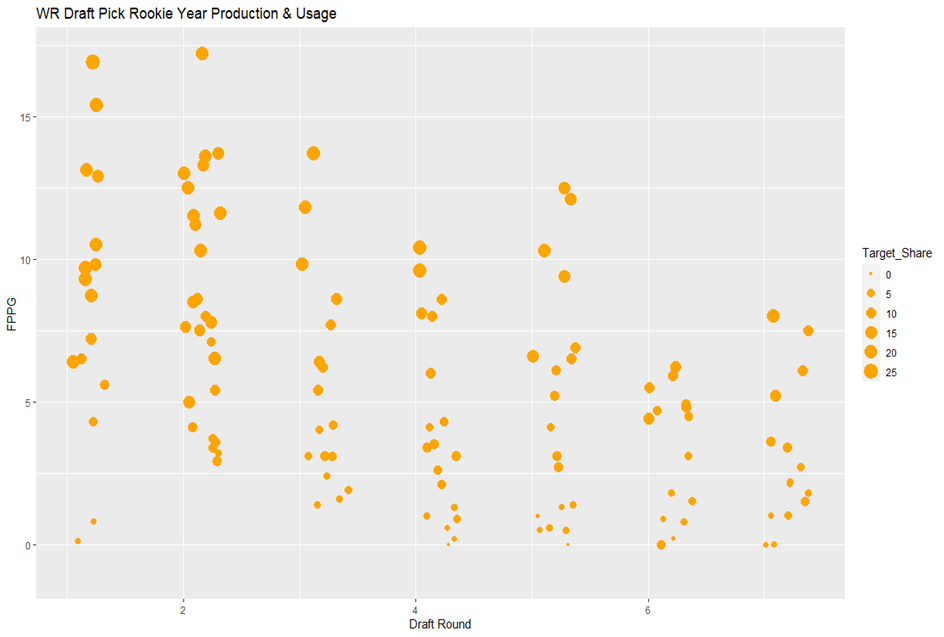
This plot demonstrates the relationship between a WR’s draft pick and rookie year fantasy points per game and Target Share (as percentage here). Similar to the RB plot, wide receivers gradual decrease in Fantasy Points Per Game in the later rounds. However, there is more variability among later round WRs than later round RBs. Additionally, there are several large dots at round 4 or later, meaning these guys had high Target Shares.
Now, let’s look at key WR draft pick correlations:
These are merely moderate correlations between these variables and draft pick. Receptions and receiving yards have the most correlation with draft pick, but they aren’t that high.
Fantasy Points Per Game and Target Share are interestingly lesser in correlations. This means that there is not much of a relationship between draft pick and usage and production among rookie WRs. While day one and two WRs are used and subsequently produce at high rates, many day three WRs also see high opportunities their rookie years.
For example, in the 2019 draft, D.K. Metcalf saw the highest rookie Target Share at 20.3-percent as a second round pick. Out of WRs playing snaps in 2019, only 50-percent of 2019 day one or two WRs saw a double-digit Target Share. Meanwhile, 50-percent of day three WRs also saw a double-digit Target Share. Yet, when a wide receiver on day one or two gets double-digit Target Shares, they get more usage on average than day three WRs seeing double digit Target Shares. Using the graph and correlations, and 2019 draft example, we see that there is only a small advantage to a day one or two WR compared to day three.
Most yards per route run among rookie WRs in 2019:
1. A.J. Brown – 2.67 🚀
#Titanup pic.twitter.com/kPIz450fGY— PFF TEN Titans (@PFF_Titans) July 8, 2020
(Note the guys in this graphic aren’t all highly selected WRs)
Wide receiver draft capital has a small impact on rookie year usage and production.
Sure, take your Ja’Marr Chase and Jaylen Waddle shares. However, some of the day one and two guys may come back to bite with their immediate production. Monitor a guy like Amon-Ra St. Brown from day three. There will be players seeing immediate usage as rookies from the late rounds, more so than the RB group.
Tight Ends
Star fantasy tight ends are scarce. Today’s top redraft and Best Ball TEs, George Kittle, Travis Kelce, and Darren Waller, weren’t stars right out of the gate. The 2021 TE rookie class had a first-class talent in Kyle Pitts, whose fantasy value has been sky-high. Yet, does his high draft capital mean more rookie year fantasy usage production? Or might we need to rely on his WR-like skills to garner usage instead?
Let’s visualize a graph with the same PlayerProfiler metrics used for WRs on production and usage.
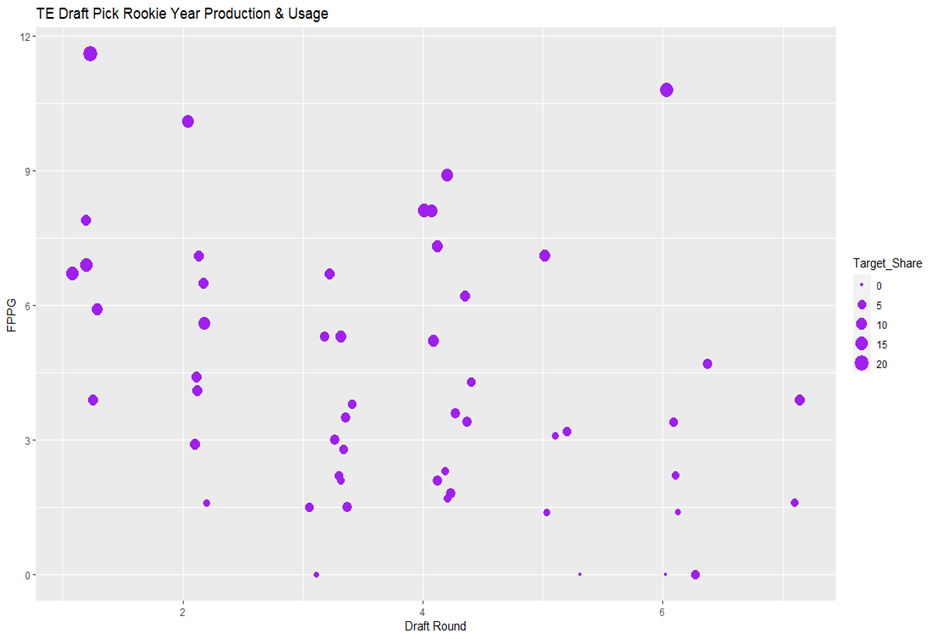
This tight end graph is sporadic, not showing a definitive relationship between Fantasy Points Per Game and draft pick. The dot sizes represent Target Shares, which are sporadic as well. The tight ends in general are spread out in terms of production and usage here, with barely any visual relationship.
Now to some key correlations:
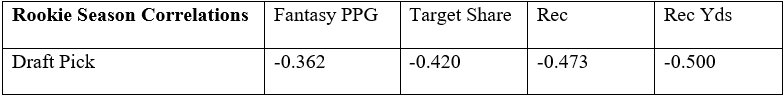
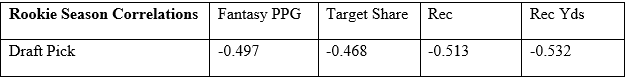
These TE draft capital correlations are much lower than the RB and WR correlations.
Rookie year Fantasy Points Per Game has a low correlation with draft pick, while receiving yards is at a moderate level. Through the Target Share and receiving correlations, we see that usage has a low-moderate correlation with draft pick, while fantasy production remains at a low correlation level. A higher draft pick doesn’t lead to an obvious increase in production or usage.
Eric Ebron is one example of a first round TE pick who provided little fantasy value his rookie year. Hayden Hurst is another. Using Hurst’s 2018 class, we see the lack of relationship between TE draft capital and rookie year production and usage. Hurst was hurt at the start of 2018, appearing in 9 games and seeing a 7.6-percent Target Share. His own teammate, third-rounder Mark Andrews, became the starter and did not give the job up when Hurst returned. Andrews saw a 9.3-percent Target Share and finished with more Fantasy Points Per Game. Out of five day one and two TEs in 2018, none saw a double-digit Target Share, while three had under 4.0 Fantasy Points Per Game. Among seven day three TEs, three saw a double-digit Target Share, and three had under 4.0 Fantasy Points Per Game.
Yes, 4.0 Fantasy Points Per Game is a low bar, but no 2018 rookie TE finished in the double digits. It’s rare for rookie TEs to make a huge fantasy impact. Only three rookies in the 5-year dataset finished with double-digit Fantasy Points Per Game.
TE draft capital has little to no impact on rookie year usage and production.
https://youtu.be/p70APQWAAqU
Kyle Pitts will earn opportunity with his skills and Atlanta’s situation, because his draft capital won’t factor in to give him TE1 opportunity. Late-round picks, like Brevin Jordan, could outperform their draft capital based on situation. Draft capital won’t impact them negatively. However, rookie TEs in general hardly make redraft or Best Ball impacts in their rookie seasons. Don’t bother studying 2021 rookie TEs outside of Pitts for redraft and Best Ball formats.
Concluding Analysis
Rookies will get the chance to make an impact on their teams out of the gate, but not all should be scooped up for redraft and Best Ball.
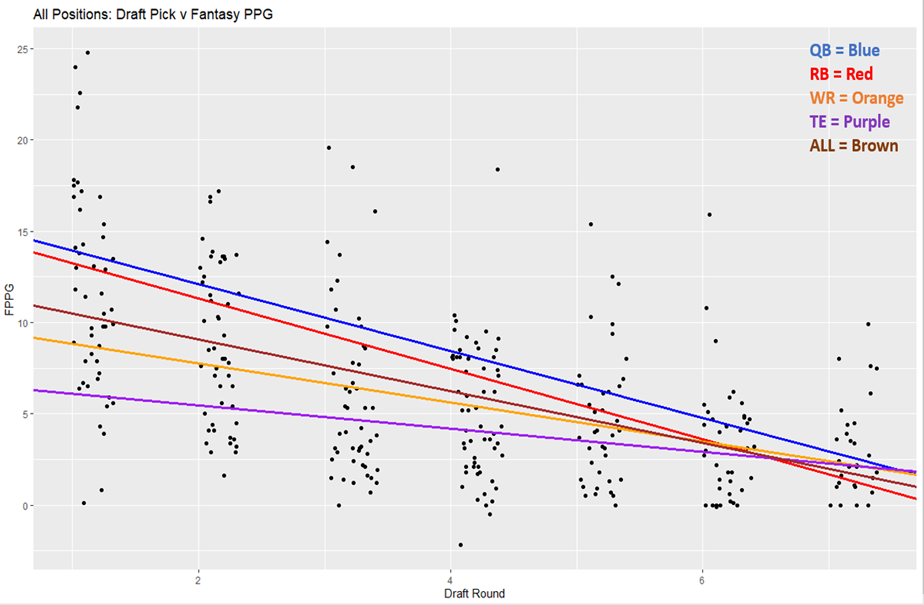
This graph shows a linear regression line of fit for each position, as well as all players in the 5-year dataset used. RB has the steepest slope, while TE has the flattest. This means that rookie RB fantasy production regresses most as the draft rounds get later.
So, draft capital matters most for RBs, then QBs, WRs, and TEs in that order.
Early round picks see more usage and production for rookie RBs and QBs, with a decline for mid and late round picks. There is a similar pattern for WRs, but with a lesser usage and production decline in later rounds. Trey Sermon will have a greater decline from Najee Harris than Dyami Brown from Kadarius Toney. For TEs, draft capital does not matter, it is rare that multiple rookie TEs will even break a top-15 TE mark.

