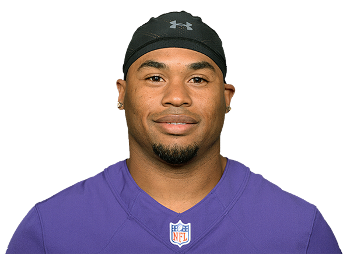
Tyreek Hill Impressed With Tua Tagovailoa's Accuracy
Miami Dolphins wide receiver Tyreek Hill said that ...
Year Year | Games Played Games | Targets Tgts | Receptions Rec | Receiving Yards Rec Yds | Yards Per Reception YPR | Air Yards Air Yds | Receiving TDs Rec TD | Fantasy Points Per Game Fantasy Pts/Game |
---|---|---|---|---|---|---|---|---|
2021 | 17 | 159 | 111 | 1239 | 11.2 | 1709 | 9 | 17.4 (#6) |
2020 | 15 | 135 | 87 | 1276 | 14.7 | 1746 | 15 | 21.9 (#2) |
2019 | 12 | 88 | 58 | 860 | 14.8 | 1130 | 7 | 15.7 (#11) |
2018 | 16 | 137 | 87 | 1479 | 17.0 | 2091 | 12 | 20.5 (#4) |
2017 | 15 | 105 | 75 | 1183 | 15.8 | 1286 | 7 | 16.0 (#7) |
2016 | 16 | 83 | 61 | 593 | 9.7 | 668 | 6 | 12.4 (#32) |
Targets | Target Share | Target Rate | Snap Share | Slot Snaps | Routes Run | Route Participation Route % |
---|---|---|---|---|---|---|
159 (9.4 p/g) | 25.1% (25.3% rz) | 29.7% | 73.2% | 313 (37.8% rate) | 536 (31.5 p/g) | 79.5% |
#7 | #16 | #6 | #52 | #19 | #12 | #52 |
Air Yards | Air Yards Share | Average Target Distance (ADOT) Target Depth (ADOT) | Deep Targets | Red Zone Targets Red Zone Tgts | Target Quality Rating | Catchable Target Rate |
---|---|---|---|---|---|---|
1709 (100.5 p/g) | 36.1% | 10.7 | 26 (1.5 p/g) | 24 (16 rec) | 6.26 | 79.2% (126 tgts) |
#3 | #12 | #43 | #9 | #6 | #19 | #28 |
Receptions Recs | Receiving Yards Rec Yards | Yards After Catch YAC | Unrealized Air Yards | Total TDs | Fantasy Points Per Game Fantasy Pts/Game | Expected Fantasy Points Per Game Expected Fantasy Pts/Game |
---|---|---|---|---|---|---|
111 (6.5 p/g) | 1239 (72.9 p/g) | 415 (2.6 p/tgt) | 885 (5.6 p/tgt) | 9 (7.5% rate) | 17.4 | 20.2 (-2.77 diff) |
#3 | #6 | #13 | #7 | #10 | #6 | #2 |
Target Accuracy | Yards Per Route Run | Formation Adjusted Yards Per Route Run Formation Adjusted YPRR | Yards Per Target YPT | Yards Per Reception YPR | Yards Per Team Pass Attempt Yards/Team Pass Attempt | True Catch Rate |
---|---|---|---|---|---|---|
7.8 | 2.31 | 2.24 | 7.8 | 11.2 | 1.84 | 88.1% (69.8% actual) |
#9 | #11 | #9 | #56 | #72 | #17 | #35 |
Target Separation | Average Cushion | Target Premium | Dominator Rating | Juke Rate | Drops | Contested Catch Rate Contested Catch % |
---|---|---|---|---|---|---|
1.69 | 4.27 | +1.0% | 24.8% | 6.3% | 6 (3.8% rate) | 20.0% (30 tgts) |
#35 | #77 | #48 | #29 | #63 | #22 | #81 |
Production Premium | Expected Points Added (EPA) EPA | QB Rating Per Target QB Rating Per Target | Best Ball Points Added Best Ball Pts Added | Fantasy Points Per Route Run Fantasy Points Per Route | Fantasy Points Per Target Fantasy Points Per Target | Total Fantasy Points Total Fantasy Pts |
---|---|---|---|---|---|---|
+2.5 | +83.6 | 111.6 | 164.8 (9.7 p/g) | 0.55 | 1.86 | 296.50 |
#39 | #4 | #27 | #5 | #9 | #37 | #6 |
Total Route Wins | Route Win Rate | Routes vs Man | Win Rate vs Man | Target Rate vs Man | Target Separation vs Man Tgt Separation vs Man | Fantasy Points Per Target vs Man Fantasy Pts/Tgt vs Man |
---|---|---|---|---|---|---|
215 | 42.3% | 217 (314 zone) | 34.1% (45.4% zone) | 27.7% (29.9% zone) | 1.74 (2.21 zone) | 1.74 (1.96 zone) |
#12 | #29 | #40 | #56 | #18 | #28 | #49 |
Targets | Target Share | Target Rate | Snap Share | Slot Snaps | Routes Run | Route Participation Route % |
---|---|---|---|---|---|---|
135 (9.0 p/g) | 23.4% (25.0% rz) | 23.9% | 84.9% | 352 (41.1% rate) | 564 (37.6 p/g) | 94.5% |
#9 | #22 | #21 | #19 | #18 | #14 | - |
Air Yards | Air Yards Share | Average Target Distance (ADOT) Target Depth (ADOT) | Deep Targets | Red Zone Targets Red Zone Tgts | Target Quality Rating | Catchable Target Rate |
---|---|---|---|---|---|---|
1746 (116.4 p/g) | 35.8% | 12.9 | 32 (2.1 p/g) | 19 (14 rec) | 5.75 | 72.6% (98 tgts) |
#3 | #9 | #26 | #2 | #4 | #46 | #85 |
Receptions Recs | Receiving Yards Rec Yards | Yards After Catch YAC | Unrealized Air Yards | Total TDs | Fantasy Points Per Game Fantasy Pts/Game | Expected Fantasy Points Per Game Expected Fantasy Pts/Game |
---|---|---|---|---|---|---|
87 (5.8 p/g) | 1276 (85.1 p/g) | 441 (3.3 p/tgt) | 911 (6.7 p/tgt) | 17 (17.0% rate) | 21.9 | 18.5 (+3.45 diff) |
#15 | #7 | #9 | #4 | #2 | #2 | #3 |
Target Accuracy | Yards Per Route Run | Formation Adjusted Yards Per Route Run Formation Adjusted YPRR | Yards Per Target YPT | Yards Per Reception YPR | Yards Per Team Pass Attempt Yards/Team Pass Attempt | True Catch Rate |
---|---|---|---|---|---|---|
382.0 | 2.26 | 2.14 | 9.5 | 14.7 | 2.03 | 88.8% (64.4% actual) |
#13 | #14 | #11 | #22 | #26 | #13 | #28 |
Target Separation | Average Cushion | Target Premium | Dominator Rating | Juke Rate | Drops | Contested Catch Rate Contested Catch % |
---|---|---|---|---|---|---|
1.82 | 3.75 | +25.5% | 34.2% | - | 6 (4.4% rate) | 47.4% (19 tgts) |
#30 | #57 | #28 | #15 | - | #16 | #52 |
Production Premium | Expected Points Added (EPA) EPA | QB Rating Per Target QB Rating Per Target | Best Ball Points Added Best Ball Pts Added | Fantasy Points Per Route Run Fantasy Points Per Route | Fantasy Points Per Target Fantasy Points Per Target | Total Fantasy Points Total Fantasy Pts |
---|---|---|---|---|---|---|
+7.2 | +77.3 | 129.1 | 191.8 (12.8 p/g) | 0.58 | 2.44 | 328.90 |
#40 | #4 | #6 | #2 | #3 | #3 | #2 |
Targets | Target Share | Target Rate | Snap Share | Slot Snaps | Routes Run | Route Participation Route % |
---|---|---|---|---|---|---|
88 (7.3 p/g) | 21.9% (15.9% rz) | 27.7% | 74.4% | 184 (35.2% rate) | 318 (26.5 p/g) | 76.8% |
#43 | #25 | #17 | #59 | #42 | #63 | #52 |
Air Yards | Air Yards Share | Average Target Distance (ADOT) Target Depth (ADOT) | Deep Targets | Red Zone Targets Red Zone Tgts | Target Quality Rating | Catchable Target Rate |
---|---|---|---|---|---|---|
1130 (94.2 p/g) | 37.5% | 12.8 | 20 (1.7 p/g) | 7 (4 rec) | 6.31 | 77.3% (68 tgts) |
#35 | #8 | #32 | #28 | #59 | #33 | #55 |
Receptions Recs | Receiving Yards Rec Yards | Yards After Catch YAC | Unrealized Air Yards | Total TDs | Fantasy Points Per Game Fantasy Pts/Game | Expected Fantasy Points Per Game Expected Fantasy Pts/Game |
---|---|---|---|---|---|---|
58 (4.8 p/g) | 860 (71.7 p/g) | 282 (3.2 p/tgt) | 552 (6.3 p/tgt) | 7 (10.6% rate) | 15.7 | - |
#36 | #31 | #29 | #34 | #13 | #11 | - |
Target Accuracy | Yards Per Route Run | Formation Adjusted Yards Per Route Run Formation Adjusted YPRR | Yards Per Target YPT | Yards Per Reception YPR | Yards Per Team Pass Attempt Yards/Team Pass Attempt | True Catch Rate |
---|---|---|---|---|---|---|
7.0 | 2.70 | - | 9.8 | 14.8 | 2.08 | 85.3% (65.9% actual) |
#46 | #7 | - | #15 | #26 | #15 | #25 |
Target Separation | Average Cushion | Target Premium | Dominator Rating | Juke Rate | Drops | Contested Catch Rate Contested Catch % |
---|---|---|---|---|---|---|
1.97 | 3.79 | +10.4% | 29.2% | - | 3 (3.4% rate) | 25.0% (12 tgts) |
#6 | #77 | #33 | #19 | - | #61 | #77 |
Production Premium | Expected Points Added (EPA) EPA | QB Rating Per Target QB Rating Per Target | Best Ball Points Added Best Ball Pts Added | Fantasy Points Per Route Run Fantasy Points Per Route | Fantasy Points Per Target Fantasy Points Per Target | Total Fantasy Points Total Fantasy Pts |
---|---|---|---|---|---|---|
+12.8 | +63.4 | 114.8 | 93.2 (7.8 p/g) | 0.59 | 2.14 | 188.30 |
#23 | #18 | #13 | #23 | #5 | #11 | #30 |
Targets | Target Share | Target Rate | Snap Share | Slot Snaps | Routes Run | Route Participation Route % |
---|---|---|---|---|---|---|
137 (8.6 p/g) | 24.3% (16.3% rz) | 27.6% | 89.2% | 304 (35.1% rate) | 496 (31.0 p/g) | 85.1% |
#11 | #15 | #17 | #26 | #28 | #12 | #27 |
Air Yards | Air Yards Share | Average Target Distance (ADOT) Target Depth (ADOT) | Deep Targets | Red Zone Targets Red Zone Tgts | Target Quality Rating | Catchable Target Rate |
---|---|---|---|---|---|---|
2091 (130.7 p/g) | 39.1% | 15.3 | - (0.0 p/g) | 16 (10 rec) | 6.59 | 74.5% (102 tgts) |
#3 | #5 | #13 | - | #16 | #19 | #67 |
Receptions Recs | Receiving Yards Rec Yards | Yards After Catch YAC | Unrealized Air Yards | Total TDs | Fantasy Points Per Game Fantasy Pts/Game | Expected Fantasy Points Per Game Expected Fantasy Pts/Game |
---|---|---|---|---|---|---|
87 (5.4 p/g) | 1479 (92.4 p/g) | 522 (3.8 p/tgt) | 1134 (8.3 p/tgt) | 13 | 20.5 | - |
#10 | #4 | #2 | #3 | #2 | #4 | - |
Target Accuracy | Yards Per Route Run | Formation Adjusted Yards Per Route Run Formation Adjusted YPRR | Yards Per Target YPT | Yards Per Reception YPR | Yards Per Team Pass Attempt Yards/Team Pass Attempt | True Catch Rate |
---|---|---|---|---|---|---|
7.1 | 2.98 | - | 10.8 | 17.0 | 2.54 | 85.3% (63.5% actual) |
#46 | #5 | - | #6 | #8 | #4 | #36 |
Target Separation | Average Cushion | Target Premium | Dominator Rating | Juke Rate | Drops | Contested Catch Rate Contested Catch % |
---|---|---|---|---|---|---|
1.46 | 3.98 | +44.3% | 26.4% | - | 5 (3.6% rate) | 45.0% (20 tgts) |
#48 | #62 | #5 | #24 | - | #29 | #55 |
Production Premium | Expected Points Added (EPA) EPA | QB Rating Per Target QB Rating Per Target | Best Ball Points Added Best Ball Pts Added | Fantasy Points Per Route Run Fantasy Points Per Route | Fantasy Points Per Target Fantasy Points Per Target | Total Fantasy Points Total Fantasy Pts |
---|---|---|---|---|---|---|
+18.7 | - | 114.0 | 167.9 (10.5 p/g) | 0.66 | 2.39 | 328.00 |
#11 | - | #19 | #3 | #4 | #5 | #2 |
Targets | Target Share | Target Rate | Snap Share | Slot Snaps | Routes Run | Route Participation Route % |
---|---|---|---|---|---|---|
105 (7.0 p/g) | 21.3% (5.6% rz) | 22.6% | 85.6% | 130 (17.2% rate) | 465 (31.0 p/g) | 91.7% |
#22 | #27 | #33 | #23 | #39 | #27 | #28 |
Air Yards | Air Yards Share | Average Target Distance (ADOT) Target Depth (ADOT) | Deep Targets | Red Zone Targets Red Zone Tgts | Target Quality Rating | Catchable Target Rate |
---|---|---|---|---|---|---|
1286 (85.7 p/g) | 31.8% | 12.3 | - (0.0 p/g) | 4 (1 rec) | 0.00 | 81.9% (86 tgts) |
#22 | #20 | #46 | - | #92 | - | #16 |
Receptions Recs | Receiving Yards Rec Yards | Yards After Catch YAC | Unrealized Air Yards | Total TDs | Fantasy Points Per Game Fantasy Pts/Game | Expected Fantasy Points Per Game Expected Fantasy Pts/Game |
---|---|---|---|---|---|---|
75 (5.0 p/g) | 1183 (78.9 p/g) | 423 (4.0 p/tgt) | 526 (5.0 p/tgt) | 7 (0.1% rate) | 16.0 | - |
#11 | #7 | #8 | #45 | #14 | #7 | - |
Target Accuracy | Yards Per Route Run | Formation Adjusted Yards Per Route Run Formation Adjusted YPRR | Yards Per Target YPT | Yards Per Reception YPR | Yards Per Team Pass Attempt Yards/Team Pass Attempt | True Catch Rate |
---|---|---|---|---|---|---|
0.0 | 2.54 | - | 11.3 | 15.8 | 2.33 | 87.2% (71.4% actual) |
- | #6 | - | #2 | #13 | #6 | #14 |
Target Separation | Average Cushion | Target Premium | Dominator Rating | Juke Rate | Drops | Contested Catch Rate Contested Catch % |
---|---|---|---|---|---|---|
2.04 | 4.33 | +26.1% | 28.1% | - | 4 (3.8% rate) | 64.3% (28 tgts) |
#8 | #10 | #11 | #15 | - | #58 | #20 |
Production Premium | Expected Points Added (EPA) EPA | QB Rating Per Target QB Rating Per Target | Best Ball Points Added Best Ball Pts Added | Fantasy Points Per Route Run Fantasy Points Per Route | Fantasy Points Per Target Fantasy Points Per Target | Total Fantasy Points Total Fantasy Pts |
---|---|---|---|---|---|---|
+26.7 | - | 126.8 | 112.6 (7.5 p/g) | 0.52 | 2.29 | 240.20 |
#5 | - | #2 | #15 | #7 | #2 | #8 |
Targets | Target Share | Target Rate | Snap Share | Slot Snaps | Routes Run | Route Participation Route % |
---|---|---|---|---|---|---|
83 (5.2 p/g) | 15.5% (18.1% rz) | 0.0% | 0.0% | 74 (0.0% rate) | - (0.0 p/g) | 0.0% |
#55 | #67 | - | - | #63 | - | - |
Air Yards | Air Yards Share | Average Target Distance (ADOT) Target Depth (ADOT) | Deep Targets | Red Zone Targets Red Zone Tgts | Target Quality Rating | Catchable Target Rate |
---|---|---|---|---|---|---|
668 (41.8 p/g) | 19.1% | 8.1 | - (0.0 p/g) | 15 (12 rec) | 0.00 | 0.0% ( tgts) |
#81 | #74 | #94 | - | #19 | - | - |
Receptions Recs | Receiving Yards Rec Yards | Yards After Catch YAC | Unrealized Air Yards | Total TDs | Fantasy Points Per Game Fantasy Pts/Game | Expected Fantasy Points Per Game Expected Fantasy Pts/Game |
---|---|---|---|---|---|---|
61 (3.8 p/g) | 593 (37.1 p/g) | 272 (3.3 p/tgt) | 347 (4.2 p/tgt) | 9 (10.6% rate) | 12.4 | - |
#42 | #62 | #36 | #76 | #6 | #32 | - |
Target Accuracy | Yards Per Route Run | Formation Adjusted Yards Per Route Run Formation Adjusted YPRR | Yards Per Target YPT | Yards Per Reception YPR | Yards Per Team Pass Attempt Yards/Team Pass Attempt | True Catch Rate |
---|---|---|---|---|---|---|
0.0 | 0.00 | - | 7.1 | 9.7 | 1.09 | 0.0% (73.5% actual) |
- | - | - | #69 | #101 | #69 | - |
Target Separation | Average Cushion | Target Premium | Dominator Rating | Juke Rate | Drops | Contested Catch Rate Contested Catch % |
---|---|---|---|---|---|---|
0.00 | 0.00 | +47.6% | 24.2% | - | 3 (3.6% rate) | 50.0% (2 tgts) |
- | - | #5 | #29 | - | #55 | - |
Production Premium | Expected Points Added (EPA) EPA | QB Rating Per Target QB Rating Per Target | Best Ball Points Added Best Ball Pts Added | Fantasy Points Per Route Run Fantasy Points Per Route | Fantasy Points Per Target Fantasy Points Per Target | Total Fantasy Points Total Fantasy Pts |
---|---|---|---|---|---|---|
+13.0 | - | 0.0 | 58.8 (3.7 p/g) | 0.00 | 2.40 | 199.00 |
#21 | - | - | #32 | - | #3 | #24 |
Week Wk | Opponent Opp | Primary Corner Primary Corner | Snap Share Snap Share | Routes Routes | Targets Targets | Receptions Receptions | Receiving Yards Receiving Yards | Fantasy Points Fantasy Points |
---|---|---|---|---|---|---|---|---|
1 | CLE | Denzel Ward | 88.5% | 34 | 15 (2 rz) | 11 (1 tds) | 197 (231 air) | 37.1 (#2) |
2 | BAL | Marlon Humphrey | 100.0% | 27 | 4 | 3 | 14 (17 air) | 5.9 (#69) |
3 | LAC | Tevaughn Campbell | 72.4% | 34 | 7 | 5 | 56 (132 air) | 9.7 (#48) |
4 | PHI | Darius Slay | 82.5% | 23 | 12 (2 rz) | 11 (3 tds) | 186 (163 air) | 47.6 (#1) |
5 | BUF | Taron Johnson | 83.8% | 46 | 13 (2 rz) | 7 | 63 (78 air) | 14.8 (#26) |
6 | WAS | Kendall Fuller | 57.0% | 32 | 12 (2 rz) | 9 (1 tds) | 76 (71 air) | 22.6 (#10) |
7 | TEN | Janoris Jenkins | 72.1% | 40 | 9 | 6 | 49 (64 air) | 12.7 (#28) |
8 | NYG | Darnay Holmes | 75.3% | 40 | 18 (3 rz) | 12 (1 tds) | 94 (182 air) | 27.4 (#4) |
9 | GB | Kevin King | 82.5% | 28 | 11 | 4 | 37 (199 air) | 7.3 (#50) |
10 | LV | Brandon Facyson | 79.5% | 40 | 10 (4 rz) | 7 (2 tds) | 83 (137 air) | 27.5 (#4) |
11 | DAL | Trevon Diggs | 81.8% | 35 | 11 | 9 | 77 (51 air) | 20.0 (#15) |
13 | DEN | Kyle Fuller | 84.9% | 27 | 5 (1 rz) | 2 | 22 (37 air) | 4.2 (#62) |
14 | LV | Trayvon Mullen | 61.4% | 21 | 4 | 4 | 76 (62 air) | 11.6 (#42) |
15 | LAC | Chris Harris | 83.8% | 43 | 13 (4 rz) | 12 (1 tds) | 148 (95 air) | 32.8 (#2) |
16 | PIT | Joe Haden | 56.7% | 23 | 2 | 2 | 19 (15 air) | 3.9 (#85) |
17 | CIN | Chidobe Awuzie | 82.8% | 30 | 10 (2 rz) | 6 | 40 (145 air) | 10.2 (#43) |
18 | DEN | Kyle Fuller | 18.7% | 13 | 3 (2 rz) | 1 | 2 (30 air) | 1.2 (#107) |
19 | PIT | Cameron Sutton | 78.1% | 31 | 5 (2 rz) | 5 (1 tds) | 57 (45 air) | 16.7 (#10) |
20 | BUF | Dane Jackson | 90.5% | 44 | 13 (1 rz) | 11 (1 tds) | 150 (78 air) | 31.8 (#2) |
21 | CIN | Mike Hilton | 92.5% | 32 | 10 (4 rz) | 7 (1 tds) | 78 (78 air) | 20.8 (#2) |
Week Wk | Opponent Opp | Primary Corner Primary Corner | Snap Share Snap Share | Routes Routes | Targets Targets | Receptions Receptions | Receiving Yards Receiving Yards | Fantasy Points Fantasy Points |
---|---|---|---|---|---|---|---|---|
1 | HOU | Bradley Roby | 86.6% | 29 | 6 (1 rz) | 5 (1 tds) | 46 (49 air) | 15.6 (#25) |
2 | LAC | Michael Davis | 91.5% | 43 | 11 | 5 (1 tds) | 99 (124 air) | 21.8 (#7) |
3 | BAL | Marlon Humphrey | 72.6% | 37 | 6 (2 rz) | 5 (1 tds) | 77 (89 air) | 21.2 (#12) |
4 | NE | Stephon Gilmore | 90.9% | 31 | 6 (1 rz) | 4 (1 tds) | 64 (107 air) | 16.4 (#20) |
5 | LV | Lamarcus Joyner | 87.9% | 43 | 6 (1 rz) | 3 | 78 (184 air) | 18.3 (#21) |
6 | BUF | Tre'Davious White | 86.3% | 30 | 3 (1 rz) | 3 | 20 (8 air) | 5.5 (#64) |
7 | DEN | Bryce Callahan | 72.0% | 23 | 10 (2 rz) | 6 (1 tds) | 55 (107 air) | 17.5 (#19) |
8 | NYJ | Pierre Desir | 76.1% | 40 | 6 | 4 (2 tds) | 98 (130 air) | 25.8 (#5) |
9 | CAR | Donte Jackson | 94.8% | 43 | 18 (3 rz) | 9 (2 tds) | 113 (232 air) | 33.1 (#3) |
11 | LV | Nevin Lawson | 89.0% | 44 | 14 (3 rz) | 11 (1 tds) | 102 (99 air) | 27.0 (#4) |
12 | TB | Carlton Davis | 88.7% | 48 | 15 (2 rz) | 13 (3 tds) | 269 (226 air) | 57.9 (#1) |
13 | DEN | Michael Ojemudia | 95.2% | 41 | 11 (2 rz) | 6 | 58 (98 air) | 14.8 (#33) |
14 | MIA | Xavien Howard | 88.5% | 35 | 7 | 3 (1 tds) | 79 (149 air) | 26.1 (#4) |
15 | NO | Marshon Lattimore | 87.2% | 44 | 10 (1 rz) | 6 (1 tds) | 53 (64 air) | 17.4 (#19) |
16 | ATL | Isaiah Oliver | 65.2% | 33 | 6 | 4 | 65 (80 air) | 10.5 (#39) |
Week Wk | Opponent Opp | Primary Corner Primary Corner | Snap Share Snap Share | Routes Routes | Targets Targets | Receptions Receptions | Receiving Yards Receiving Yards | Fantasy Points Fantasy Points |
---|---|---|---|---|---|---|---|---|
1 | JAC | Jalen Ramsey | 20.0% | 7 | 2 | 2 | 16 | 4.1 (##84) |
6 | HOU | Bradley Roby | 50.0% | 17 | 10 (1 rz) | 5 (2 tds) | 80 | 25.0 (##4) |
7 | DEN | Chris Harris | 89.5% | 27 | 5 | 3 (1 tds) | 74 | 16.4 (##16) |
8 | GB | Jaire Alexander | 91.1% | 33 | 9 (1 rz) | 6 | 76 | 14.1 (##23) |
9 | MIN | Trae Waynes | 98.1% | 34 | 8 | 6 (1 tds) | 140 | 26.5 (##4) |
10 | TEN | Adoree' Jackson | 89.5% | 47 | 19 (2 rz) | 11 (1 tds) | 157 | 33.0 (##3) |
11 | LAC | Michael Davis | 10.2% | 5 | 2 | 0 | 0 | 0.0 (##107) |
13 | OAK | Trayvon Mullen | 81.0% | 23 | 8 | 5 | 55 | 10.1 (##44) |
14 | NE | Jonathan Jones | 89.9% | 35 | 8 (1 rz) | 6 | 62 | 13.0 (##35) |
15 | DEN | Isaac Yiadom | 88.1% | 32 | 7 (2 rz) | 5 (2 tds) | 67 | 23.8 (##9) |
16 | CHI | Kyle Fuller | 93.5% | 34 | 5 | 5 | 72 | 12.2 (##35) |
17 | LAC | Adrian Phillips | 85.4% | 24 | 5 | 4 | 61 | 10.1 (##40) |
Week Wk | Opponent Opp | Primary Corner Primary Corner | Snap Share Snap Share | Routes Routes | Targets Targets | Receptions Receptions | Receiving Yards Receiving Yards | Fantasy Points Fantasy Points |
---|---|---|---|---|---|---|---|---|
1 | LAC | Casey Hayward | 75.9% | 15 | 8 (1 rz) | 7 (2 tds) | 169 | 36.3 (##2) |
2 | PIT | Artie Burns | 88.7% | 23 | 6 | 5 (1 tds) | 90 | 20.0 (##18) |
3 | SF | Jimmie Ward | 95.5% | 36 | 5 | 2 | 51 | 7.6 (##54) |
4 | DEN | Bradley Roby | 90.1% | 40 | 13 (2 rz) | 9 | 54 | 14.6 (##35) |
5 | JAC | Jalen Ramsey | 92.6% | 33 | 7 (2 rz) | 4 | 61 | 12.7 (##30) |
6 | NE | Jason McCourty | 98.1% | 36 | 12 (2 rz) | 7 (3 tds) | 142 | 39.2 (##1) |
7 | CIN | Dre Kirkpatrick | 76.5% | 23 | 10 (2 rz) | 7 (1 tds) | 68 | 20.6 (##10) |
8 | DEN | Chris Harris | 84.6% | 30 | 4 | 3 | 70 | 10.0 (##44) |
9 | CLE | T.J. Carrie | 100.0% | 30 | 5 | 4 | 69 | 12.5 (##23) |
10 | ARI | Patrick Peterson | 100.0% | 25 | 10 (2 rz) | 7 (2 tds) | 117 | 32.7 (##1) |
11 | LA | Sam Shields | 100.0% | 43 | 14 | 10 (2 tds) | 215 | 43.5 (##1) |
13 | OAK | Nick Nelson | 88.2% | 35 | 6 (1 rz) | 1 | 13 | 6.0 (##73) |
14 | BAL | Marlon Humphrey | 80.2% | 39 | 14 (2 rz) | 8 | 139 | 22.5 (##8) |
15 | LAC | Desmond King | 88.2% | 30 | 7 (2 rz) | 4 | 46 | 8.1 (##49) |
16 | SEA | Shaquill Griffin | 96.6% | 37 | 9 | 4 | 74 | 13.1 (##31) |
17 | OAK | Nick Nelson | 64.8% | 21 | 7 | 5 (1 tds) | 101 | 28.6 (##3) |
Week Wk | Opponent Opp | Primary Corner Primary Corner | Snap Share Snap Share | Routes Routes | Targets Targets | Receptions Receptions | Receiving Yards Receiving Yards | Fantasy Points Fantasy Points |
---|---|---|---|---|---|---|---|---|
1 | NE | - | 82.3% | 32 | 8 | 7 (1 tds) | 133 | 26.8 (##3) |
2 | PHI | - | 95.7% | 20 | 6 | 4 | 43 | 8.9 (##45) |
3 | LAC | - | 76.1% | 19 | 8 (1 rz) | 5 (1 tds) | 77 | 20.0 (##17) |
4 | WAS | - | 82.4% | 37 | 6 | 5 | 35 | 8.5 (##51) |
5 | HOU | - | 65.3% | 29 | 6 | 4 | 68 | 10.8 (##31) |
6 | PIT | - | 81.6% | 28 | 7 | 5 | 34 | 7.5 (##45) |
7 | OAK | - | 71.2% | 29 | 8 | 6 (1 tds) | 125 | 25.2 (##3) |
8 | DEN | - | 86.2% | 31 | 6 (1 rz) | 2 | 38 | 4.8 (##55) |
9 | DAL | - | 86.8% | 31 | 4 | 2 (1 tds) | 64 | 15.3 (##18) |
11 | NYG | - | 92.9% | 39 | 7 | 7 | 68 | 15.4 (##17) |
12 | BUF | - | 87.3% | 34 | 11 | 7 | 41 | 12.4 (##29) |
13 | NYJ | - | 97.7% | 32 | 9 | 6 (2 tds) | 185 | 36.5 (##1) |
14 | OAK | - | 100.0% | 36 | 6 | 4 | 75 | 11.5 (##39) |
15 | LAC | - | 96.8% | 28 | 6 (1 rz) | 5 (1 tds) | 88 | 19.8 (##11) |
16 | MIA | - | 84.9% | 35 | 7 (1 rz) | 6 | 109 | 16.8 (##7) |
Week Wk | Opponent Opp | Primary Corner Primary Corner | Snap Share Snap Share | Routes Routes | Targets Targets | Receptions Receptions | Receiving Yards Receiving Yards | Fantasy Points Fantasy Points |
---|---|---|---|---|---|---|---|---|
1 | SD | - | 14.9% | - | 1 (1 rz) | 1 | 9 | 7.9 (##64) |
2 | HOU | - | 12.5% | - | 2 (0 rz) | 2 | 8 | 2.7 (##105) |
3 | NYJ | - | 20.0% | - | 4 (1 rz) | 3 | 26 | 5.3 (##76) |
4 | PIT | - | 26.5% | - | 7 (2 rz) | 5 | 24 | 13.2 (##26) |
6 | OAK | - | 28.6% | - | 2 (0 rz) | 2 | 20 | 4.0 (##94) |
7 | NO | - | 34.6% | - | 1 (0 rz) | 1 | 38 | 13.1 (##30) |
8 | IND | - | 30.9% | - | 6 (1 rz) | 5 | 98 | 21.5 (##8) |
9 | JAC | - | 61.8% | - | 5 (3 rz) | 3 | 11 | 6.2 (##61) |
10 | CAR | - | 67.2% | - | 13 (0 rz) | 10 | 89 | 20.1 (##14) |
11 | TB | - | 69.2% | - | 5 (0 rz) | 4 | 59 | 10.7 (##38) |
12 | DEN | - | 81.4% | - | 10 (3 rz) | 9 | 52 | 26.5 (##7) |
13 | ATL | - | 53.2% | - | 6 (1 rz) | 5 | 53 | 12.2 (##35) |
14 | OAK | - | 47.2% | - | 6 (1 rz) | 6 | 66 | 17.8 (##13) |
15 | TEN | - | 53.6% | - | 3 (0 rz) | 0 | 0 | 12.8 (##34) |
16 | DEN | - | 38.4% | - | 5 (1 rz) | 0 | 0 | 15.5 (##24) |
17 | SD | - | 64.4% | - | 7 (1 rz) | 5 | 46 | 11.1 (##45) |
Value Over Stream: Valuation scheme calculates a player’s fantasy pts/game over the average waiver wire replacement in standard fantasy league formats during either the current season (or previous year during the offseason) and adjusts for positional bust rates. VOS rank in parenthesis spans all positions, enabling player comparisons across QB's, RB's, WR's, and TE's.
Miami Dolphins wide receiver Tyreek Hill said that ...
Alabama wide receiver Jameson Williams is considered the ...
The Kansas City Chiefs are trading six-time Pro Bowl wide ...
Player Popularity Index (PPI) ranks PlayerProfiler page views over the last 30 days. For example, the No. 1 PPI player page is the most frequently visited page in recent weeks.
Year Year | Games Games | Receptions Recs | Receiving Yards Rec Yds | Target Share Tgt Share | Catch Rate Catch Rate | Special Teams Yards Special Teams | Age Age | School School |
---|---|---|---|---|---|---|---|---|
2014 | 12 (WR) | 31 (40 tgts) | 281 (9.1 ypr) | 10.0% | 77.5% | 996 (3 tds) | 20 | Oklahoma State |
2015 | 11 (WR) | 27 | 444 (16.4 ypr) | 0.0% | 0.0% | 722 (4 tds) | 21 | West Alabama |
Tyreek Hill's production nearly fell off a cliff as the season progressed and due to issues off the field, he was projected by many to go undrafted. However, after an impressive workout at West Alabama's Pro Day, Hill was selected in the fifth round of the 2016 NFL draft by the Kansas City Chiefs. His 40 time, burst score, agility score, and catch radius all rank in the 94th percentile or higher. As a rookie, he recorded 61 receptions, 24 rushing attempts, and 53 returns, accounting for 10 total touchdowns. Over time, Hill rapidly moved up the depth charts of a potent Chiefs offense and put up seasons of 1,000 or more receiving yards in four of his first six seasons.
After his age-25 season in 2019, Hill signed a 3-year contract extension with the Chiefs worth $54 million to keep the core of one the heaviest passing offenses in the league together. In 2021, his 159 targets ranked No. 7, his 19.2% hog rate ranked No. 3, his 1,709 air yards ranked No. 3, and his 2.31 yards per route run ranked No. 11 in the NFL and he finished the fantasy football season as the No. 6 wide receiver, thanks in part to his 313 slot snaps and 536 routes run, both of which ranked top 20 at the position. Despite years behind him, Hill continues to be one of the most dynamic athletes in the league, ranking among the top 20 fastest ball-carriers in the NFL among all players, per Next Gen Stats. That dynamism is taking its talents to South Beach. Wanting a raise to become the highest-paid receiver in the NFL, Hill got dealt to the Miami Dolphins, who then signed him to a record-breaking four-year $120 million that guarantees him $72.2 million. Will Tyreek continue putting up gargantuan numbers with Tua Tagovailoa and without Patrick Mahomes? We'll soon find out.