
The PlayerProfiler website displays over 40 advanced stats and metrics on a player’s page, along with many, many more in PlayerProfiler’s Data Analysis tool. If you aren’t used to working with statistics or data analysis (using both terms broadly in this context), then trying to decipher left from right may be intimidating.
This guide is meant to de-mystify PlayerProfiler’s highlighted metrics and help you understand what drives running back success in fantasy football. The metrics are split into six sections, which I’ll cover individually: Opportunity, Productivity, Advanced Receiving, Efficiency, College Production & Workout Metrics, and Formation-Specific.
I’m going to structure this in a different way than normal. Instead of drowning out the conclusions with the noise of statistical jargon, I am going to deliver the conclusions, and then cover the methodology in a later section. I spent the past three weeks re-learning and expanding upon my introductory statistical knowledge, so that you don’t have to (My statistics professor would be so proud).
Note: Some terms/concepts may be slightly over-simplified for the purpose of conveying the message. Additionally, not every metric will be highlighted individually, for brevity.
Opportunity
You may have heard the phrase “Opportunity is king” before. It’s used frequently in the fantasy football community and rightfully so. It may sound painfully obvious, but there’s little else we can rely on with extreme confidence other than the fact that being on the field translates to opportunity, which ultimately generates fantasy points. Opportunity metrics by themselves are more correlated with fantasy points than efficiency. Also, they have the highest year-to-year correlation. T.J. Hernandez has done a fantastic study on this. In simpler terms, the opportunity a running back receives this year will tell us a lot about what level of opportunity he’s likely to receive the next year.
Weighted Opportunities
Not all touches are created equal. Weighted Opportunities, pioneered by Scott Barrett, adjusts a running back’s opportunity by factoring in the average fantasy points generated by different types of touches. Targets are worth over 2x more fantasy points than a carry, and thus are weighted heavily in this metric. Additionally, Red Zone and goal line touches are worth more than touches further out from the end zone.
If you kept track of Weighted Opportunities throughout last year, you would’ve identified Leonard Fournette as a must-have trade target early on in the season before he became a league winner. He dominated backfield snaps and touches, was a heavy target in the passing game, and was the primary red zone/goal line back. He didn’t fire right away, but when the volume is there, especially in a prolific offense, the points will come.
A seemingly obvious takeaway: obtain more high-value touches, generate more fantasy production. Yet, the focus still remains on situation-agnostic metrics. Weighted Opportunities has shown to be the most powerful predictor of fantasy points per game since 2017, showing a 0.82 R-Squared value (I’ll explain what that means later).
Opportunity Share
Opportunity Share is the percentage of the team running back carries and targets a player receives. From the definitions, it’s no shock that Opportunity Share is the most highly correlated variable with Weighted Opportunities. Despite being a building block to predict Weighted Opportunities, the analysis often stops at Opportunity Share. Where Opportunity Share falls short is that it does not account for which touches produce more fantasy points. Here are two key examples as to why Weighted Opportunities tells the more accurate story.
The D’Andre Swift Corollary
Of the 12 running backs to finish with at least 15 Weighted Opportunities per Game, D’Andre Swift saw the lowest Opportunity Share, finishing at 57-percent (No. 22 of qualified running backs). Despite this, he finished 10th with 16.4 Weighted Opportunities per Game and 16.1 (No. 8) Fantasy Points per Game. The Lions dependance on Swift in the passing game propelled his fantasy production.
Weighted opportunities might be my favorite RB stat on https://t.co/SMxUYrSc3B
Essentially, it weights RB carries & targets based on average fantasy points for each
And which "timeshare"/"1B" running back is #4 in the NFL in weighted opportunities after 3 weeks?
D'ANDRE SWIFT pic.twitter.com/iCZsiyvdXs
— Josh Larky (@jlarkytweets) September 28, 2021
The Elijah Mitchell Effect
6th-round rookie Elijah Mitchell came onto the scene by storm in 2021, racking up a 80.8-percent (No. 3) Opportunity Share. He ran the ball over 200 times, yet finished outside of the top 40 running backs in red zone touches. That and his lack of involvement in the passing game led to a disappointing 14.1 (No. 16) Weighted Opportunities per Game and 15.0 (No. 14) Fantasy Points per Game.
Snap Share
The best way to identify the players who are going to receive the most valuable touches are by identifying those who are going to be on the field the most. Since 2017, running backs who are on the field for at least 50-percent of snaps averaged 15 fantasy points per game. Those who failed to reach a 50-percent Snap Share averaged 9.4 fantasy points per game (minimum 35-percent Snap Share and 5 games played).
We saw Kenyan Drake pop for the Arizona Cardinals in 2020, scoring 12.8 (No. 24) Fantasy Points per Game while playing 56.8-percent of snaps. The following season, Drake packed up for Las Vegas, where he’d be joining bellcow Josh Jacobs. Knowing the veteran was headed for a touch-squeeze, his 2021 ADP (Average Draft Position) fell to RB41. He ended up being limited to a 34.7-percent (No. 59) Snap Share and 8.5 (No. 38) Fantasy Points per Game.
Snap Share, like Opportunity Share, is a situation agnostic metric. This can be broken down into subcategories, like Red Zone Snap Share and Route Participation to gain further predictive context as to how a running back may be used in an offense. The next question to be answered is, what drives Snap Share?
College Production, Workout Metrics, & Draft Capital
Previous opportunity is indicative of future opportunity in fantasy football. The previously linked study by T.J. Hernandez applies to rookies as well. College production and athleticism scores can tell us a lot about running backs. Like all metrics, it’s not a perfect science. However, it’s certainly not outlandish to assume that most players who were good in college are going to be good in the pros.
College Target Share
The best candidates to receive a significant Target Share in their rookie season are those with an upper percentile College Target Share and receiver rating. Michael Carter and Javonte Williams both posted a 9.2-percent (73rd percentile) College Target Share in the same backfield at North Carolina, and both surpassed a 10-percent Target Share in their rookie seasons. The Jets’ addition of Breece Hall, who posted a 10.7-percent (81st percentile) College Target Share, has plummeted Carter’s Underdog ADP down to RB48. Hall is bigger, faster, more athletic, and was drafted in the second round as opposed to the fourth. Because of this, it’s unlikely Carter sees a 10-percent Target Share in 2022
College Dominator Rating
Brought along by Frank DuPont, College Dominator Rating quantifies the percentage of a team’s offensive production that a particular player is responsible for generating. For running backs, this is the percentage of the team’s rushing and receiving yards. A high Dominator Rating tells us that a running back has the potential to handle a majority of a backfield’s opportunities. Similarly, a low Dominator Rating suggests that a running back struggled to separate from the competition (for whatever reason) in college and may face similar struggles in the next level.
You can find an example of this in Clyde Edwards-Helaire. The third-year back at LSU chalked up a 17.9-percent (30th percentile) Dominator Rating. Despite receiving first round draft capital, he has failed to separate from the competition in Kansas City. The Chiefs have brought in Ronald Jones (who may not stink, after all), and are reportedly falling in love with rookie Isiah Pacheco.
bad dynasty leaguers were actually drafting clyde edwards-helaire over jonathan fucking taylor. pic.twitter.com/j20X87V2HE
— the podfather™️ (@Fantasy_Mansion) January 10, 2021
In the case of College Dominator Rating, the caveat comes in the form of small school players. James Robinson earned a 48.7-percent (98th percentile) Dominator Rating in college, but was tossed aside and went undrafted. Why? Because that production came out of Illinois State University (Just a short drive from my hometown), which is not exactly a Power 5 school. When you go to a school that size, you have to earn a lion’s share of the opportunity to even be considered for the draft pool.
Breakout Age
A running back is considered to be a “breakout” when they reach a 15-percent Dominator Rating in a given season. The logic behind Breakout Age is very simple: those who show the ability to perform at an elite level earlier on in their career are more likely to have success at the next level. Looking at breakout age helps us separate the late-breakout, low draft capital, preseason hype trains like Ty’Son Williams from the actual promising candidates such as James Robinson.
Since 2017, running backs who finished with at least 15 fantasy points per game averaged a 19.5 Breakout Age, with only 5 of the 67 backs being 22 years or older (minimum 3 games). Two of those five are non breakouts, in Josh Jacobs and Chris Carson.
Breakout Age means more when there’s not as much draft capital invested in the running back. Josh Jacobs was unable to break out at Alabama, but was drafted in the first round by the (now) Las Vegas Raiders. It’s not shocking to see that one of the few running backs to be selected in the first round sees a high amount of touches. Carson’s story, on the other hand, is less common. It’s unlikely to see a poor college producer who almost went undrafted to become a workhorse back. Underdog stories may be fun to watch, but they aren’t the smart picks to bet on in the long run.
Draft Capital
The problem with both Dominator Rating and Breakout Age is that NFL front offices don’t give a hoot if some jag from Illinois State broke out at age 19 and earned a 48.7-percent (98th percentile) Dominator Rating. The level of competition is so far below that of the BCS, that he wasn’t even drafted. That’s a cloud that will loom over him until his next contract. The tie is so loose when you’re on an undrafted rookie deal that even when you prove your worth you’re replaced the next season.
Draft capital matters far more as a standalone metric than any individual college production or workout metric. Since 2017, running backs who were drafted on Day 1 and 2 averaged a 46.4-percent Opportunity Share, while Day 3 picks averaged a measly 22.2-percent. These players are investments that front office executives are making for their club. Like all investors, they’re looking for a return on that investment. The higher the draft capital invested, the higher the expected return. Similarly, the lower the investment, the easier it is to part ways and/or bring in a newer, better back to take over. Despite Robinson proving he can do everything required of him to be a lead back in the NFL, the Jaguars drafted super-producer Travis Etienne in the second round to be the lead back.
Speed Score
Speed Score, posited by Bill Barnwell, adjusts a player’s 40-time by incorporating the player’s weight, placing a premium on larger, faster backs. Since 2017, running backs that have averaged at least 15 fantasy points per game averaged a 104.1 (78th percentile) Speed Score. This means that a running back in this tier, on average, has a higher Speed Score than 78-percent of other players.
As history has shown us, you don’t need to be a freak athlete to be successful as a running back. Backs like Josh Jacobs and James Conner have posted top 12 seasons without impressive athleticism. The elite, league-winning running backs, on the other hand, typically have exceptional breakaway speed and record upper-percentile Speed Scores. When using Speed Score in conjunction with college production metrics, we can identify game-breaking prospects like Jonathan Taylor and Saquon Barkley.
Productivity
Going back to the previously linked article from T.J. Hernandez, we know that running back production is fairly sticky year over year. Because of this, I’ll skip over the counting stats.
Fantasy Points per Opportunity
Fantasy Points per Opportunity depicts the average amount of fantasy points scored every time a running back sees a carry or target. This metric can tell us how efficient a player was at scoring fantasy points but requires two key contextual details to be fully understood: How many opportunities a player is receiving, and where the majority of that player’s fantasy production is coming from.
Players like James Conner, who lacked involvement in the passing game and were propelled by frequently scoring touchdowns, are typically tagged as “regression candidates”. This simply means that their season was likely an outlier, and we should not expect that outcome to happen again this season. The veteran notched 1.07 (No. 4) Fantasy Points per Opportunity, finding paydirt on 7.5-percent (No. 1) of his touches. Scoring touchdowns at a high rate is not something we can rely on year-over-year. It’s likely that Conner scores touchdowns and fantasy points less frequently in 2022, but his increase in workload sans Chase Edmonds could keep Conner near the league-lead in rushing scores.
https://www.youtube.com/watch?v=OEYqiL7QNpg
In contrast, a player like Saquon Barkley is someone we can identify as a candidate for positive course-correction in 2022. Despite a healthy amount of carries and heavy usage in the passing game, he struggled to produce in the year following his torn ACL. Barkley was victimized by the health of himself and his team, posting 0.68 (No. 62) Fantasy Points per Opportunity. The Giants beat-up offensive line often got him stuffed on runs. To protect their long-term asset, the Giants gave more looks to Devontae Booker, even in the Red Zone. With a full offseason of health under his belt and an improved offensive line, Barkley will return to having a workhorse-level Opportunity Share.
Expected Fantasy Points per Game
Expected fantasy points calculates a player’s fantasy points if he and his teammates were to perform at league average on every play, based on different play characteristics. It accounts for down, distance, field position, play type, play direction, and play depth.
This metric tells us whether player X produced at a rate either above, at, or below the estimated league average. In the case of James Conner, his touchdown rate and efficiency with his minimal targets allowed him to score 2.49 more fantasy points per game than expected. Given the likely regression (return to average) in touchdown rate, it makes sense that he’s priced closer to his 14.7 (No .17) Expected Fantasy Points per Game from 2021.
Note: not every player was necessarily “lucky” if their fantasy points per game is higher than expected. A player like Jonathan Taylor, while he did have an above-average touchdown rate, is simply an above average running back. Elite performers will typically score more fantasy points than the league average.
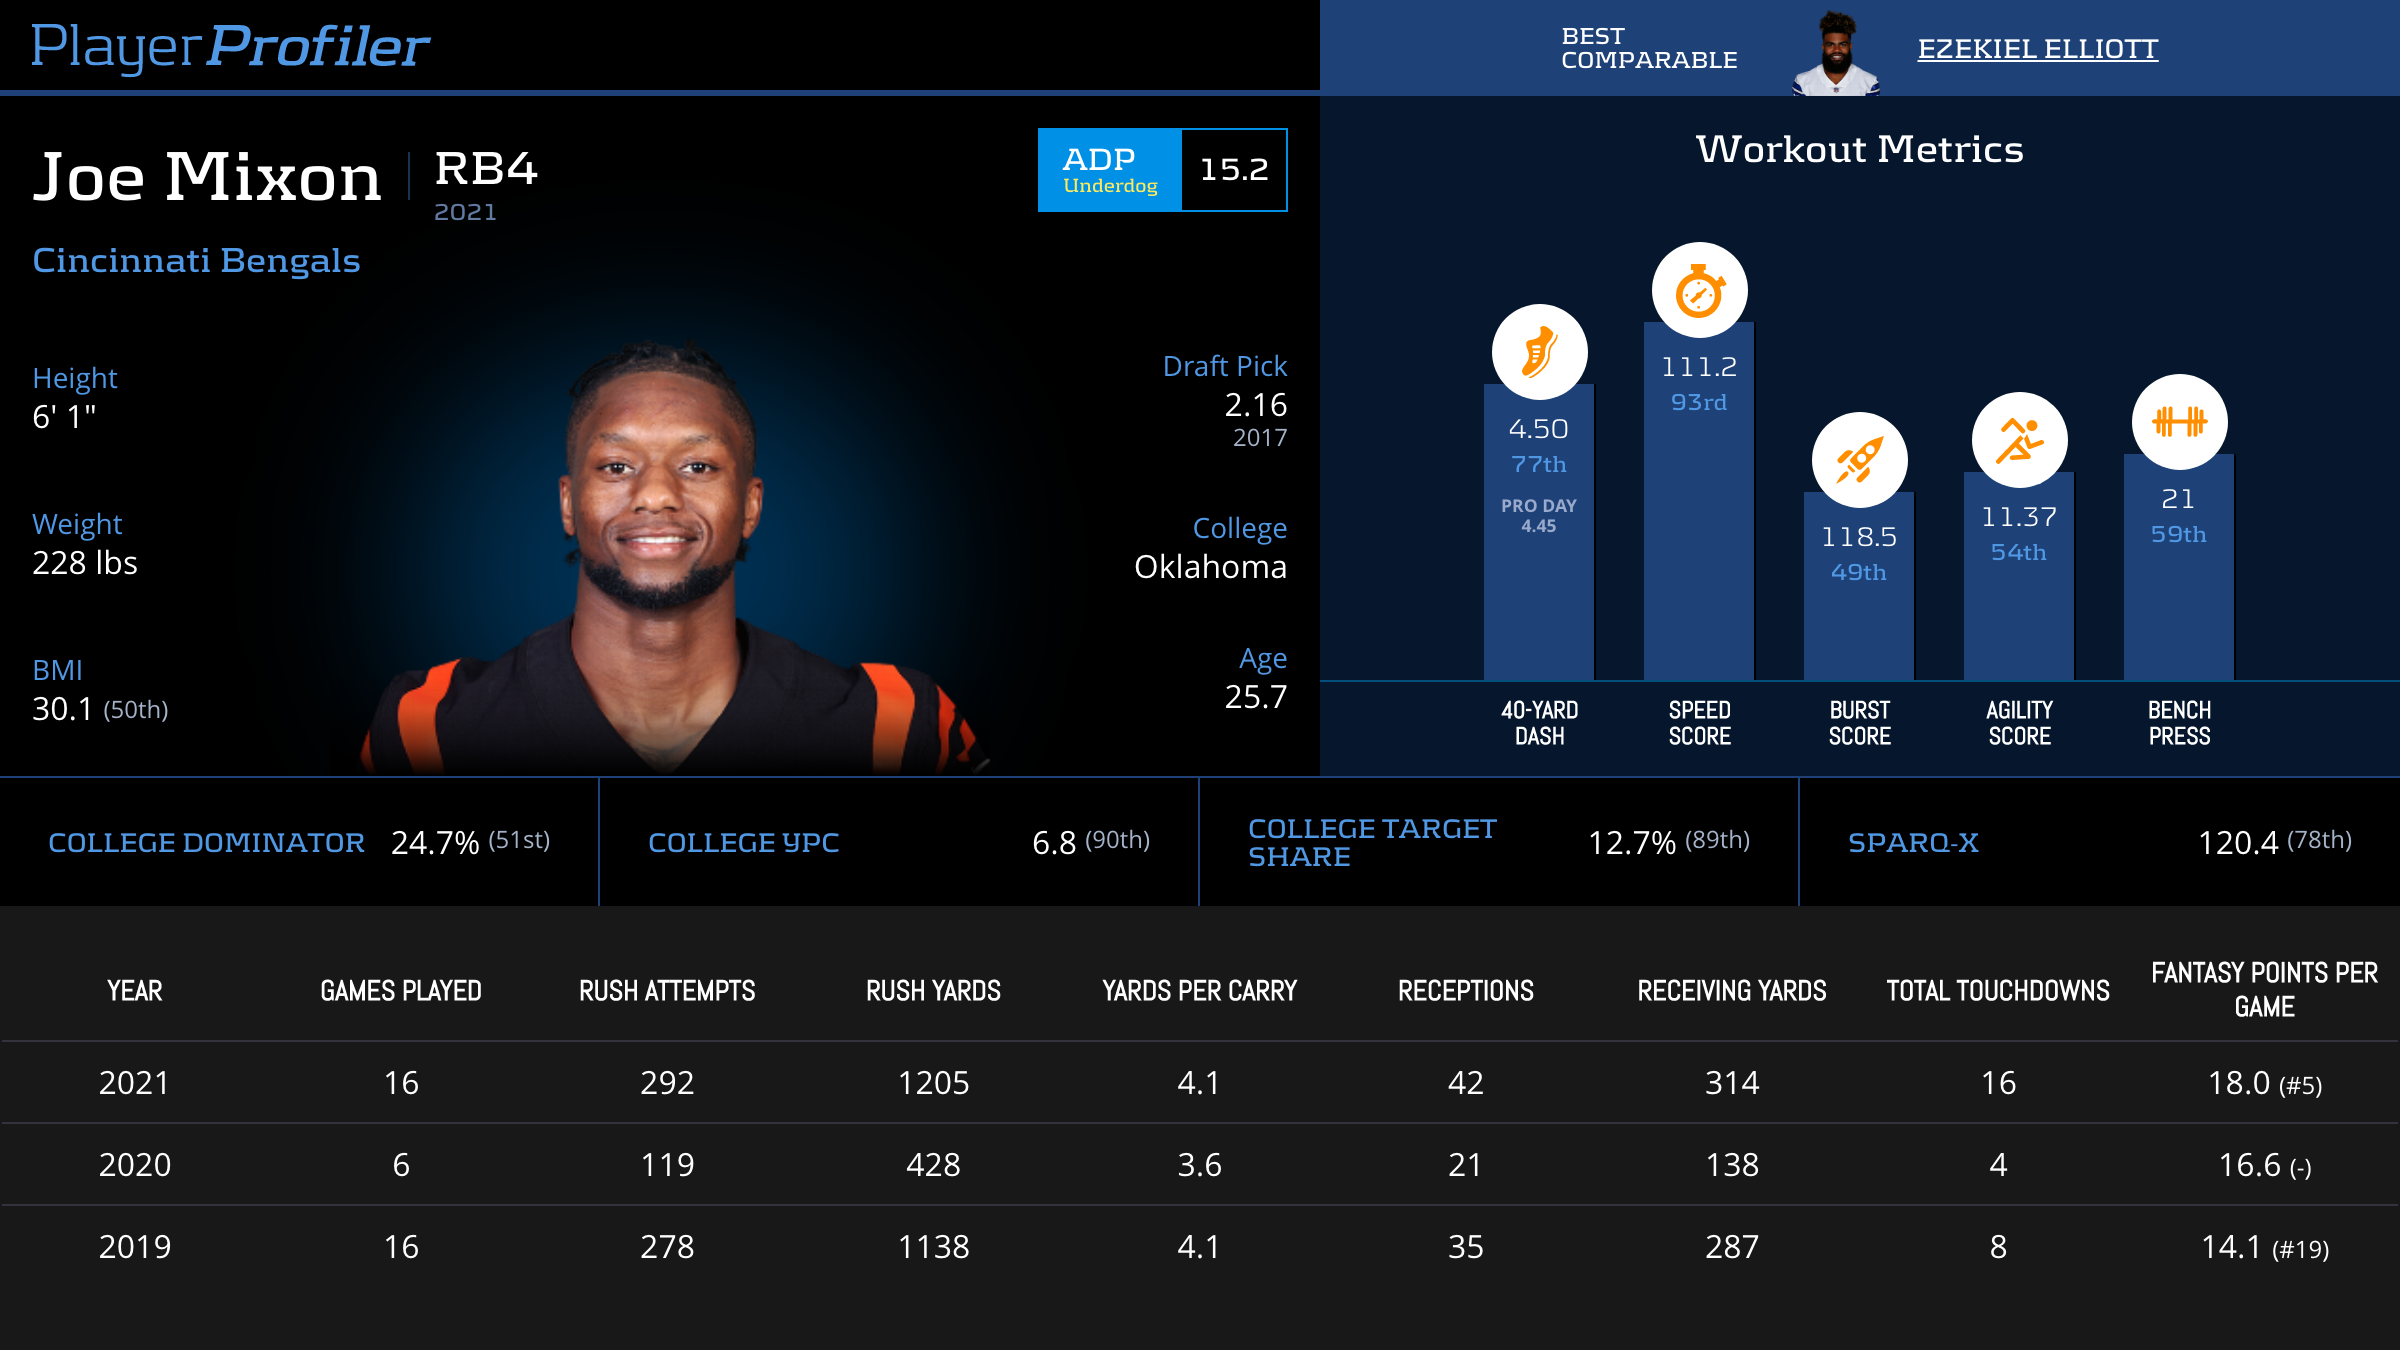
Joe Mixon Advanced Stats & Metrics Profile
Conversely, despite finishing with 18.0 (No. 5) Fantasy Points per Game, Joe Mixon was a player who underperformed last season. His lackluster efficiency metrics through both the ground and the air held him back from scoring an estimated 20.9 (No. 2) Expected Fantasy Points per Game. We’ve seen this efficiency flashed in prior seasons, and the Bengals made significant improvements to their offensive line. Mixon is a solid value right now, priced at RB7.
Advanced Receiving
Given how much more valuable targets are than carries for fantasy, being able to evaluate running back receiving production is important. The key to finding the league-winning, diamond in the rough, is most likely going to come from a back with high involvement in the passing game.
Target Share
Since 2015, 57 of the 69 running backs to average at least 15 fantasy points per game (minimum 4 games) earned at least a 10-percent Target Share. Leonard Fournette earned a 14-percent (No. 6) Target Share last season, en route to scoring 18.3 (No. 3) Fantasy Points per Game. Tampa Bay just lost Pro-Bowl Center Ryan Jensen for quite awhile, and Chris Godwin (although recovering quickly) is set to miss the start of the season.
Lombardi Lenny is BACK🏆
No. 7 Weighted Opportunities
No. 3 Fantasy Points Per Game
No. 7 Target Share
No. 15 Yards Created#nfl #football #freeagency pic.twitter.com/pZ2zJCbVgJ— PlayerProfiler (@rotounderworld) March 22, 2022
Despite the recurring story about Lenny’s weight, which never ends up mattering, he is going to earn an even higher share of the receiving opportunity early on this season. Right now, his ADP is the cheapest it’s been since early July.
The most highly targeted running backs are always going to have fantasy value. The efficiency in fantasy points that targets produce will always make a D’Andre Swift or Aaron Jones archetype in the second round preferable to a Derrick Henry archetype in the first.
Route Participation
To obtain a healthy Target Share, a player needs to be running routes. Route Participation tracks the percentage of team passing plays a player is running a route on.
If a 10-percent Target Share is our objective, how often does a running back need to be running routes? Since 2015, running backs who have participated in at least 30-percent of the team’s pass plays have averaged an 11.8-percent Target Share (minimum 3 games). Additionally, only 8 of the 131 backs to meet the 10-percent Target Share threshold had under a 30-percent Route Participation.
Damien Harris wasn’t known for being a pass catching back at Alabama, and that reputation held true in the NFL. He’s been the team’s lead back in terms of carries, but was sidelined as a receiver. He ran 25-percent of the team’s routes in 2021 and saw a 4.5-percent Target Share, which is a significant improvement from 2020. Harris finished as the RB18 in fantasy points per game while only catching 18 passes all season. The touchdown dependent running backs with little receiving volume are the easiest group to fade.
Yards per Reception / Yards per Target / Yards per Route Run
Two of the most popular receiving efficiency metrics are Yards per Catch and Yards per Route Run. These metrics are simple– they track the number of receiving yards, on average, a player earns for every reception, target, and route run.
Yards per Route Run gives us a more accurate picture of who the most effective pass catching running backs are. Yards per Reception lacks the context of how often that running back is targeted or even running routes. Thirdly, Yards per Target doesn’t take into account how often a running back is running routes.
Ty Johnson led all running backs in 2021 with 10.94 Yards per Reception, but that doesn’t tell the full story of his impact as a receiver. He only notched 34 (No. 30) receptions, due to running 38-percent (No. 33) of the team’s routes, being targeted on 25-percent (No. 17) of routes, and catching 62-percent (No. 31) of his targets. This is why using these efficiency metrics together is important. Johnson’s Yards per Reception prove that he is an effective receiver, but his Yards per Route Run show that he isn’t utilized enough for his efficiency as a receiver to matter.
Catch Rate
Catch Rate (receptions per target) and Drops are two of the biggest red herrings in fantasy football. First, Catch Rate includes uncatchable passes. Michael Carter, on 55 targets, finished last season with a 65.5-percent (No. 30) Catch Rate, with only three drops. This means that 16 of Carter’s 55 targets were uncatchable. This does not speak to his ability as a receiver. Drops must be used in conjunction to answer the question, “Was this player good at turning targets into receptions?”.
That being said, drops very rarely matter. Let’s rethink what a drop actually means. A drop is merely an opportunity for a reception. It’s no different than a carry for no yards. Both net zero yards, and zero fantasy points. When you’re a running back like Alvin Kamara, potentially the league’s best pass catching back, the coaching staff doesn’t care if you drop the ball 11 times. They care about the electric results that came from the 83 balls that he did catch (Kamara’s 2020 stats).
Efficiency
There is a lot that efficiency metrics can tell us about a player. Let’s quickly make clear what they are not useful for: Predicting production, opportunity, and future efficiency.
We can use efficiency metrics to identify talent, but you’ll be disappointed in the results when you try to apply any sort of correlation to production or future efficiency. Efficiency metrics are not very sticky year over year, which is due to the sometimes insurmountable other variables that can be stacked against you on any given play/game/season.
True Yards Per Carry
True Yards per Carry, brought to life by Zach Krueger, adjusts a player’s Yards per Carry so that runs of more than 10 yards will be discounted. This way, consistency as a running back is rewarded.
Rashaad Penny, who popped in a short stint last season, is an example of why True Yards per Carry is preferred to Yards per Carry. He’ll be hard-pressed to repeat his 12.6-percent (No. 1) Breakaway Run Rate and 15 (No. 4) Breakaway Runs on a larger workload in 2022. That’s why his 6.2 (No. 1) Yards per Carry is fool’s gold. His 5.2 (No. 2) True Yards per Carry is still impressive, but it is a more realistic look at a repeatable level of production.
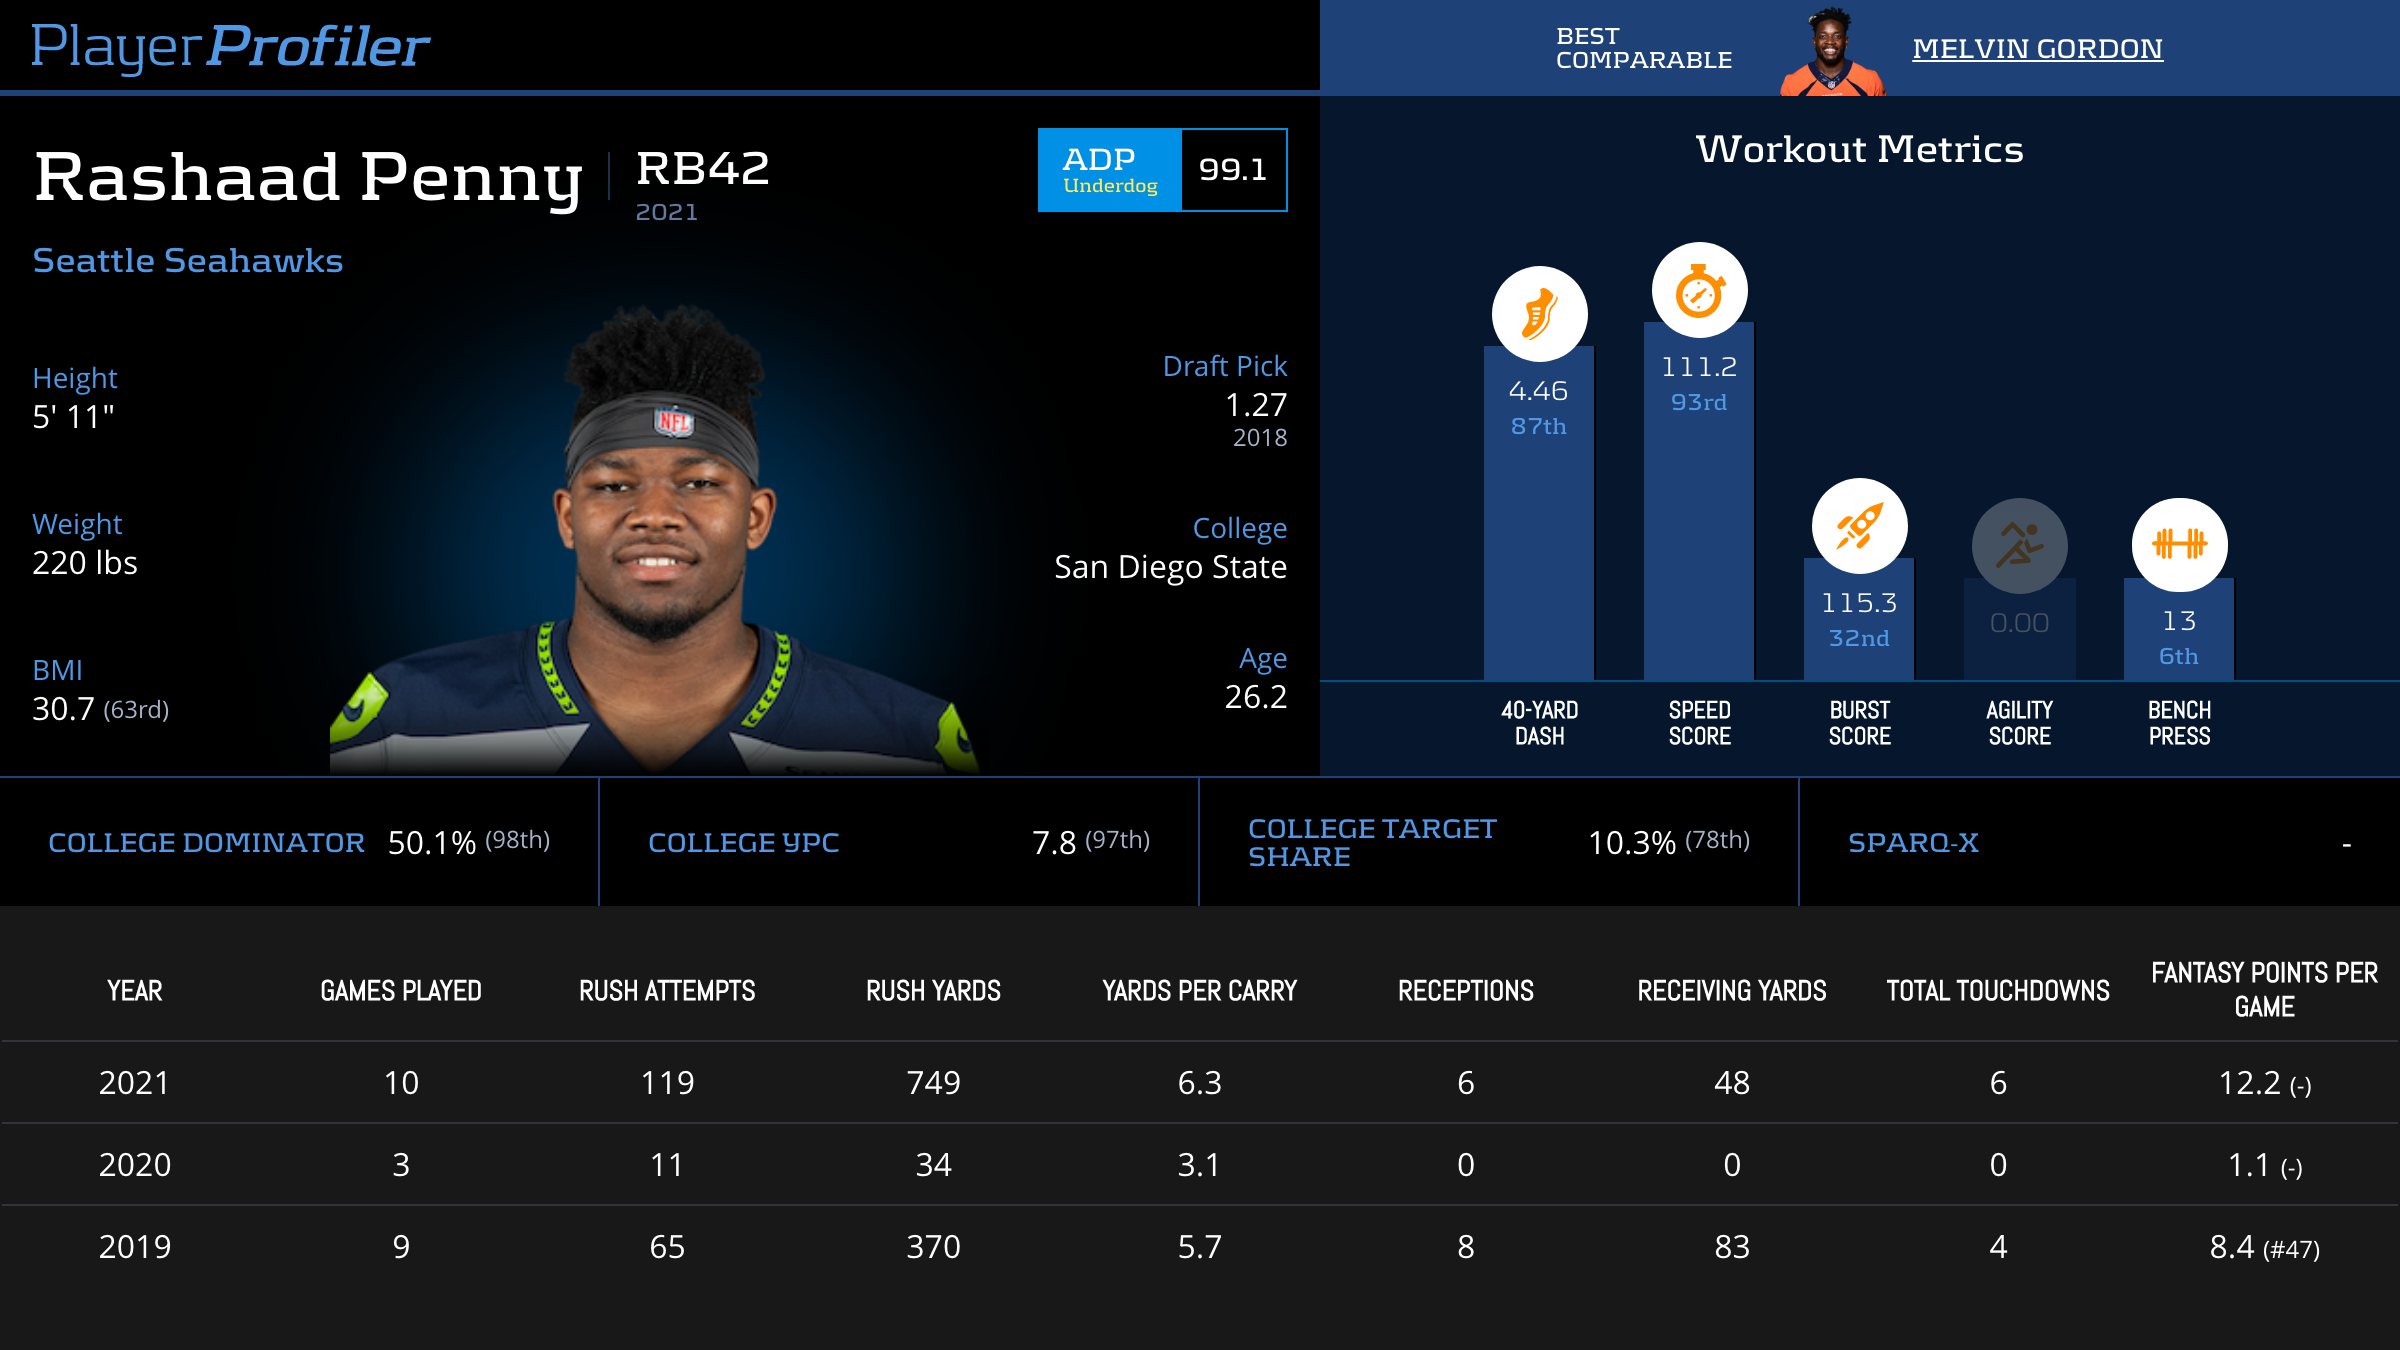
Rashaad Penny Advanced Stats & Metrics Profile
Putting together 3.8 (No. 55) True Yards per Carry in 2021, questions of D’Andre Swift‘s rushing ability began to rise. This criticism is erroneous on all counts. The Lions PFF Offensive Line Ranking last season was 15. Frank Ragnow, the team’s starting Center, missed all but four games last season. This unit created an abysmal 29.3 (No. 64) Run Blocking Rating for Swift, which led to Swift being met at or behind the line of scrimmage on 21-percent (No. 5) of his runs.
With the Lions’ offensive line at full strength and a full year under Penei Sewell‘s belt, they’ve skyrocketed up to No. 3 in PFF’s preseason rankings. We can expect a far more effective unit this year, and more efficiency on the ground from Swift.
Yards Per Touch
Yards per Touch calculates the amount of yards, on average, a player earns every time they touch the ball, whether it be from a handoff or pass. This gives us a solid high-level view of how efficient a back was with the ball in his hands. We can use additional metrics to add context to a player’s Yards per Touch.
The most efficient running back with at least 150 touches last season was none other than Tony Pollard (Eat your heart out Zeke stans). It’s easier to rack up a 6.2 (No. 2) Yards per Touch when you’re running behind an offensive line providing a 92.2 (No. 2) Run Blocking Rating for you, but Pollard’s elusiveness and ability to create yards for himself allowed him to separate further from the pack.
Juke Rate & Evaded Tackles
An evaded tackle is defined as a broken or missed tackle of any form in which the runner avoids/powers through the contact of the defender and continues to gain yards. Juke Rate is calculated by dividing a rusher’s amount of evaded tackles by their total touches. Juke Rate examines a player’s elusiveness and pure rushing ability on a per touch basis.
You don’t have to be a standout in this metric to be a solid rusher, but the standouts are worth taking note of. As a rookie, James Robinson showed electric playmaking ability with the ball in his hands, churning out a 27.3-percent (No. 13) Juke Rate and 5.6 (No. 6) Evaded Tackles per Game.
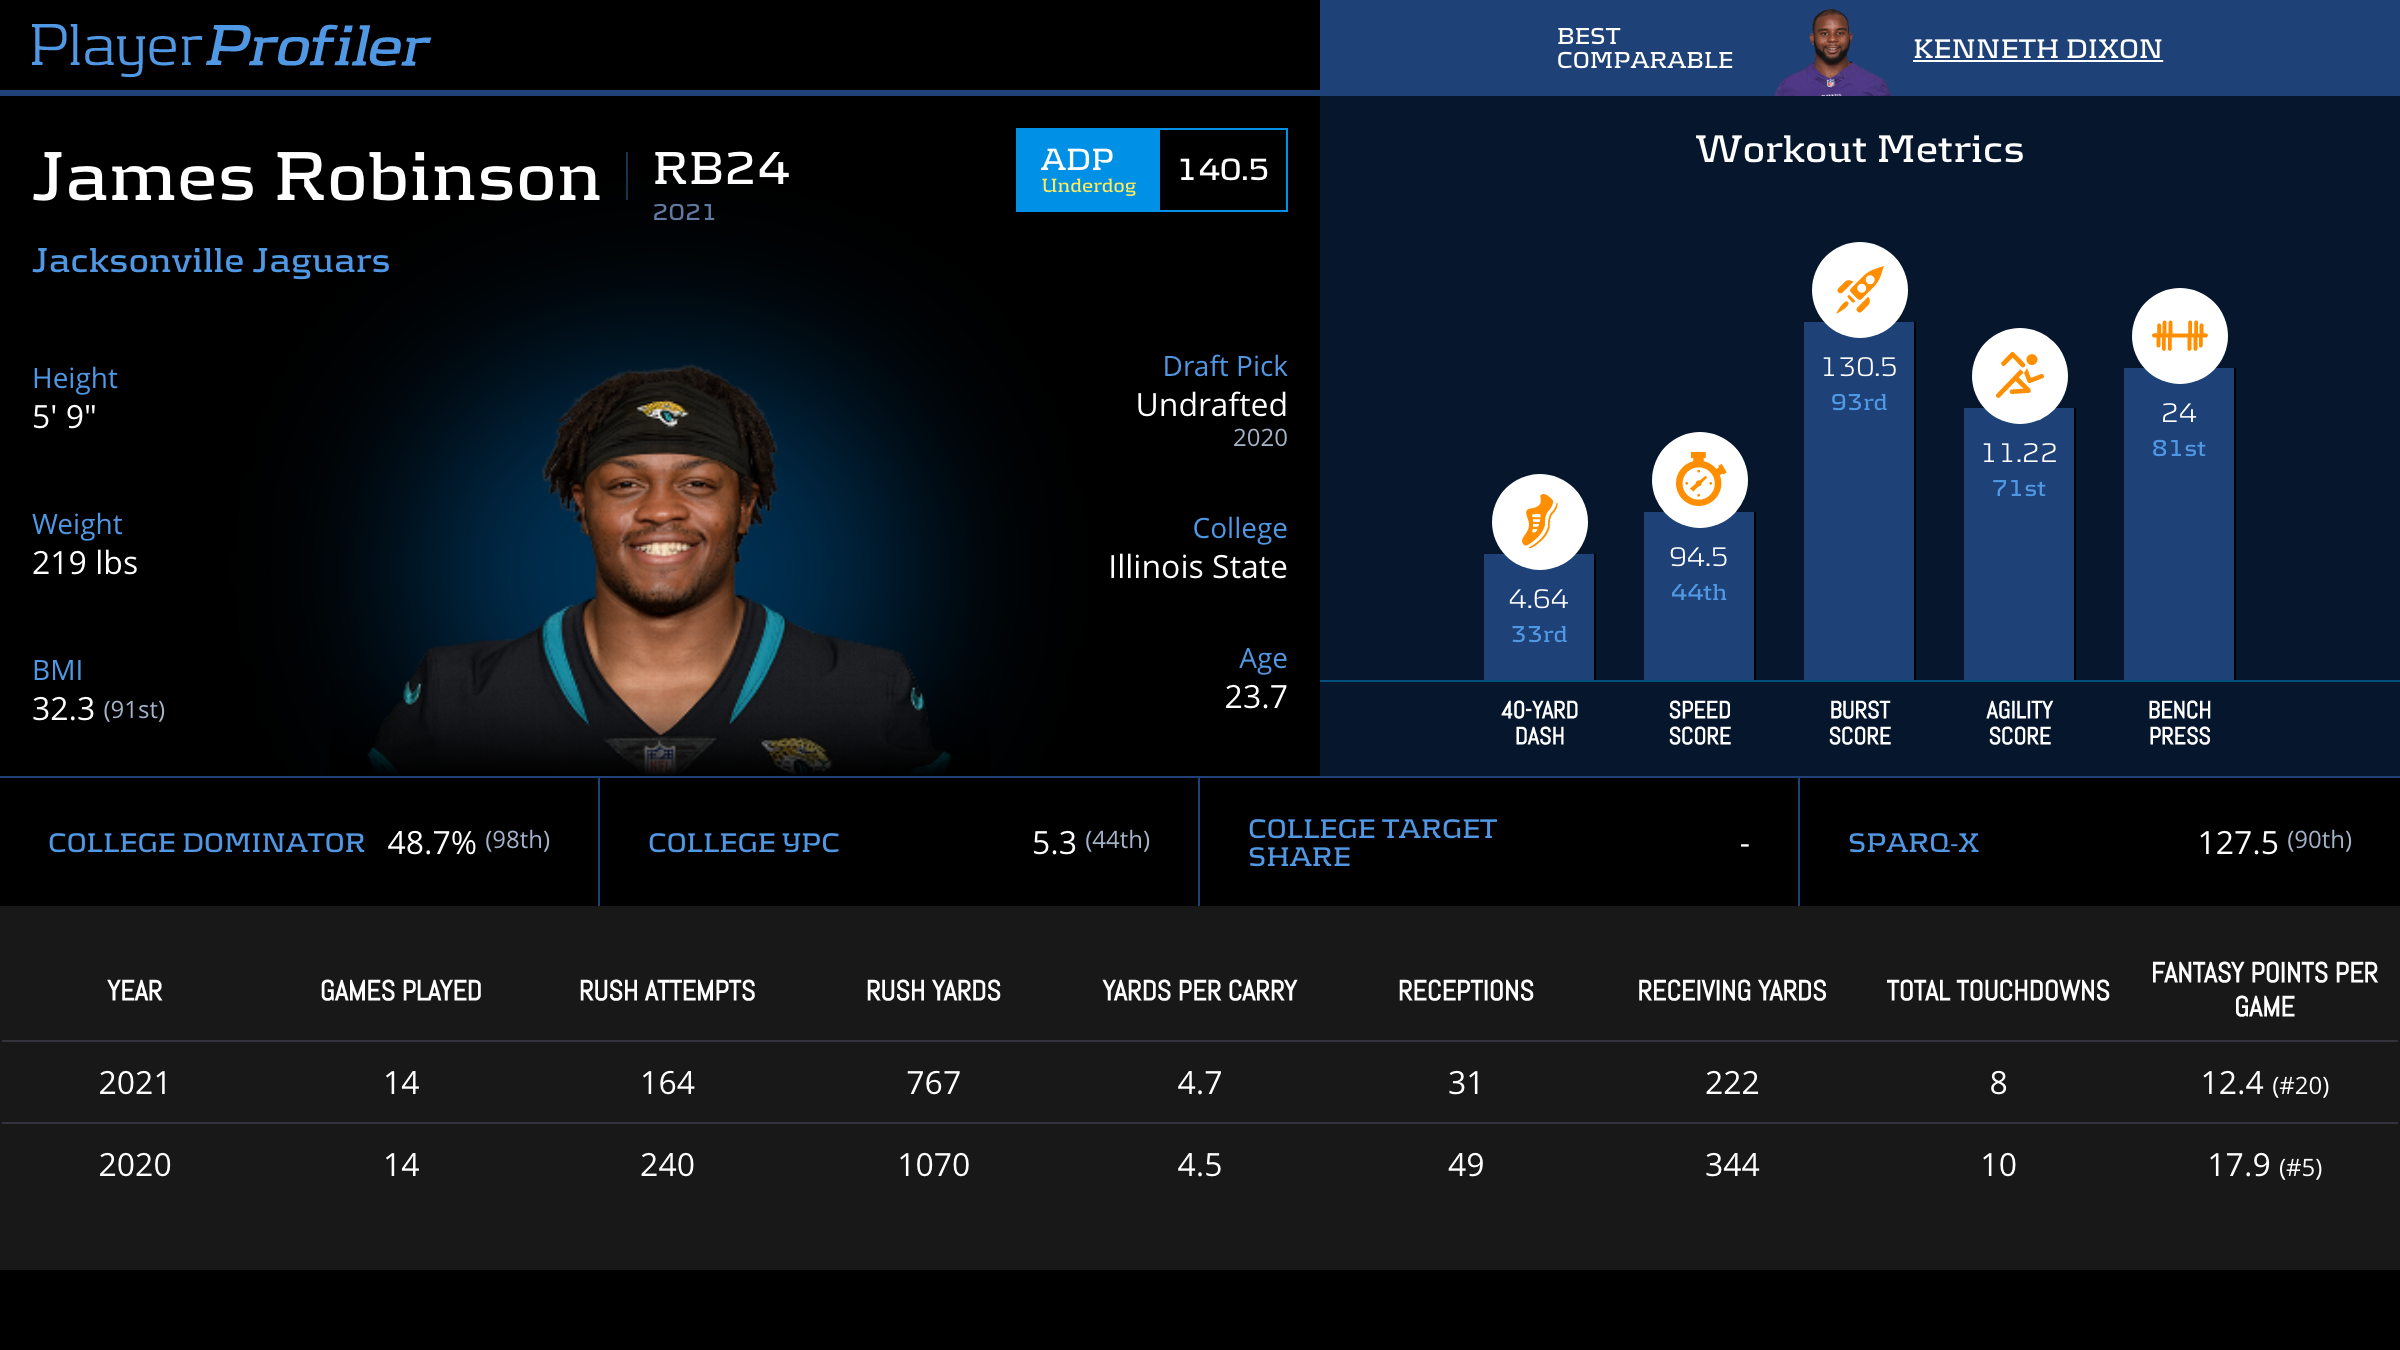
James Robinson Advanced Stats & Metrics Profile
Robinson proved to be an effective back who possessed worthwhile talent, but not all of the Juke Rate standouts in 2020 were elite ball carriers. Zack Moss was an easy outlier to spot. Moss posted a 29.4-percent (No. 7) Juke Rate, but only handled 126 touches the entire season. Robinson’s sustained efficiency and production over a 289 touch sample is far more impressive.
The Dangers of Counting Stats
As a quick aside, I’d like to use Nick Chubb and Najee Harris to illustrate the dangers of using counting stats (stats that add up over time, i.e rushing/passing/receiving yards) rather than per-game or per-touch efficiencies. Harris generated 106 (No. 2) Evaded Tackles to Chubb’s 92 (No. 3), but Chubb’s 6.6 Evaded Tackles per game was superior to Harris who finished with 6.2 Evaded Tackles per Game.
In this case, the per game efficiencies don’t accurately reflect the true rate of generating missed tackles. When broken down to the per-touch level, Chubb’s Juke Rate becomes 37.1-percent, while Harris falls well short at 27.8-percent. Using season-long numbers rather than per-game or per-touch metrics will almost always yield an invalid observation.
Yards Created & Yards Created per Touch
Yards Created per Touch encapsulates a players’ overall effectiveness beyond what was blocked on any given rush or reception, beyond the first evaded tackle. This metric pairs nicely with Juke Rate to show us how many yards each back is generating from their evaded tackles and puts it in a per-touch view to gauge how often these backs are compiling extra yards.
The advanced stats & metrics of Melvin Gordon and Javonte Williams were nearly identical in many aspects. They both posted a 33-percent (No. 9) Juke Rate and 4.8 (No. 10) Evaded Tackles per Game last season, but Williams out-gained Gordon by 0.8 Yards Created per Touch. Williams churned out 10.38 Yards Created per Evaded Tackle to Gordon’s 7.97. While they were similarly effective at evading tackles, Williams was more efficient at turning those evaded tackles into additional yardage.
Breakaway Runs & Breakaway Run Rate
A breakaway run is any rush of 15 yards or longer. Breakaway Run Rate is the percentage of carries that turn into a breakaway run. While Juke Rate measures the elusiveness of a running back, Breakaway Run Rate measures a running back’s explosiveness and ability to create chunk plays. Similarly to Juke Rate, Breakaway Run Rate is not highly correlated to fantasy production.
Rashaad Penny was a huge winner in this category last season. He exploded for 15 (No. 4) Breakaway Runs in 10 games, and did so at a league leading 12.6-percent rate. We knew that the speedster was capable of this type of hyper-efficient output, after seeing him post an 8.2-percent (No. 6) Breakaway Run Rate in his rookie season. Penny’s breakaway speed will keep him relevant in fantasy in 2022.
On the other side of the coin, Najee Harris struggled to display a high level of elusiveness or explosiveness in his rookie season. He would have needed to see 40 less total carries to elevate his 3.9-percent (No. 28) Breakaway Run Rate up to the league average of 4.5-percent. Because of his lack of explosiveness and elusiveness, Harris is more volume dependent than other backs. In a situation where he could end up seeing less touches than he did in 2021, it’s reasonable to want to fade him in 2022.
Production Premium
Production Premium takes the outcome of a running back’s rushes and targets and compares them to the league-average output given a similar game situation (down, distance, yard-line, two minute drill, “clock-milking”, and garbage time). This metric measures a running back’s situation agnostic efficiency. To put it another way, “Would this running back be more or less productive than average if every other running back saw his exact same workload?”
Like most efficiency metrics, they are not very sticky year-to-year. However, we can use seasonal Production Premium values to spot trends and recognize backs that may be incorrectly valued. Take Ezekiel Elliot, for example. He has not recorded a positive Production Premium since his 2016 rookie season. That’s FIVE straight seasons of below-average performance. On top of that, he finished outside of the top-20 running backs in Yards per Touch in all five of those seasons.
Tony Pollard, a good running back, has finished with a positive Production Premium all three seasons he’s been in the NFL, and finished inside of the top-10 running backs in Yards per Touch in 2019 and 2021. Every time the ball touches Pollard’s hands, lightning strikes. Yet, Zeke continues to be fed while Pollard is starved. If you don’t believe the hype from the fantasy community, listen to former NFL exec Mike Tannenbaum.
Last season, 23 of 26 qualified running backs with a negative Production Premium also finished with a negative Expected Fantasy Points Differential. Only 10 of 26 backs with a positive Production Premium finished with a negative differential. 88-percent of backs with a below average situation-agnostic efficiency also failed to meet their expected level of fantasy production.
Expected Points Added
Expected Points Added is a metric intended to help identify which running backs are helping their team put points on the board and win football games. The best example of how EPA is useful is found in the PlayerProfiler terms glossary, which says,
“For example, a 20-yard touchdown reception gets your receiver 9 points in PPR leagues, but the team was already going to score a FG, maybe even a touchdown, when they’re 20 yards from the end zone. On the other hand, a 20-yard reception on 3rd and 10 at midfield nets only 3 PPR fantasy points, but it turns a likely blown drive into at least a field goal opportunity.”
For running backs, Expected Points Added is not as highly correlated with fantasy points as it is with other positions. It’s far more frequent for a receiver to see chunk plays, and running backs see fare more plays with short yardage and negative yardage.
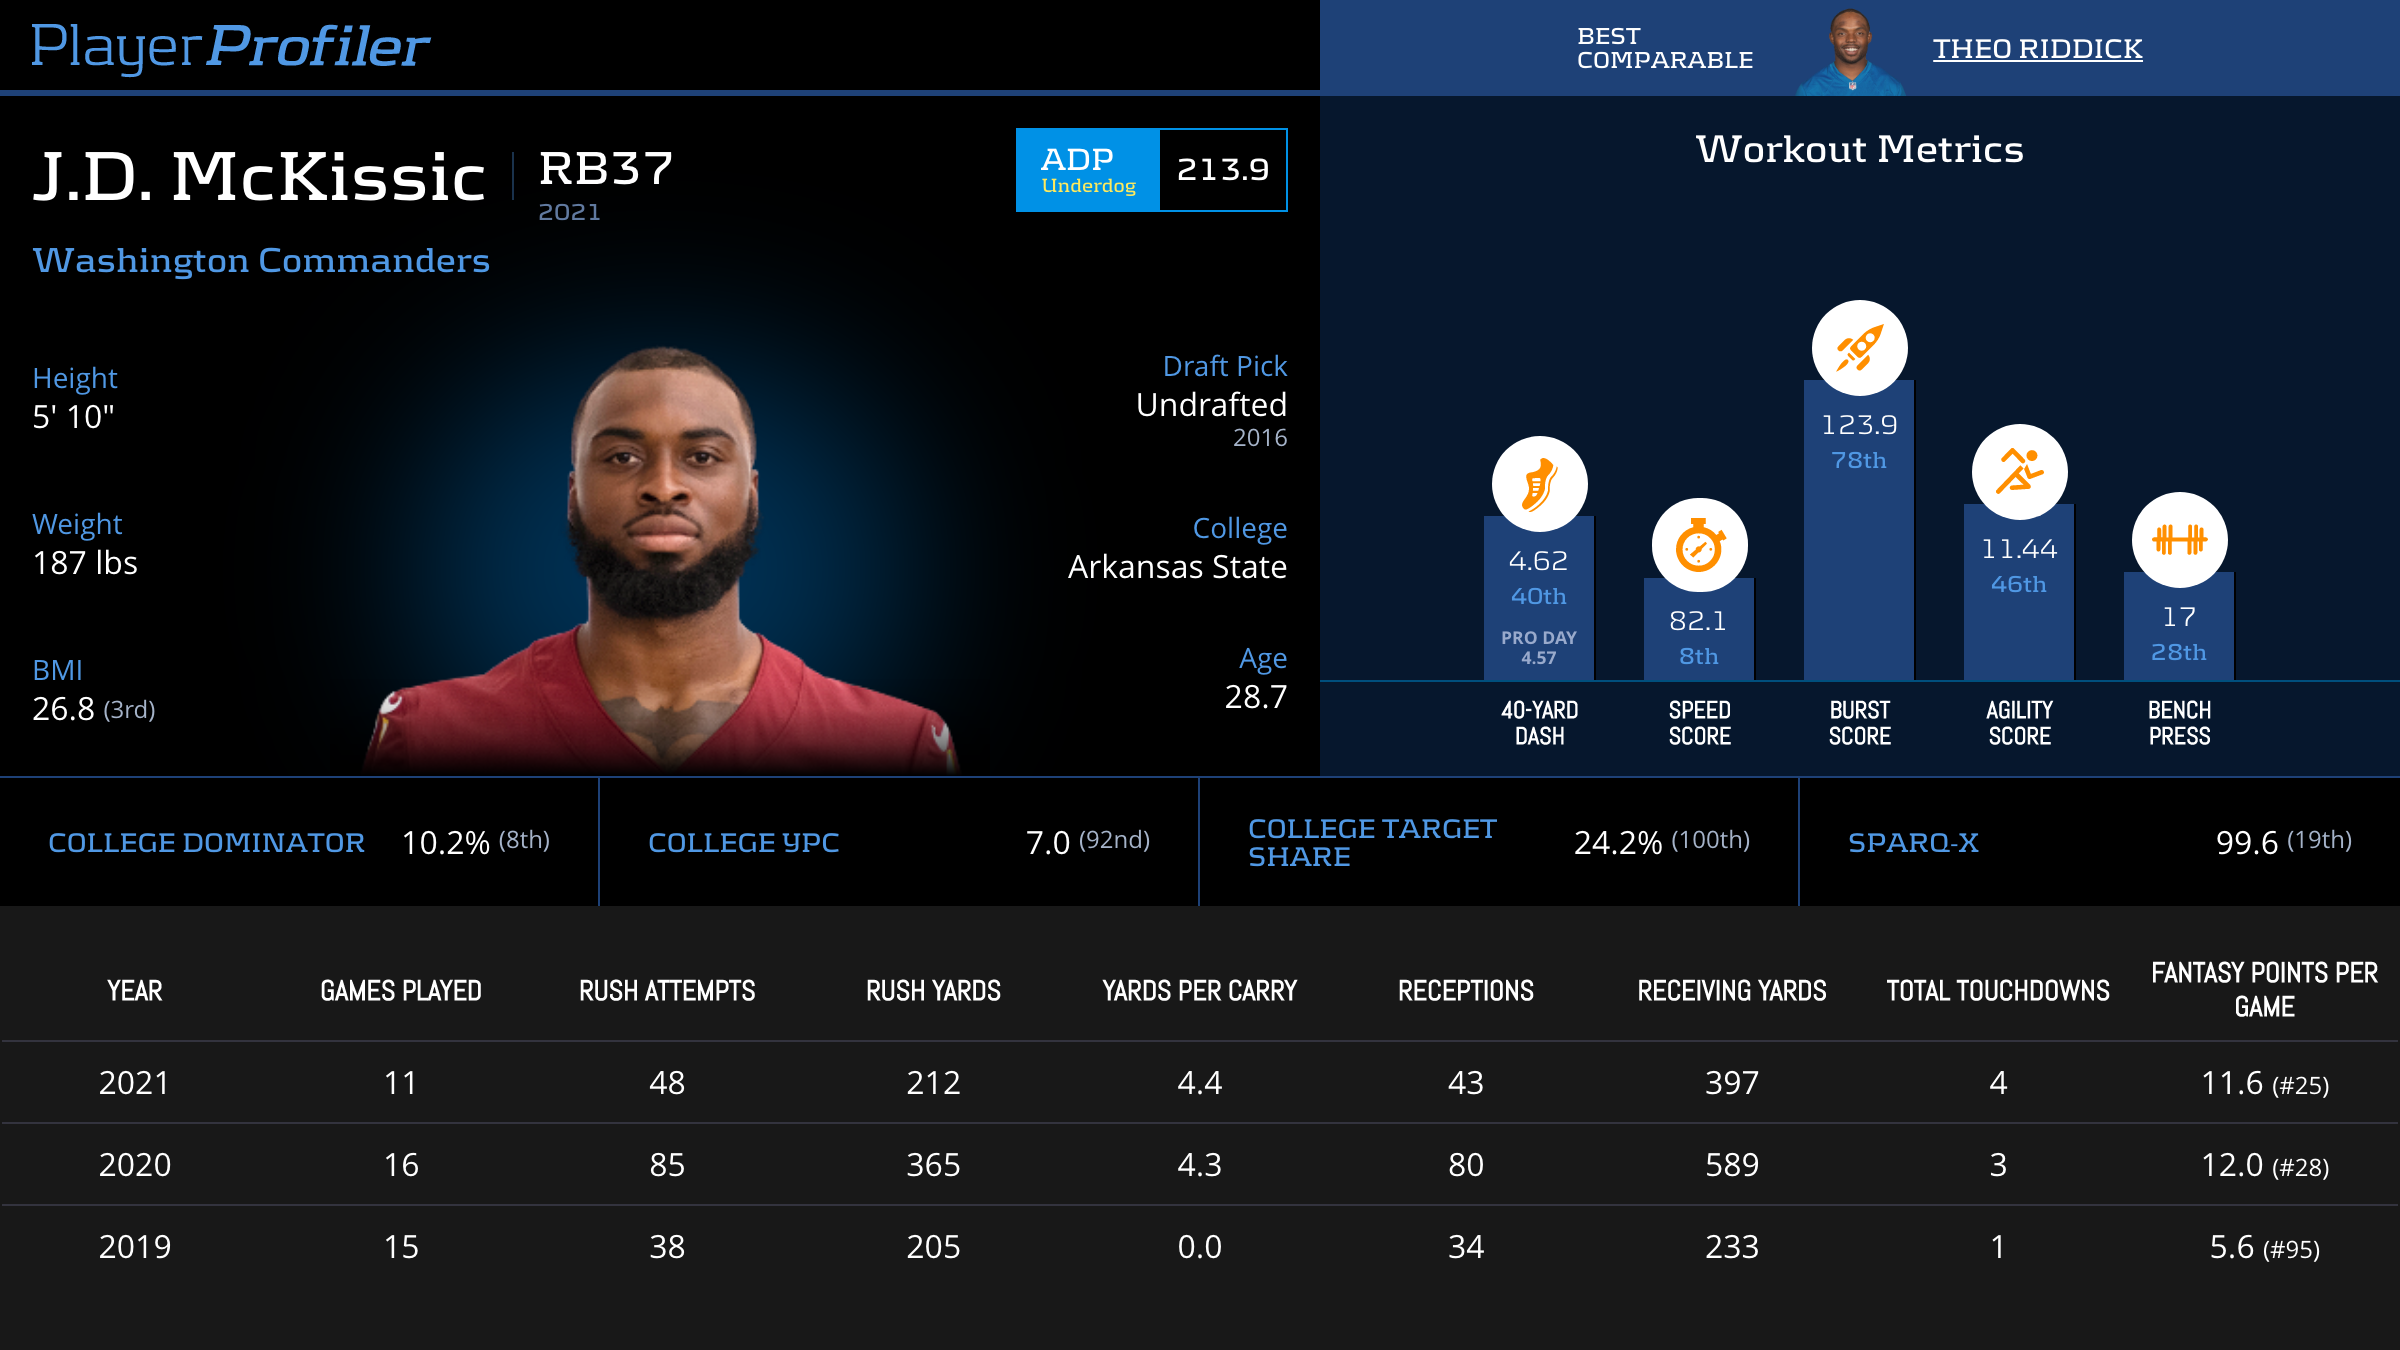
J.D. McKissic Advanced Stats & Metrics Profile
J.D. McKissic played a huge role in the Commanders offense in 2021, despite only seeing 91 total touches. The veteran scat back generated +26.3 (No. 1) Expected Points Added, contributing 12.5 more points than star receiver Terry McLaurin. 29 of his 91 touches (32-percent) were first downs, and 22 of those touches were between the 20’s (per footballdb.com). McKissic was frequently providing value in key positions on the field, while only seeing 3 stuffed runs all season.
On the surface, it may sound strange that McKissic could possibly lead running backs in this metric. McKissic benefitted from being schemed into the offense and used at very particular times. He churned out drive saving plays, without taking the grunt of the -1 yard rushes on 1st and 10 that teammate Antonio Gibson experienced.
Game Script
While Game Script is listed in the efficiency section, in my opinion, it belongs in the Opportunity section. The score of the game heavily influences how an offense is run, and Game Script encapsulates the average point differential a team faces at any point in the season. Positive Game Scripts indicate a team is usually playing with a lead, and vice versa.
The Lions saw the third worst Game Script in the NFL last season, trailing by an average of 5.9 points on any given play. That, as you can imagine, does not breed many high-value carries for running backs. Thankfully for D’Andre Swift, he is a pass catching back. Frequently facing a steep deficit allowed Swift to be peppered with targets, making up for the lack of carries. We expect the Lions to improve enough to get Swift more red zone and goal line touches, but still bad enough to have a decent amount of garbage time opportunity.
Run Blocking Rating
Run Blocking Rating takes into account the average yards blocked from the offensive line and stuffed run rate (more on that metric later) to generate a metric depicting the offensive line efficiency a given running back experiences.
D’Andre Swift‘s 29.3 (No. 64) Run Blocking Rating is the lowest of qualified running backs in 2021. He was frequently stopped behind the line of scrimmage, seeing a 21.9-percent (No. 6) Stuffed Run Rate. The lack of yards blocked from the offensive line played a large role in his sub-par rushing production. The sophomore attempted to make the best of a bad situation by creating 4.08 of his 5.0 yards per touch.
Review
Let’s briefly review some of the things we learned about running back metrics:
- Opportunity is King
- Draft Capital plays a big role in opportunity
- Receiving Opportunity is vital to be a valuable fantasy performer
- Prior opportunity is the best predictor for future opportunity
- Running backs who breakout early in college are more likely to succeed at the next level
- Efficiency metrics are not highly correlated with fantasy production
- Efficiency metrics are not sticky year over year
- It’s a glaring warning sign when a back displays subpar explosiveness and elusiveness over multiple seasons
- Contextual metrics like Run Blocking Rating can help us determine how much weight to put into the results of a given metric
The Metrics That Matter a Lot:
- Snap Share
- Weighted Opportunities per Game
- Opportunity Share
- Route Participation
- Target Share
- Draft Capital
- Speed Score
Methodology
The purpose of this article was to clearly communicate the value of the metrics shown on the PlayerProfiler page. I didn’t want to get caught up in statistical jargon and charts that are catered towards other fantasy analysts. My goal was to inform through the player stories and save the methodology for the end.
I grabbed every metric shown on the running back player pages from the last 5 seasons (2017-2021) as my sample. PlayerProfiler’s Snap Share data goes back to 2017, so that is the furthest back I can have data for all of my metrics of interest. The sample turned out to be 770 observations, which is plenty to draw statistically significant conclusions from.
How Metrics Correlate with Fantasy Points per Game (and each other)
I took every metric on a running back’s player page and measured the correlations (strength of influence) between them. Dominator Rating was left out due to it closer resembling a production metric. I will not dive into the pages of information that went behind my decision, but I chose the Kendall Rank Correlation test to evaluate the relationships. In fantasy football, the largest portion of the sample is going to score the fewest amount of fantasy points. This test assumes that characteristic.
To keep the chart concise, I limited the metrics to ones which had an R-Squared value of at least 0.15. I shortened Weighted Opportunities per Game to WOPG, as well. No efficiency metric made the 0.15 R-Squared cutoff.
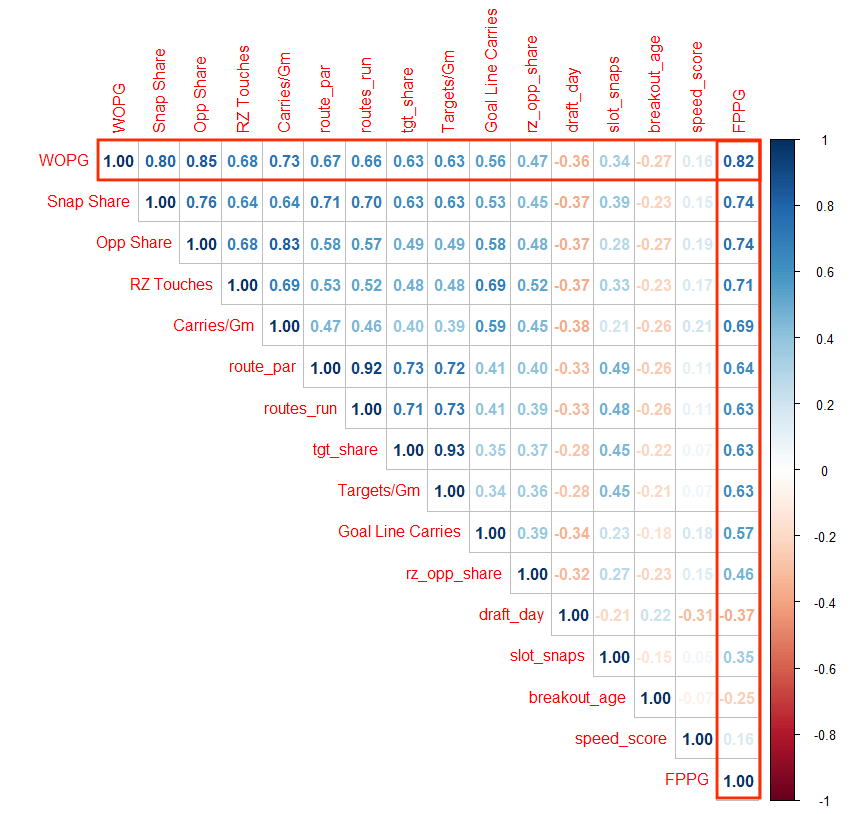
Running Back Advanced Metric Correlation Matrix (2017-2021)
The most important data points are in the first row and the last column. These show the correlation coefficients between other metrics for Weighted Opportunities and Fantasy Points per Game, respectively. The closer to 1 (or -1), the more highly (or negatively) correlated two metrics are. From this chart, can see the influential stranglehold that opportunity metrics have on fantasy production. We also see that, beyond opportunity, the draft day of the running back has the strongest influence on fantasy production. In the case of draft capital, as your draft round/day increases, your likelihood of scoring fantasy points decreases.
How Metrics Correlate with Fantasy Points per Game (and each other): Rookie Edition
I didn’t touch on rookie production much in specificity, so here it is in all it’s glory. I took the same sample from above, and limited down to rookie seasons. This did limit the sample down to 119 observations, which is small. However, since there’s nothing groundbreaking about the findings, we can still be confident in the results.
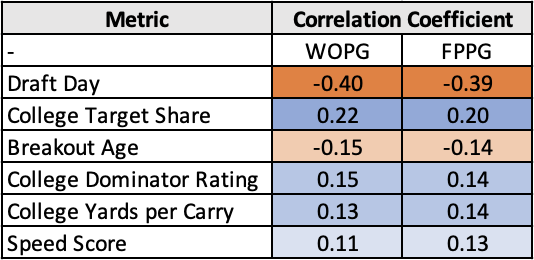
Correlation Coefficients between Running Back College Metrics and Rookie Season Opportunity/Production
Once again, we see draft capital is the biggest contributor to opportunity. A big surprise is that College Target Share was the next highly correlated metric with rookie opportunity. We can make sense of it by understanding the weight that targets have in Weighted Opportunities. Rachaad White should be a good case study this season into the validity of this finding.
Previously, Speed Score was known as one of (if not the) best predictors for rookie opportunity and production. While that hasn’t changed, limiting my sample size to 2017 accidentally allowed me to uncover a trend in recent seasons. Of the 32 rookie running backs to earn at least 10 Weighted Opportunities per Game, 18 tested with a Speed Score under 100.
Conclusion
Not every metric is going to be a holy grail, predicting in-game usage and fantasy production to a perfect T. However, that doesn’t mean we throw away the ones that aren’t. These advanced stats and metrics can all be used to help you think like a smarter fantasy player. They’ll help you ingest content from other sources as you form your own opinion in real-time.
Fellow content creators in the fantasy space are likely familiar with every metric that I discussed in this piece, but your league-mates in your home or office leagues probably have no idea they exist. I, among other analysts, use these metrics on a weekly basis to understand the story of the data behind a player’s performance. If you listen to the Podfather (if you don’t, what are you doing??), you hear him effortlessly weave these metrics into his stories show after show. This level of data literacy is a weapon that you can wield and use to draft, trade for, or pick up league winning assets.
Hopefully, you’re able to use this guide (and my upcoming ones for the other fantasy positions) to change the way you view advanced stats, and unlock the true power of PlayerProfiler’s player pages and Data Analysis tools.

