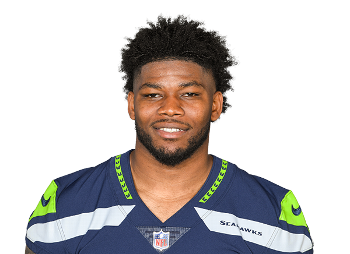
Rashaad Penny: "I Feel Amazing"
Seattle Seahawks running back Rashaad Penny was in ...
Year Year | Games Played Games | Rush Attempts Atts | Rush Yards Rush Yds | Yards Per Carry YPC | Receptions Rec | Receiving Yards Rec Yds | Total Touchdowns TD | Fantasy Points Per Game Fantasy Pts/Game |
---|---|---|---|---|---|---|---|---|
2021 | 10 | 119 | 749 | 6.3 | 6 | 48 | 6 | 12.2 |
2020 | 3 | 11 | 34 | 3.1 | 0 | 0 | 0 | 1.1 |
2019 | 9 | 65 | 370 | 5.7 | 8 | 83 | 4 | 8.4 (#47) |
2018 | 13 | 85 | 419 | 4.9 | 9 | 75 | 2 | 5.4 (#69) |
Snap Share | Opportunity Share | Weighted Opportunities | Team Run Plays Per Game Team Run Plays/Gm | Carries | Targets | Red Zone Touches |
---|---|---|---|---|---|---|
43.1% | 48.8% | 84.0 (8.4 p/g) | 22.4 (2.10 pace) | 119 (11.9 p/g) | 8 (0.8 p/g) | 18 (3 gl) |
#41 | #32 | #60 | #28 | #43 | #88 | #52 |
Rushing Yards | Receiving Yards | Receptions | Total TDs | Fantasy Points Per Opportunity Fantasy Pts/Opportunity | Fantasy Points Per Game | Expected Fantasy Points Per Game Expected Fantasy Pts/Gm |
---|---|---|---|---|---|---|
749 (74.9 p/g) | 48 (4.8 p/g) | 6 (0.6 p/g) | 6 (4.8% rate) | 0.96 | 12.2 (+4.12) | 8.1 (+4.12diff) |
#25 | #88 | #90 | #27 | #16 | - | #48 |
Target Share | Routes Run | Route Participation Route % | Yards Per Reception | Yards Per Route Run | Catch Rate Catch Rate | Drops |
---|---|---|---|---|---|---|
3.1% | 89 (8.9 p/g) | 32.6% | 8.0 (6.0 ypt) | 0.54 | 75.0% | 0 (0.0% rate) |
- | #67 | - | - | - | - | - |
True Yards Per Carry | Yards Per Touch | Juke Rate | Evaded Tackles | Breakaway Run Rate | Breakaway Runs | Best Ball Points Added |
---|---|---|---|---|---|---|
5.2 (6.3 ypc) | 6.4 | 25.6% | 32 (3.2 p/g) | 12.6% | 15 (1.5 p/g) | 71.6 (7.16 p/g) |
#2 | #1 | #28 | #43 | #1 | #4 | #28 |
Yards Created | Yards Created Per Touch Yards Created/Touch | Production Premium | Expected Points Added (EPA) Expected Pts Added | Dominator Rating | Game Script | Run Blocking Rating |
---|---|---|---|---|---|---|
479 (47.9 p/g) | 3.83 | +8.4 | +11.8 | 20.6% | +1.24 | 67.9 |
#31 | #2 | #8 | #12 | #24 | #9 | #22 |
Average Defenders In The Box Defenders In The Box | Stacked Front Carry Rate Stacked Front Carry % | Base Front Carry Rate Base Front Carry % | Light Front Carry Rate Light Front Carry % | Shotgun Carry Rate Shotgun Carry % | Under Center Carry Rate Under Center Carry % | Stuffed Runs |
---|---|---|---|---|---|---|
6.5 | 8.4% (5.5 ypc) | 32.8% (8.2 ypc) | 58.8% (5.8 ypc) | 39.5% (1.0 ypc) | 60.5% (1.0 ypc) | 17 (14.3% rate) |
#29 | #36 | #24 | #22 | #21 | #41 | #45 |
Snap Share | Opportunity Share | Weighted Opportunities | Team Run Plays Per Game Team Run Plays/Gm | Carries | Targets | Red Zone Touches |
---|---|---|---|---|---|---|
19.6% | 14.9% | 6.6 (2.2 p/g) | 25.6 (2.05 pace) | 11 (3.7 p/g) | 0 (0.0 p/g) | 2 (0 gl) |
#87 | - | - | #82 | #112 | #139 | #110 |
Rushing Yards | Receiving Yards | Receptions | Total TDs | Fantasy Points Per Opportunity Fantasy Pts/Opportunity | Fantasy Points Per Game | Expected Fantasy Points Per Game Expected Fantasy Pts/Gm |
---|---|---|---|---|---|---|
34 (11.3 p/g) | 0 (0.0 p/g) | 0 (0.0 p/g) | 0 (0.0% rate) | 0.31 | 1.1 (-0.57) | 1.7 (-0.57diff) |
#115 | #135 | #137 | #102 | - | - | - |
Target Share | Routes Run | Route Participation Route % | Yards Per Reception | Yards Per Route Run | Catch Rate Catch Rate | Drops |
---|---|---|---|---|---|---|
0.0% | 10 (3.3 p/g) | 10.5% | 0.0 (0.0 ypt) | 0.00 | 0.0% | 0 (0.0% rate) |
- | #123 | - | - | - | - | #80 |
True Yards Per Carry | Yards Per Touch | Juke Rate | Evaded Tackles | Breakaway Run Rate | Breakaway Runs | Best Ball Points Added |
---|---|---|---|---|---|---|
3.1 (3.1 ypc) | 3.1 | 18.2% | 2 (0.7 p/g) | 0.0% | 0 (0.0 p/g) | 0.0 (0.00 p/g) |
- | - | - | #114 | - | #99 | #111 |
Yards Created | Yards Created Per Touch Yards Created/Touch | Production Premium | Expected Points Added (EPA) Expected Pts Added | Dominator Rating | Game Script | Run Blocking Rating |
---|---|---|---|---|---|---|
5 (1.7 p/g) | 0.45 | -42.2 | -4.6 | 3.7% | +2.31 | 59.1 |
#133 | - | #151 | #93 | - | #24 | - |
Average Defenders In The Box Defenders In The Box | Stacked Front Carry Rate Stacked Front Carry % | Base Front Carry Rate Base Front Carry % | Light Front Carry Rate Light Front Carry % | Shotgun Carry Rate Shotgun Carry % | Under Center Carry Rate Under Center Carry % | Stuffed Runs |
---|---|---|---|---|---|---|
6.4 | 0.0% (0.0 ypc) | 36.4% (2.3 ypc) | 63.6% (3.6 ypc) | 72.7% (3.5 ypc) | 27.3% (2.0 ypc) | 3 (27.3% rate) |
- | - | - | - | - | - | #98 |
Snap Share | Opportunity Share | Weighted Opportunities | Team Run Plays Per Game Team Run Plays/Gm | Carries | Targets | Red Zone Touches |
---|---|---|---|---|---|---|
23.6% | 27.5% | 56.3 (6.3 p/g) | 30.1 (2.19 pace) | 65 (7.2 p/g) | 11 (1.2 p/g) | 9 (1 gl) |
#84 | #62 | #70 | #3 | #55 | #83 | #68 |
Rushing Yards | Receiving Yards | Receptions | Total TDs | Fantasy Points Per Opportunity Fantasy Pts/Opportunity | Fantasy Points Per Game | Expected Fantasy Points Per Game Expected Fantasy Pts/Gm |
---|---|---|---|---|---|---|
370 (41.1 p/g) | 83 (9.2 p/g) | 8 (0.9 p/g) | 4 (5.5% rate) | 0.99 | 8.4 | - |
#49 | #73 | #82 | #42 | #37 | #47 | - |
Target Share | Routes Run | Route Participation Route % | Yards Per Reception | Yards Per Route Run | Catch Rate Catch Rate | Drops |
---|---|---|---|---|---|---|
4.3% | 39 (4.3 p/g) | 14.6% | 10.4 (7.5 ypt) | 2.13 | 72.7% | 0 (0.0% rate) |
- | #82 | - | - | - | - | #91 |
True Yards Per Carry | Yards Per Touch | Juke Rate | Evaded Tackles | Breakaway Run Rate | Breakaway Runs | Best Ball Points Added |
---|---|---|---|---|---|---|
5.1 (5.7 ypc) | 6.2 | 13.7% | 10 (1.1 p/g) | 7.7% | 5 (0.6 p/g) | 34.2 (3.80 p/g) |
#2 | - | - | #75 | - | #34 | #46 |
Yards Created | Yards Created Per Touch Yards Created/Touch | Production Premium | Expected Points Added (EPA) Expected Pts Added | Dominator Rating | Game Script | Run Blocking Rating |
---|---|---|---|---|---|---|
97 (10.8 p/g) | 1.33 | +32.7 | +6.4 | 13.7% | -1.45 | 106.2 |
#57 | - | #5 | #23 | #52 | #16 | #1 |
Average Defenders In The Box Defenders In The Box | Stacked Front Carry Rate Stacked Front Carry % | Base Front Carry Rate Base Front Carry % | Light Front Carry Rate Light Front Carry % | Shotgun Carry Rate Shotgun Carry % | Under Center Carry Rate Under Center Carry % | Stuffed Runs |
---|---|---|---|---|---|---|
6.6 | 12.3% (2.1 ypc) | 46.2% (7.4 ypc) | 38.5% (4.9 ypc) | 44.6% (5.5 ypc) | 52.3% (5.9 ypc) | 8 (12.3% rate) |
#38 | - | #22 | - | - | - | #66 |
Snap Share | Opportunity Share | Weighted Opportunities | Team Run Plays Per Game Team Run Plays/Gm | Carries | Targets | Red Zone Touches |
---|---|---|---|---|---|---|
22.6% | 23.0% | 69.8 (5.4 p/g) | - (2.14 pace) | 85 (6.5 p/g) | 12 (0.9 p/g) | 10 (0 gl) |
#87 | #72 | #67 | - | #54 | #79 | #66 |
Rushing Yards | Receiving Yards | Receptions | Total TDs | Fantasy Points Per Opportunity Fantasy Pts/Opportunity | Fantasy Points Per Game | Expected Fantasy Points Per Game Expected Fantasy Pts/Gm |
---|---|---|---|---|---|---|
419 (32.2 p/g) | 75 (5.8 p/g) | 9 (0.7 p/g) | 2 (2.1% rate) | 0.73 | 5.4 | - |
#46 | #76 | #77 | #61 | #87 | #69 | - |
Target Share | Routes Run | Route Participation Route % | Yards Per Reception | Yards Per Route Run | Catch Rate Catch Rate | Drops |
---|---|---|---|---|---|---|
3.7% | 49 (3.8 p/g) | 14.2% | 8.3 (6.2 ypt) | 1.53 | 75.0% | 2 (16.7% rate) |
- | #74 | - | - | - | - | #30 |
True Yards Per Carry | Yards Per Touch | Juke Rate | Evaded Tackles | Breakaway Run Rate | Breakaway Runs | Best Ball Points Added |
---|---|---|---|---|---|---|
4.6 (4.9 ypc) | 5.3 | 29.8% | 28 (2.2 p/g) | 8.2% | 7 (0.5 p/g) | 10.3 (0.80 p/g) |
#16 | #21 | #13 | #48 | #6 | #26 | #71 |
Yards Created | Yards Created Per Touch Yards Created/Touch | Production Premium | Expected Points Added (EPA) Expected Pts Added | Dominator Rating | Game Script | Run Blocking Rating |
---|---|---|---|---|---|---|
150 (11.5 p/g) | 1.60 | -5.2 | - | 7.8% | +0.73 | - |
#43 | #16 | #49 | - | #79 | #12 | - |
Average Defenders In The Box Defenders In The Box | Stacked Front Carry Rate Stacked Front Carry % | Base Front Carry Rate Base Front Carry % | Light Front Carry Rate Light Front Carry % | Shotgun Carry Rate Shotgun Carry % | Under Center Carry Rate Under Center Carry % | Stuffed Runs |
---|---|---|---|---|---|---|
6.9 | 23.5% (5.8 ypc) | 43.5% (5.1 ypc) | 32.9% (4.0 ypc) | 60.0% (5.4 ypc) | 40.0% (4.3 ypc) | 18 (21.2% rate) |
#24 | #27 | #51 | #42 | #8 | #53 | #47 |
Week Wk | Opponent Opp | Snap Share Snap Share | Carries Carries | Routes Routes | Targets Targets | Receptions Receptions | Total Yards Total Yards | Total TDs Total TDs | Fantasy Points Fantasy Points |
---|---|---|---|---|---|---|---|---|---|
1 | IND | 13.2% | 2 (1 rz) | 4 | 0 | 0 | 8 | 0 | 0.8 (#70) |
7 | NO | 35.2% | 6 (0 rz) | 8 | 0 | 0 | 9 | 0 | 0.9 (#62) |
8 | JAX | 21.2% | 7 (2 rz) | 3 | 0 | 0 | 7 | 0 | 0.7 (#73) |
11 | ARI | 14.3% | 2 (0 rz) | 5 | 0 | 0 | 19 | 0 | 1.9 (#56) |
13 | SF | 40.3% | 10 (3 rz) | 12 | 1 | 1 | 62 | 0 | 7.2 (#33) |
14 | HOU | 56.9% | 16 (2 rz) | 11 | 1 | 1 | 138 | 2 | 26.8 (#3) |
15 | LAR | 41.5% | 11 (0 rz) | 8 | 2 | 2 | 44 | 0 | 6.4 (#38) |
16 | CHI | 51.9% | 17 (1 rz) | 10 | 1 | 0 | 135 | 1 | 19.5 (#9) |
17 | DET | 66.7% | 25 (6 rz) | 17 | 3 | 2 | 185 | 2 | 32.5 (#1) |
18 | ARI | 77.2% | 23 (3 rz) | 11 | 0 | 0 | 190 | 1 | 25.0 (#4) |
Week Wk | Opponent Opp | Snap Share Snap Share | Carries Carries | Routes Routes | Targets Targets | Receptions Receptions | Total Yards Total Yards | Total TDs Total TDs | Fantasy Points Fantasy Points |
---|---|---|---|---|---|---|---|---|---|
15 | WAS | 9.4% | 2 (0 rz) | 1 | 0 | 0 | 6 | 0 | 0.6 (#81) |
16 | LAR | 4.9% | 3 (0 rz) | 0 | 0 | 0 | 9 | 0 | 0.9 (#75) |
17 | SF | 41.5% | 6 (2 rz) | 9 | 0 | 0 | 19 | 0 | 1.9 (#61) |
Week Wk | Opponent Opp | Snap Share Snap Share | Carries Carries | Routes Routes | Targets Targets | Receptions Receptions | Total Yards Total Yards | Total TDs Total TDs | Fantasy Points Fantasy Points |
---|---|---|---|---|---|---|---|---|---|
1 | CIN | 24.4% | 6 (0 rz) | 3 | 0 | 0 | 18 | 0 | 1.8 (##68) |
2 | PIT | 33.8% | 10 (0 rz) | 8 | 1 | 1 | 65 | 1 | 13.5 (##18) |
5 | LA | 9.1% | 6 (1 rz) | 1 | 2 | 2 | 49 | 0 | 6.9 (##44) |
8 | ATL | 30.2% | 8 (2 rz) | 4 | 0 | 0 | 55 | 0 | 5.5 (##45) |
9 | TB | 12.3% | 4 (0 rz) | 4 | 1 | 0 | 12 | 0 | 1.2 (##64) |
10 | SF | 4.4% | 2 (0 rz) | 1 | 0 | 0 | 2 | 0 | -1.8 (##76) |
12 | PHI | 52.9% | 14 (1 rz) | 6 | 1 | 0 | 129 | 1 | 18.9 (##8) |
13 | MIN | 45.9% | 15 (4 rz) | 11 | 5 | 4 | 107 | 2 | 26.7 (##2) |
14 | LA | 1.8% | 0 (0 rz) | 1 | 1 | 1 | 16 | 0 | 2.6 (##63) |
Week Wk | Opponent Opp | Snap Share Snap Share | Carries Carries | Routes Routes | Targets Targets | Receptions Receptions | Total Yards Total Yards | Total TDs Total TDs | Fantasy Points Fantasy Points |
---|---|---|---|---|---|---|---|---|---|
1 | DEN | 46.9% | 7 (1 rz) | 12 | 5 | 4 | 43 | 0 | 8.3 (##37) |
2 | CHI | 36.2% | 10 (0 rz) | 5 | 2 | 0 | 30 | 0 | 3.0 (##63) |
3 | DAL | 12.3% | 3 (0 rz) | 3 | 0 | 0 | 5 | 0 | 0.5 (##84) |
4 | ARI | 26.7% | 9 (0 rz) | 4 | 0 | 0 | 49 | 0 | 4.9 (##41) |
6 | OAK | 21.7% | 9 (0 rz) | 3 | 2 | 2 | 70 | 0 | 9.0 (##31) |
8 | DET | 0.0% | 0 (0 rz) | 0 | 0 | 0 | 0 | 0 | 0.0 (##76) |
9 | LAC | 18.3% | 4 (0 rz) | 9 | 3 | 3 | 24 | 0 | 5.4 (##44) |
10 | LA | 41.7% | 12 (2 rz) | 5 | 0 | 0 | 108 | 1 | 16.8 (##16) |
11 | GB | 27.3% | 8 (3 rz) | 6 | 0 | 0 | 46 | 0 | 4.6 (##36) |
12 | CAR | 16.9% | 4 (2 rz) | 0 | 0 | 0 | 4 | 0 | 0.4 (##75) |
13 | SF | 19.6% | 7 (1 rz) | 1 | 0 | 0 | 65 | 1 | 12.5 (##24) |
14 | MIN | 21.0% | 8 (0 rz) | 1 | 0 | 0 | 44 | 0 | 4.4 (##53) |
17 | ARI | 9.1% | 4 (0 rz) | 0 | 0 | 0 | 6 | 0 | 0.6 (##85) |
Value Over Stream: Valuation scheme calculates a player’s fantasy pts/game over the average waiver wire replacement in standard fantasy league formats during either the current season (or previous year during the offseason) and adjusts for positional bust rates. VOS rank in parenthesis spans all positions, enabling player comparisons across QB's, RB's, WR's, and TE's.
Seattle Seahawks running back Rashaad Penny was in ...
Seattle Seahawks running back Rashaad Penny (hamstring) is ...
Player Popularity Index (PPI) ranks PlayerProfiler page views over the last 30 days. For example, the No. 1 PPI player page is the most frequently visited page in recent weeks.
Year Year | Games Games | Rush Attempts Rush Atts | Rushing Yards Rush Yrds | Total Touchdowns TDs | Receptions Rec | Receiving Yards Rec Yrds | Target Share Tgt Share | Age Age | School School |
---|---|---|---|---|---|---|---|---|---|
2014 | 10 (RB) | 2 | 22 | 0 | 0 | 0 | - | 18 | San Diego State |
2015 | 14 (RB) | 61 | 368 (4 tds) | 5 | 8 (9 tgts) | 120 | 3.6% | 19 | San Diego State |
2016 | 14 (RB) | 136 | 1,018 (11 tds) | 14 | 15 (19 tgts) | 224 | 7.4% | 20 | San Diego State |
2017 | 13 (RB) | 289 | 2,248 (23 tds) | 25 | 19 (26 tgts) | 135 | 10.3% | 21 | San Diego State |
Monster college production and a blazing 4.46 40-yard dash led the Seahawks to use a first-round pick to draft Rashaad Penny, but his NFL career has been mired with injury, inconsistency, and bad luck. Of a possible 65 games, Penny has only played 37 of them. He could not surpass starter Chris Carson on the depth chart. He tore his ACL in December of 2019 and has constantly been hampered with injuries ever since.
Penny’s luck finally took a turn for the better in the 2021 season. He began the season missing seven of Seattle’s first 11 games with hamstring issues, but got healthy for a dominant stretch at the end of the regular season. Over the last six games of the season, Penny burst back onto the scene with 703 rushing yards and six touchdowns while averaging 6.9 yards per carry. Advanced stats put Penny’s brilliance in bright lights as well. Penny finished 1st among qualified running backs in true yards per carry (5.5) and breakaway run rate (12.6-percent), third in yards per touch (6.4), fourth in yards created per touch (3.83) and seventh in expected points added. His 32 evaded tackles ranked 42nd among running backs despite appearing in only 10 games. Penny's monster finish allowed him to end the season as the RB36 in fantasy football and the RB22 on a per-game basis, far better than his ADP as the RB56.
Rashaad Penny needed that big close to the 2021 season. He may have been a first-round pick, but the Seahawks declined the fifth-year team option from his rookie contract before the 2021 season. Penny will be back with Seattle in 2022 on a 1-year contract extension totalling $5.75 million, including $5 million guaranteed.