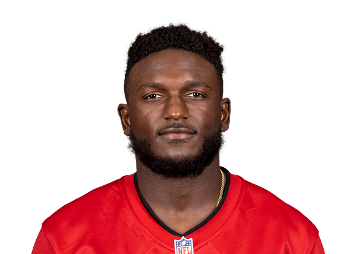
Chris Godwin To See More Work Outside
Tampa Bay Buccaneers wide receiver Chris Godwin, who is now...
Year Year | Games Played Games | Targets Tgts | Receptions Rec | Receiving Yards Rec Yds | Yards Per Reception YPR | Air Yards Air Yds | Receiving TDs Rec TD | Fantasy Points Per Game Fantasy Pts/Game |
---|---|---|---|---|---|---|---|---|
2022 | 15 | 142 | 104 | 1023 | 9.8 | 792 | 3 | 14.9 (#15) |
2021 | 14 | 128 | 98 | 1103 | 11.3 | 898 | 5 | 17.3 (#7) |
2020 | 12 | 84 | 65 | 840 | 12.9 | 866 | 7 | 15.9 (#15) |
2019 | 14 | 119 | 86 | 1333 | 15.5 | 1270 | 9 | 19.6 (#2) |
2018 | 16 | 95 | 59 | 842 | 14.3 | 1172 | 7 | 11.4 (#36) |
2017 | 15 | 55 | 34 | 525 | 15.4 | 708 | 1 | 6.2 (#82) |
Targets | Target Share | Target Rate | Snap Share | Slot Snaps | Routes Run | Route Participation Route % |
---|---|---|---|---|---|---|
142 (9.5 p/g) | 21.8% (15.5% rz) | 25.5% | 81.6% | 489 (57.6% rate) | 557 (37.1 p/g) | 82.5% |
#10 | #31 | #24 | #30 | #4 | #10 | #49 |
Air Yards | Air Yards Share | Average Target Distance (ADOT) Target Depth (ADOT) | Deep Targets | Red Zone Targets Red Zone Tgts | Target Quality Rating | Catchable Target Rate |
---|---|---|---|---|---|---|
792 (52.8 p/g) | 16.8% | 5.6 | 6 (0.4 p/g) | 15 (10 rec) | 5.13 | 85.9% (122 tgts) |
#52 | #71 | #99 | #96 | #18 | #71 | #10 |
Receptions Recs | Receiving Yards Rec Yards | Yards After Catch YAC | Unrealized Air Yards | Total TDs | Fantasy Points Per Game Fantasy Pts/Game | Expected Fantasy Points Per Game Expected Fantasy Pts/Game |
---|---|---|---|---|---|---|
104 (6.9 p/g) | 1023 (68.2 p/g) | 487 (3.4 p/tgt) | 256 (1.8 p/tgt) | 3 (2.8% rate) | 14.9 | 15.6 (-0.78 diff) |
#6 | #20 | #6 | #80 | #50 | #15 | #9 |
Target Accuracy | Yards Per Route Run | Formation Adjusted Yards Per Route Run Formation Adjusted YPRR | Yards Per Target YPT | Yards Per Reception YPR | Yards Per Team Pass Attempt Yards/Team Pass Attempt | True Catch Rate |
---|---|---|---|---|---|---|
7.8 | 1.84 | 1.77 | 7.2 | 9.8 | 1.52 | 85.2% (73.2% actual) |
#17 | #38 | #37 | #71 | #93 | #38 | #42 |
Target Separation | Average Cushion | Target Premium | Dominator Rating | Juke Rate | Drops | Contested Catch Rate Contested Catch % |
---|---|---|---|---|---|---|
1.39 | 4.47 | +1.7% | 18.2% | 4.7% | 3 (2.1% rate) | 55.6% (18 tgts) |
#88 | #82 | #45 | #50 | #13 | #56 | #14 |
Production Premium | Expected Points Added (EPA) EPA | QB Rating Per Target QB Rating Per Target | Best Ball Points Added Best Ball Pts Added | Fantasy Points Per Route Run Fantasy Points Per Route | Fantasy Points Per Target Fantasy Points Per Target | Total Fantasy Points Total Fantasy Pts |
---|---|---|---|---|---|---|
-4.8 | +20.9 | 100.2 | 94.5 (6.3 p/g) | 0.40 | 1.57 | 222.80 |
#71 | #63 | #32 | #20 | #33 | #72 | #19 |
Total Route Wins | Route Win Rate | Routes vs Man | Win Rate vs Man | Target Rate vs Man | Target Separation vs Man Tgt Separation vs Man | Fantasy Points Per Target vs Man Fantasy Pts/Tgt vs Man |
---|---|---|---|---|---|---|
256 | 45.8% | 292 (264 zone) | 42.1% (48.9% zone) | 26.4% (25.4% zone) | 1.30 (1.84 zone) | 1.55 (1.56 zone) |
#5 | #20 | #11 | #15 | #25 | #80 | #72 |
Targets | Target Share | Target Rate | Snap Share | Slot Snaps | Routes Run | Route Participation Route % |
---|---|---|---|---|---|---|
128 (9.1 p/g) | 21.3% (24.3% rz) | 24.1% | 86.2% | 464 (57.5% rate) | 532 (38.0 p/g) | 87.1% |
#17 | #31 | #36 | #13 | #8 | #14 | #29 |
Air Yards | Air Yards Share | Average Target Distance (ADOT) Target Depth (ADOT) | Deep Targets | Red Zone Targets Red Zone Tgts | Target Quality Rating | Catchable Target Rate |
---|---|---|---|---|---|---|
898 (64.1 p/g) | 19.4% | 7.0 | 12 (0.9 p/g) | 26 (20 rec) | 5.44 | 82.8% (106 tgts) |
#41 | #64 | #84 | #51 | #4 | #45 | #11 |
Receptions Recs | Receiving Yards Rec Yards | Yards After Catch YAC | Unrealized Air Yards | Total TDs | Fantasy Points Per Game Fantasy Pts/Game | Expected Fantasy Points Per Game Expected Fantasy Pts/Game |
---|---|---|---|---|---|---|
98 (7.0 p/g) | 1103 (78.8 p/g) | 589 (4.6 p/tgt) | 384 (3.0 p/tgt) | 6 (5.9% rate) | 17.3 | 16.7 (+0.59 diff) |
#10 | #13 | #3 | #47 | #20 | #7 | #11 |
Target Accuracy | Yards Per Route Run | Formation Adjusted Yards Per Route Run Formation Adjusted YPRR | Yards Per Target YPT | Yards Per Reception YPR | Yards Per Team Pass Attempt Yards/Team Pass Attempt | True Catch Rate |
---|---|---|---|---|---|---|
7.9 | 2.07 | 1.99 | 8.6 | 11.3 | 1.81 | 92.5% (76.6% actual) |
#8 | #23 | #19 | #32 | #70 | #18 | #18 |
Target Separation | Average Cushion | Target Premium | Dominator Rating | Juke Rate | Drops | Contested Catch Rate Contested Catch % |
---|---|---|---|---|---|---|
1.63 | 4.09 | +0.6% | 19.4% | 5.1% | 7 (5.5% rate) | 40.0% (25 tgts) |
#47 | #88 | #50 | #44 | #71 | #12 | #38 |
Production Premium | Expected Points Added (EPA) EPA | QB Rating Per Target QB Rating Per Target | Best Ball Points Added Best Ball Pts Added | Fantasy Points Per Route Run Fantasy Points Per Route | Fantasy Points Per Target Fantasy Points Per Target | Total Fantasy Points Total Fantasy Pts |
---|---|---|---|---|---|---|
-2.5 | +58.7 | 114.8 | 120.0 (8.6 p/g) | 0.46 | 1.89 | 242.40 |
#62 | #15 | #23 | #11 | #27 | #31 | #15 |
Total Route Wins | Route Win Rate | Routes vs Man | Win Rate vs Man | Target Rate vs Man | Target Separation vs Man Tgt Separation vs Man | Fantasy Points Per Target vs Man Fantasy Pts/Tgt vs Man |
---|---|---|---|---|---|---|
194 | 36.5% | 331 (195 zone) | 28.7% (47.2% zone) | 22.7% (23.6% zone) | 1.60 (2.40 zone) | 1.97 (1.75 zone) |
#22 | #69 | #7 | #77 | #43 | #45 | #31 |
Targets | Target Share | Target Rate | Snap Share | Slot Snaps | Routes Run | Route Participation Route % |
---|---|---|---|---|---|---|
84 (7.0 p/g) | 18.9% (13.0% rz) | 19.4% | 84.5% | 357 (55.8% rate) | 433 (36.1 p/g) | 93.3% |
#47 | #46 | #57 | #20 | #17 | #47 | - |
Air Yards | Air Yards Share | Average Target Distance (ADOT) Target Depth (ADOT) | Deep Targets | Red Zone Targets Red Zone Tgts | Target Quality Rating | Catchable Target Rate |
---|---|---|---|---|---|---|
866 (72.2 p/g) | 20.6% | 10.3 | 14 (1.2 p/g) | 9 (8 rec) | 7.18 | 89.3% (75 tgts) |
#48 | #62 | #53 | #43 | #54 | #3 | #3 |
Receptions Recs | Receiving Yards Rec Yards | Yards After Catch YAC | Unrealized Air Yards | Total TDs | Fantasy Points Per Game Fantasy Pts/Game | Expected Fantasy Points Per Game Expected Fantasy Pts/Game |
---|---|---|---|---|---|---|
65 (5.4 p/g) | 840 (70.0 p/g) | 263 (3.1 p/tgt) | 289 (3.4 p/tgt) | 7 (10.8% rate) | 15.9 | 13.1 (+2.84 diff) |
#32 | #34 | #41 | #73 | #18 | #15 | #29 |
Target Accuracy | Yards Per Route Run | Formation Adjusted Yards Per Route Run Formation Adjusted YPRR | Yards Per Target YPT | Yards Per Reception YPR | Yards Per Team Pass Attempt Yards/Team Pass Attempt | True Catch Rate |
---|---|---|---|---|---|---|
263.0 | 1.94 | 1.77 | 10.0 | 12.9 | 1.34 | 86.7% (77.4% actual) |
#41 | #29 | #30 | #13 | #48 | #46 | #49 |
Target Separation | Average Cushion | Target Premium | Dominator Rating | Juke Rate | Drops | Contested Catch Rate Contested Catch % |
---|---|---|---|---|---|---|
1.63 | 4.07 | +14.5% | 22.1% | - | 4 (4.8% rate) | 70.0% (10 tgts) |
#57 | #21 | #45 | #46 | - | #38 | #10 |
Production Premium | Expected Points Added (EPA) EPA | QB Rating Per Target QB Rating Per Target | Best Ball Points Added Best Ball Pts Added | Fantasy Points Per Route Run Fantasy Points Per Route | Fantasy Points Per Target Fantasy Points Per Target | Total Fantasy Points Total Fantasy Pts |
---|---|---|---|---|---|---|
+6.7 | +64.1 | 131.1 | 85.4 (7.1 p/g) | 0.44 | 2.27 | 191.00 |
#43 | #11 | #5 | #23 | #26 | #9 | #31 |
Targets | Target Share | Target Rate | Snap Share | Slot Snaps | Routes Run | Route Participation Route % |
---|---|---|---|---|---|---|
119 (8.5 p/g) | 22.2% (20.0% rz) | 23.3% | 95.7% | 447 (50.5% rate) | 511 (36.5 p/g) | 91.6% |
#17 | #24 | #51 | #9 | #12 | #10 | #4 |
Air Yards | Air Yards Share | Average Target Distance (ADOT) Target Depth (ADOT) | Deep Targets | Red Zone Targets Red Zone Tgts | Target Quality Rating | Catchable Target Rate |
---|---|---|---|---|---|---|
1270 (90.7 p/g) | 22.2% | 10.7 | 22 (1.6 p/g) | 13 (9 rec) | 5.98 | 79.0% (94 tgts) |
#29 | #58 | #61 | #23 | #25 | #45 | #42 |
Receptions Recs | Receiving Yards Rec Yards | Yards After Catch YAC | Unrealized Air Yards | Total TDs | Fantasy Points Per Game Fantasy Pts/Game | Expected Fantasy Points Per Game Expected Fantasy Pts/Game |
---|---|---|---|---|---|---|
86 (6.1 p/g) | 1333 (95.2 p/g) | 574 (4.8 p/tgt) | 511 (4.3 p/tgt) | 9 (10.3% rate) | 19.6 | - |
#11 | #3 | #1 | #45 | #3 | #2 | - |
Target Accuracy | Yards Per Route Run | Formation Adjusted Yards Per Route Run Formation Adjusted YPRR | Yards Per Target YPT | Yards Per Reception YPR | Yards Per Team Pass Attempt Yards/Team Pass Attempt | True Catch Rate |
---|---|---|---|---|---|---|
7.2 | 2.61 | - | 11.2 | 15.5 | 2.39 | 91.5% (72.3% actual) |
#35 | #9 | - | #4 | #16 | #3 | #5 |
Target Separation | Average Cushion | Target Premium | Dominator Rating | Juke Rate | Drops | Contested Catch Rate Contested Catch % |
---|---|---|---|---|---|---|
1.48 | 4.10 | +32.7% | 29.5% | - | 3 (2.5% rate) | 64.0% (25 tgts) |
#57 | #48 | #8 | #15 | - | #61 | #4 |
Production Premium | Expected Points Added (EPA) EPA | QB Rating Per Target QB Rating Per Target | Best Ball Points Added Best Ball Pts Added | Fantasy Points Per Route Run Fantasy Points Per Route | Fantasy Points Per Target Fantasy Points Per Target | Total Fantasy Points Total Fantasy Pts |
---|---|---|---|---|---|---|
+34.9 | +112.0 | 116.7 | 150.9 (10.8 p/g) | 0.54 | 2.30 | 274.10 |
#3 | #2 | #9 | #2 | #15 | #6 | #2 |
Targets | Target Share | Target Rate | Snap Share | Slot Snaps | Routes Run | Route Participation Route % |
---|---|---|---|---|---|---|
95 (5.9 p/g) | 15.3% (18.6% rz) | 24.5% | 67.7% | 166 (24.2% rate) | 388 (24.3 p/g) | 62.1% |
#32 | #66 | #38 | #81 | #49 | #43 | #81 |
Air Yards | Air Yards Share | Average Target Distance (ADOT) Target Depth (ADOT) | Deep Targets | Red Zone Targets Red Zone Tgts | Target Quality Rating | Catchable Target Rate |
---|---|---|---|---|---|---|
1172 (73.2 p/g) | 17.3% | 12.3 | - | 16 (6 rec) | 5.49 | 72.6% (69 tgts) |
#28 | #74 | #42 | - | #16 | #65 | #75 |
Receptions Recs | Receiving Yards Rec Yards | Yards After Catch YAC | Unrealized Air Yards | Total TDs | Fantasy Points Per Game Fantasy Pts/Game | Expected Fantasy Points Per Game Expected Fantasy Pts/Game |
---|---|---|---|---|---|---|
59 (3.7 p/g) | 842 (52.6 p/g) | 214 (2.3 p/tgt) | 544 (5.7 p/tgt) | 7 | 11.4 | - |
#37 | #26 | #47 | #37 | #13 | #36 | - |
Target Accuracy | Yards Per Route Run | Formation Adjusted Yards Per Route Run Formation Adjusted YPRR | Yards Per Target YPT | Yards Per Reception YPR | Yards Per Team Pass Attempt Yards/Team Pass Attempt | True Catch Rate |
---|---|---|---|---|---|---|
6.8 | 2.17 | - | 8.9 | 14.3 | 1.35 | 85.5% (62.1% actual) |
#68 | #29 | - | #31 | #32 | #48 | #35 |
Target Separation | Average Cushion | Target Premium | Dominator Rating | Juke Rate | Drops | Contested Catch Rate Contested Catch % |
---|---|---|---|---|---|---|
1.40 | 4.24 | -3.2% | 17.6% | - | 2 (2.1% rate) | 47.8% (23 tgts) |
#60 | #42 | #60 | #60 | - | #80 | #48 |
Production Premium | Expected Points Added (EPA) EPA | QB Rating Per Target QB Rating Per Target | Best Ball Points Added Best Ball Pts Added | Fantasy Points Per Route Run Fantasy Points Per Route | Fantasy Points Per Target Fantasy Points Per Target | Total Fantasy Points Total Fantasy Pts |
---|---|---|---|---|---|---|
+9.3 | - | 110.9 | 56.8 (3.6 p/g) | 0.47 | 1.93 | 183.20 |
#26 | - | #23 | #57 | #35 | #39 | #28 |
Targets | Target Share | Target Rate | Snap Share | Slot Snaps | Routes Run | Route Participation Route % |
---|---|---|---|---|---|---|
55 (3.7 p/g) | 9.9% (12.1% rz) | 23.9% | 44.7% | 38 (9.1% rate) | 230 (15.3 p/g) | 40.6% |
#81 | #99 | #25 | #125 | #110 | #99 | #107 |
Air Yards | Air Yards Share | Average Target Distance (ADOT) Target Depth (ADOT) | Deep Targets | Red Zone Targets Red Zone Tgts | Target Quality Rating | Catchable Target Rate |
---|---|---|---|---|---|---|
708 (47.2 p/g) | 11.1% | 12.9 | - | 8 (3 rec) | - | 67.3% (37 tgts) |
#69 | #105 | #43 | - | #52 | - | #85 |
Receptions Recs | Receiving Yards Rec Yards | Yards After Catch YAC | Unrealized Air Yards | Total TDs | Fantasy Points Per Game Fantasy Pts/Game | Expected Fantasy Points Per Game Expected Fantasy Pts/Game |
---|---|---|---|---|---|---|
34 (2.3 p/g) | 525 (35.0 p/g) | 175 (3.2 p/tgt) | 358 (6.5 p/tgt) | 1 (0.0% rate) | 6.2 | - |
#71 | #61 | #53 | #66 | #96 | #82 | - |
Target Accuracy | Yards Per Route Run | Formation Adjusted Yards Per Route Run Formation Adjusted YPRR | Yards Per Target YPT | Yards Per Reception YPR | Yards Per Team Pass Attempt Yards/Team Pass Attempt | True Catch Rate |
---|---|---|---|---|---|---|
- | 2.28 | - | 9.5 | 15.4 | 0.93 | 91.9% (61.8% actual) |
- | #10 | - | #9 | #17 | #79 | #4 |
Target Separation | Average Cushion | Target Premium | Dominator Rating | Juke Rate | Drops | Contested Catch Rate Contested Catch % |
---|---|---|---|---|---|---|
1.36 | 4.61 | -11.2% | 8.3% | - | 2 (3.6% rate) | 61.5% (13 tgts) |
#66 | #4 | #81 | #120 | - | #95 | #22 |
Production Premium | Expected Points Added (EPA) EPA | QB Rating Per Target QB Rating Per Target | Best Ball Points Added Best Ball Pts Added | Fantasy Points Per Route Run Fantasy Points Per Route | Fantasy Points Per Target Fantasy Points Per Target | Total Fantasy Points Total Fantasy Pts |
---|---|---|---|---|---|---|
+4.0 | - | 91.8 | 24.9 (1.7 p/g) | 0.40 | 1.68 | 92.50 |
#43 | - | #44 | #123 | #25 | #42 | #73 |
Week Wk | Opponent Opp | Primary Corner Primary Corner | Snap Share Snap Share | Routes Routes | Targets Targets | Receptions Receptions | Receiving Yards Receiving Yards | Fantasy Points Fantasy Points |
---|---|---|---|---|---|---|---|---|
1 | DAL | Trevon Diggs | 33.9% | 10 (34.5% rate) | 3 (1 rz) | 3 | 35 | 6.5 (#66) |
4 | KC | L'Jarius Sneed | 83.1% | 41 (77.4% rate) | 10 (1 rz) | 7 | 59 (55 air) | 12.9 (#28) |
5 | ATL | - | 53.9% | 28 (53.9% rate) | 6 (1 rz) | 6 | 61 (38 air) | 12.3 (#29) |
6 | PIT | Arthur Maulet | 88.6% | 36 (85.7% rate) | 12 (1 rz) | 6 | 95 (135 air) | 15.5 (#21) |
7 | CAR | Myles Hartsfield | 93.9% | 41 (82.0% rate) | 13 (1 rz) | 7 | 43 (72 air) | 11.5 (#30) |
8 | BAL | Marlon Humphrey | 88.9% | 38 (80.9% rate) | 11 (2 rz) | 6 | 75 (5 air) | 13.5 (#26) |
9 | LAR | Troy Hill | 88.6% | 53 (89.8% rate) | 10 | 7 | 36 (29 air) | 10.7 (#25) |
10 | SEA | Coby Bryant | 89.2% | 27 (90.0% rate) | 8 (1 rz) | 6 (1 tds) | 71 (65 air) | 19.1 (#13) |
12 | CLE | Thomas Graham | 95.5% | 43 (93.5% rate) | 13 (1 rz) | 12 (1 tds) | 110 (86 air) | 29.0 (#2) |
13 | NO | Bradley Roby | 88.0% | 47 (85.5% rate) | 13 (3 rz) | 8 | 63 (58 air) | 14.3 (#26) |
14 | SF | Jimmie Ward | 94.5% | 50 (90.9% rate) | 9 (1 rz) | 5 | 54 (66 air) | 10.4 (#37) |
15 | CIN | Daxton Hill | 90.0% | 42 (93.3% rate) | 8 (2 rz) | 8 (1 tds) | 83 (55 air) | 22.3 (#7) |
16 | ARI | Isaiah Simmons | 91.0% | 43 (89.6% rate) | 10 | 8 | 63 (37 air) | 14.3 (#24) |
17 | CAR | Jeremy Chinn | 85.3% | 44 (91.7% rate) | 9 | 9 | 120 (51 air) | 21.0 (#6) |
18 | ATL | Isaiah Oliver | 48.1% | 14 (41.2% rate) | 7 | 6 | 55 (40 air) | 9.5 (#42) |
19 | DAL | DaRon Bland | 88.0% | 57 (83.8% rate) | 13 (1 rz) | 10 | 85 (50 air) | 18.5 (#9) |
Week Wk | Opponent Opp | Primary Corner Primary Corner | Snap Share Snap Share | Routes Routes | Targets Targets | Receptions Receptions | Receiving Yards Receiving Yards | Fantasy Points Fantasy Points |
---|---|---|---|---|---|---|---|---|
1 | DAL | Jourdan Lewis | 95.3% | 48 | 14 (4 rz) | 9 (1 tds) | 105 (101 air) | 23.5 (#12) |
2 | ATL | Isaiah Oliver | 88.1% | 34 | 5 (1 rz) | 4 (1 tds) | 62 (53 air) | 16.2 (#25) |
3 | LAR | Jalen Ramsey | 94.4% | 54 | 7 | 6 | 74 (35 air) | 19.6 (#13) |
4 | NE | Jalen Mills | 94.6% | 36 | 5 (1 rz) | 3 | 55 (79 air) | 8.5 (#58) |
5 | MIA | Nik Needham | 75.0% | 34 | 11 (4 rz) | 7 | 70 (100 air) | 14.0 (#30) |
6 | PHI | Avonte Maddox | 91.8% | 39 | 5 (3 rz) | 5 | 43 (24 air) | 9.3 (#47) |
7 | CHI | Duke Shelley | 84.3% | 32 | 11 (2 rz) | 8 (1 tds) | 111 (114 air) | 25.1 (#6) |
8 | NO | Chauncey Gardner-Johnson | 98.3% | 43 | 12 (1 rz) | 8 (1 tds) | 140 (38 air) | 28.0 (#3) |
10 | WAS | William Jackson | 95.7% | 31 | 8 (2 rz) | 7 | 57 (32 air) | 12.7 (#28) |
11 | NYG | Darnay Holmes | 81.1% | 36 | 6 (1 rz) | 6 (1 tds) | 65 (29 air) | 19.2 (#16) |
12 | IND | Kenny Moore | 96.8% | 35 | 5 (1 rz) | 4 | 24 (25 air) | 4.7 (#66) |
13 | ATL | Darren Hall | 92.6% | 45 | 17 (3 rz) | 15 | 143 (93 air) | 30.2 (#3) |
14 | BUF | Taron Johnson | 94.9% | 49 | 15 (3 rz) | 10 | 105 (123 air) | 20.5 (#9) |
15 | NO | Chauncey Gardner-Johnson | 27.9% | 16 | 7 | 6 | 49 (52 air) | 10.9 (#28) |
Week Wk | Opponent Opp | Primary Corner Primary Corner | Snap Share Snap Share | Routes Routes | Targets Targets | Receptions Receptions | Receiving Yards Receiving Yards | Fantasy Points Fantasy Points |
---|---|---|---|---|---|---|---|---|
1 | NO | Chauncey Gardner-Johnson | 87.9% | 39 | 7 (1 rz) | 6 | 79 (68 air) | 13.9 (#28) |
3 | DEN | Essang Bassey | 84.4% | 37 | 6 (2 rz) | 5 (1 tds) | 64 (41 air) | 17.4 (#24) |
6 | GB | Chandon Sullivan | 60.9% | 20 | 7 (1 rz) | 5 | 48 (34 air) | 9.8 (#40) |
7 | LV | Lamarcus Joyner | 84.3% | 40 | 9 (1 rz) | 9 (1 tds) | 88 (61 air) | 23.8 (#8) |
9 | NO | Chauncey Gardner-Johnson | 93.5% | 40 | 6 | 3 | 41 (90 air) | 7.1 (#67) |
10 | CAR | Corn Elder | 88.5% | 38 | 6 | 6 | 92 (45 air) | 15.2 (#22) |
11 | LAR | Troy Hill | 98.5% | 48 | 10 (1 rz) | 7 (1 tds) | 53 (80 air) | 18.3 (#14) |
12 | KC | Rashad Fenton | 89.1% | 38 | 9 | 8 | 97 (84 air) | 17.7 (#17) |
14 | MIN | Jeff Gladney | 83.7% | 19 | 3 | 2 | 25 (40 air) | 4.5 (#82) |
15 | ATL | Isaiah Oliver | 90.9% | 45 | 5 (1 rz) | 4 (1 tds) | 36 (39 air) | 13.6 (#28) |
16 | DET | Justin Coleman | 70.6% | 31 | 9 (1 rz) | 5 (1 tds) | 84 (145 air) | 19.4 (#16) |
17 | ATL | - | 84.4% | 38 | 7 (1 rz) | 5 (2 tds) | 133 (139 air) | 30.3 (#8) |
Week Wk | Opponent Opp | Primary Corner Primary Corner | Snap Share Snap Share | Routes Routes | Targets Targets | Receptions Receptions | Receiving Yards Receiving Yards | Fantasy Points Fantasy Points |
---|---|---|---|---|---|---|---|---|
1 | SF | Richard Sherman | 91.9% | 32 | 6 (2 rz) | 3 (1 tds) | 53 | 14.3 (##31) |
2 | CAR | Donte Jackson | 98.2% | 21 | 9 (1 rz) | 8 (1 tds) | 121 | 26.1 (##5) |
3 | NYG | Grant Haley | 100.0% | 36 | 4 | 3 | 40 | 7.0 (##64) |
4 | LA | Nickell Robey-Coleman | 93.0% | 37 | 14 (2 rz) | 12 (2 tds) | 172 | 41.2 (##1) |
5 | NO | P.J. Williams | 100.0% | 25 | 9 (1 rz) | 7 (2 tds) | 125 | 31.5 (##6) |
6 | CAR | Javien Elliott | 100.0% | 51 | 12 (1 rz) | 10 | 151 | 25.1 (##3) |
8 | TEN | Logan Ryan | 100.0% | 44 | 8 (1 rz) | 4 | 43 | 8.3 (##52) |
9 | SEA | Shaquill Griffin | 95.7% | 41 | 9 | 7 | 61 | 13.9 (##25) |
10 | ARI | Byron Murphy | 98.6% | 43 | 12 (2 rz) | 6 | 74 | 13.4 (##25) |
11 | NO | Chauncey Gardner-Johnson | 100.0% | 49 | 6 (1 rz) | 3 (1 tds) | 47 | 13.7 (##20) |
12 | ATL | Desmond Trufant | 87.1% | 27 | 8 (2 rz) | 7 (2 tds) | 184 | 37.4 (##1) |
13 | JAC | Tre Herndon | 98.4% | 32 | 6 | 4 | 50 | 9.0 (##50) |
14 | IND | Rolan Milligan | 92.2% | 43 | 9 | 7 | 91 | 16.1 (##22) |
15 | DET | Justin Coleman | 64.8% | 30 | 7 | 5 | 121 | 17.1 (##21) |
Week Wk | Opponent Opp | Primary Corner Primary Corner | Snap Share Snap Share | Routes Routes | Targets Targets | Receptions Receptions | Receiving Yards Receiving Yards | Fantasy Points Fantasy Points |
---|---|---|---|---|---|---|---|---|
1 | NO | Ken Crawley | 71.0% | 20 | 4 (1 rz) | 3 (1 tds) | 41 | 13.1 (##39) |
2 | PHI | Jalen Mills | 60.7% | 18 | 6 (1 rz) | 5 (1 tds) | 56 | 16.6 (##31) |
3 | PIT | Coty Sensabaugh | 51.5% | 24 | 10 (4 rz) | 5 (1 tds) | 74 | 17.4 (##20) |
4 | CHI | Kyle Fuller | 55.4% | 20 | 2 | 2 | 22 | 4.2 (##89) |
6 | ATL | Desmond Trufant | 59.0% | 24 | 9 (2 rz) | 6 (1 tds) | 56 | 17.6 (##18) |
7 | CLE | Denzel Ward | 71.4% | 36 | 6 | 5 | 59 | 10.9 (##38) |
8 | CIN | William Jackson | 72.7% | 28 | 7 (1 rz) | 2 | 32 | 5.2 (##70) |
9 | CAR | Donte Jackson | 56.5% | 23 | 3 (1 rz) | 2 | 40 | 6.0 (##55) |
10 | WAS | Josh Norman | 49.2% | 17 | 7 | 7 | 103 | 17.3 (##18) |
11 | NYG | Janoris Jenkins | 31.3% | 10 | 3 | 3 | 50 | 8.0 (##46) |
12 | SF | Richard Sherman | 69.6% | 23 | 4 | 4 | 42 | 8.2 (##49) |
13 | CAR | Donte Jackson | 89.1% | 28 | 6 (2 rz) | 5 (1 tds) | 101 | 21.1 (##8) |
14 | NO | Eli Apple | 91.8% | 34 | 10 (1 rz) | 1 | 13 | 2.3 (##93) |
15 | BAL | Marlon Humphrey | 91.3% | 23 | 3 (1 rz) | 0 | 0 | 0.0 (##116) |
16 | DAL | Chidobe Awuzie | 81.9% | 33 | 6 (1 rz) | 3 | 39 | 6.9 (##64) |
17 | ATL | Robert Alford | 89.1% | 27 | 9 (1 rz) | 6 (2 tds) | 114 | 29.4 (##1) |
Week Wk | Opponent Opp | Primary Corner Primary Corner | Snap Share Snap Share | Routes Routes | Targets Targets | Receptions Receptions | Receiving Yards Receiving Yards | Fantasy Points Fantasy Points |
---|---|---|---|---|---|---|---|---|
2 | CHI | - | 36.9% | 9 | 2 (1 rz) | 0 | 0 | 0.0 (##118) |
3 | MIN | - | 20.4% | 9 | 3 | 3 | 44 | 7.4 (##64) |
5 | NE | - | 21.2% | 9 | 2 (1 rz) | 1 | 8 | 1.8 (##89) |
6 | ARI | - | 19.0% | 7 | 1 | 1 | 9 | 1.9 (##88) |
7 | BUF | - | 34.8% | 12 | 1 (1 rz) | 1 | 5 | 1.5 (##104) |
8 | CAR | - | 23.3% | 8 | 2 | 1 | 8 | 1.8 (##76) |
9 | NO | - | 26.4% | 2 | 1 | 1 | 9 | 1.9 (##88) |
10 | NYJ | - | 100.0% | 34 | 10 | 5 | 68 | 11.8 (##34) |
11 | MIA | - | 31.1% | 7 | 2 | 2 | 38 | 5.8 (##63) |
12 | ATL | - | 23.9% | 8 | 2 (1 rz) | 1 | 17 | 2.7 (##92) |
13 | GB | - | 26.9% | 11 | 3 (1 rz) | 2 | 24 | 4.4 (##71) |
14 | DET | - | 65.2% | 19 | 6 | 5 | 68 | 11.8 (##37) |
15 | ATL | - | 66.0% | 22 | 2 | 1 | 18 | 2.8 (##84) |
16 | CAR | - | 94.1% | 29 | 6 (1 rz) | 3 | 98 | 12.8 (##21) |
17 | NO | - | 77.2% | 43 | 12 (2 rz) | 7 (1 tds) | 111 | 24.1 (##6) |
Value Over Stream: Valuation scheme calculates a player’s fantasy pts/game over the average waiver wire replacement in standard fantasy league formats during either the current season (or previous year during the offseason) and adjusts for positional bust rates. VOS rank in parenthesis spans all positions, enabling player comparisons across QB's, RB's, WR's, and TE's.
Tampa Bay Buccaneers wide receiver Chris Godwin, who is now...
Tampa Bay Buccaneers wide receiver Chris Godwin caught 10 ...
The Tampa Bay Buccaneers are heading to the playoffs, but ...
Player Popularity Index (PPI) ranks PlayerProfiler page views over the last 30 days. For example, the No. 1 PPI player page is the most frequently visited page in recent weeks.
Year Year | Games Games | Receptions Recs | Receiving Yards Rec Yds | Target Share Tgt Share | Catch Rate Catch Rate | Receiving Touchdowns Rec TDs | Special Teams Yards Special Teams | Age Age | School School |
---|---|---|---|---|---|---|---|---|---|
2014 | 13 (WR) | 26 (41 tgts) | 338 (13.0 ypr) | 8.3% | 63.4% | 2 | 0 | 18 | Penn State |
2015 | 13 (WR) | 69 (118 tgts) | 1,101 (16.0 ypr) | 29.2% | 58.5% | 5 | 0 | 19 | Penn State |
2016 | 13 (WR) | 59 (99 tgts) | 982 (16.6 ypr) | 25.3% | 59.6% | 11 | 0 | 20 | Penn State |
Chris Godwin capped an otherwise-quiet freshman season with 7 catches for 140 yards and a score in their bowl win over Boston College. In year two, he posted 1,101 yards receiving, again saving his best for last with six grabs for 133 yards in their bowl game against Georgia. In his third and final season in Happy Valley in 2016, while Godwin’s college stats were modest, he once again was their top receiver. On brand, he ended the season and his college career with a bang - 9 catches for 187 yards and two scores in the Rose Bowl.
Godwin lit up the 2017 Combine, posting a 4.42 40 time and outstanding workout metrics across the board, leading Tampa Bay to select him in 3rd round. The team’s No. 4 WR as a rookie, Godwin saw just 44.7-percent of the snaps (No. 125) but, as always, he finished strong, posting 10 catches on 18 targets for 209 yards and a score in the Bucs’ last two games.
In 2018, his target share grew and he became a red zone favorite. As he is wont to do, he finished strong, grabbing six receptions for 114 yards and two scores in the season finale. In 2019, Godwin joined the NFL elite. No longer content to wait for the fantasy season to end, Godwin put up four 100-yard games and six scores in the first six weeks. He’d play a 95.7-percent snap share on the season & lead the league in YAC, earning 19.6 fantasy points per game to finish with the No. 2 WR fantasy ranking.
In an injury-plagued 2020, Godwin’s target share slipped as did his YAC, which fell to No. 41. He still, though, managed to finish No.15 among WRs with 15.9 points per game. Once again, he saved his best for last, with five catches for 133 yards and 2 scores in Week 17.
The Bucs franchise tagged Godwin in 2021. Once again healthy, he returned to his role of YAC monster and red zone target magnet. Seeing just 4.0 air yards per target, he posted more than half his 1,103 yards after the catch, finishing No. 13 in receiving yards and No. 3 in YAC. According to Next Gen Stats, Godwin’s 6.3 yards after catch per reception was top-10 among WRS. Seeing only 12 deep balls from Tom Brady (that role belonging to Mike Evans), Godwin’s snaps remained elite at 86-percent & he saw 128 targets on the season as he finished with a No. 7 WR fantasy ranking with 17.3 points per game.
Chris Godwin's season ended prematurely after suffering a torn ACL in Week 14 of the 2021 season. Though he was in a contract-year, the Bucs eventually took care of their guy. In the 2022 offseason, Godwin and the Bucs agreed to a three-year $60 million contract that guaranteed $40 millon of that pie. With Tom Brady back in the fold, Godwin and his fantasy prospects are going nowhere any time soon.