
The PlayerProfiler website displays over 40 NFL advanced stats and metrics on a player’s page, along with many, many more in PlayerProfiler’s Data Analysis tool. If you aren’t used to working with statistics or data analysis (using both terms broadly in this context), then trying to decipher left from right may be intimidating.
This guide is meant to de-mystify PlayerProfiler’s highlighted metrics and help you understand what drives wide receiver success in fantasy football. The metrics are split into five sections, which I’ll cover individually: Opportunity, Productivity, Efficiency, College Production & Workout Metrics, and Coverage-Specific.
Note: Some terms/concepts may be slightly over-simplified for the purpose of conveying the message. Additionally, not every metric will be highlighted individually, for brevity.
Opportunity Metrics
You may have heard the phrase “Opportunity is king” before. It’s used frequently in the fantasy football community and rightfully so. It may sound painfully obvious, but there’s little else we can rely on with extreme confidence other than the fact that being on the field translates to opportunity, which ultimately generates fantasy points.
Opportunity metrics by themselves are more correlated with fantasy points than efficiency. Also, they have the highest year-to-year correlation. T.J. Hernandez has done a fantastic study on this. In simpler terms, the opportunity a wide receiver receives this year will tell us a lot about what level of opportunity he’s likely to receive the next year.
Target Share
Target volume is unsurprisingly our best predictor of fantasy production. The worst passing offense in the NFL still throws over 350 passes and produces over 2,500 passing yards in a season. Meaning, even receivers in the worst offenses still have plenty of opportunity to be fantasy relevant.
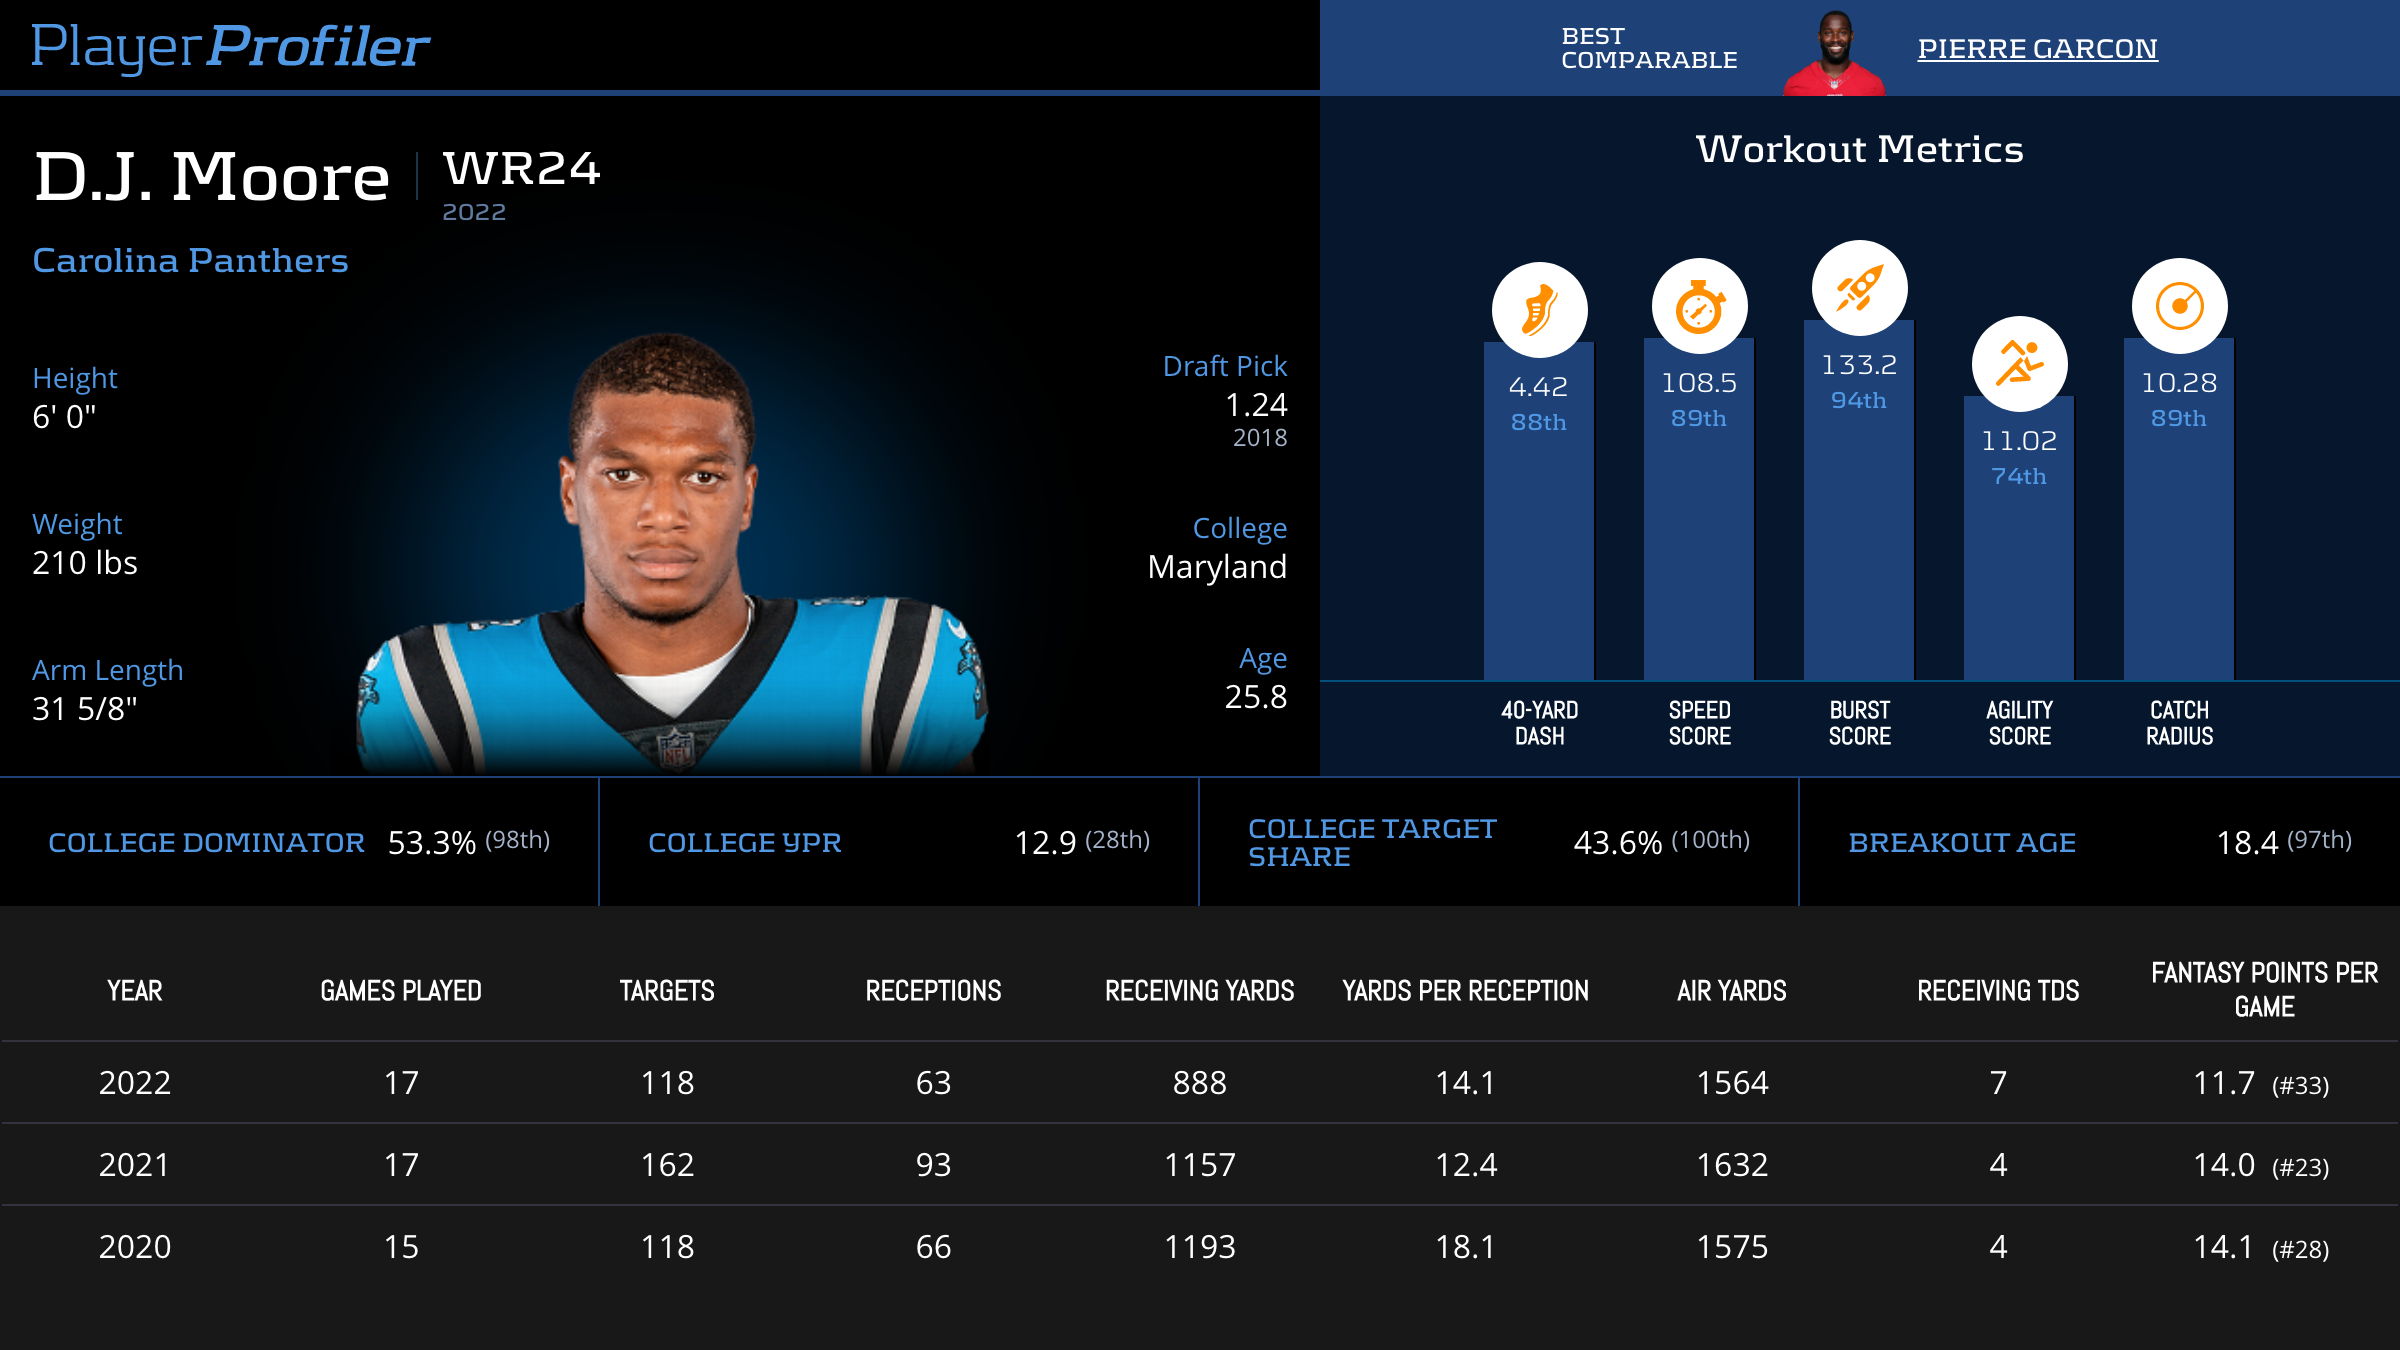
D.J. Moore Advanced Stats & Metrics Profile
Since 2017, WR’s who reach a 20-perent Target Share average 14.7 fantasy points per game, while those who fall between 10-percent and 20-percent average just 8.3 fantasy points per game. Even with a carousel of awful quarterbacks, D.J. Moore‘s four consecutive seasons with a 24-percent Target Share or higher have allowed him to produce at least 14 fantasy points per game in three of the last four seasons.
Air Yards / Air Yards Share
Air Yards are the cumulative distance a player’s targets travel through the air. A player’s Air Yards Share is that player’s percent of the team’s total Air Yards. A large Air Yards Share (at least 30-percent) indicates that a player is commanding a significant portion of the teams passing volume, and is likely leading his team in receiving production.
Since 2017, receivers who earned at least a 30-percent Air Yards Share averaged 14.4 Fantasy Points per Game. Further, nine of the top 12 receivers in Fantasy Points per Game this season cleared the 30-percent threshold.
Average Depth of Target / Deep Targets
A player’s Average Depth of Target (also known as aDOT) is the player’s average air yards per target. This metric is more useful for describing a receiver’s role than predicting fantasy points. This is because there is a point where a higher aDOT begins to decrease one’s fantasy production. Since 2017, receivers finishing with 15 or more fantasy points per game drew an average target depth of 10.87 yards. Of the 97 observations, only eight had an average target depth of over 14 yards.
J-E-T-S JETS JETS JETS! pic.twitter.com/dI55IircF6
— NFL (@NFL) November 6, 2022
Gabriel Davis is the perfect example of the type of role to avoid. Over a quarter of his targets were Deep Targets (targets of 20 or more air yards). These targets are difficult to convert. Deep-threat decoys are great for Best Ball. This is true because they’ll earn their boom-weeks. However, they are less valuable in seasonal leagues where consistent usable-weeks are necessary.
Red Zone Targets / Red Zone Target Share
Earning targets inside of the opposing team’s 20-yard-line, or Red Zone Targets, is vital for a receiver to steadily produce touchdowns. Because of the steep premium, a player’s share of his team’s Red Zone Targets is predictive of fantasy success.
Of the 31 receivers to score 10 or more touchdowns in a season since 2017, the average Red Zone Target Share was 26-percent. Similarly, receivers who earned a minimum 25-percent Red Zone Target Share averaged 14.4 fantasy points per game.
Target Quality Rating
Target Quality Rating provides an aggregate score to represent the “fantasy-friendliness” of a player’s target share. As defined in the terms glossary, this places a premium on catchable deep targets, and discounts uncatchable, short passes. Target Quality Rating is one of the few metrics that is more closely correlated between actual fantasy production, rather than the expectedproduction.
This is due to the fact that Expected Fantasy Points rely on a player’s teammates performing league-average execution. D.J. Moore is an example of someone who’s never received such execution. Despite clearing a 24-perent Target Share and a 30-percent Air Yards Share in four of five seasons, has never seen above a 6.0 Target Quality Rating and thus has cleared 15 Fantasy Points per Game in only one season.
Catchable Target Rate
Catchable Target Rate calculates the percent of targets a receiver earned that were deemed catchable. PlayerProfiler’s Game Analyst team tracks every pass from every game and determines whether each target was catchable. This metric is particularly useful in contextualizing the true opportunity levels of receivers who underperformed.
5️⃣ picks for the #Saints DBs today! 🤚#NOvsCAR | 📺: Fox pic.twitter.com/ab154SgFNL
— New Orleans Saints (@Saints) January 4, 2021
Despite having a healthy opportunity share, D.J. Moore failed to meet fantasy expectations. Much of this can be explained by his 64-percent (No. 90) Catchable Target Rate. His 76 Catchable Targets and 11.7 (No. 33) Fantasy Points per Game were both the second-fewest in his career.
Productivity Metrics
Yards After Catch / Yards After Catch per Target
The amount of yards gained after the catch, and they rate at which they are accumulated, are not as powerful of a predictor of fantasy production as most opportunity metrics. However, they do provide insight into how a receiver is gaining his yards. They also highlight the player’s ability (or lack thereof) to create yards for himself in the open field.
Unrealized Air Yards / Unrealized Air Yards per Target
Unrealized Air Yards are the total amount of Air Yards that are not converted into receiving yards. This metric is especially useful for contextualizing opportunity. The more cumulative Unrealized Air Yards a player has, the more opportunity he is earning. In contrast, those with a high Unrealized Air Yards per Target are generally drawing a low-volume of uncatchable deep targets.
Unrealized Air Yards per Target are negatively correlated with fantasy production, meaning that the more Unrealized Air Yards per Target a player has, the less fantasy points they tend to score. Player’s thrust into this role are fairly likely to find themselves stuck in that role the next season. Marquez Valdes-Scantling, for example, drew over 10 Unrealized Air Yards per Target three straight seasons from 2019 through 2021.
Touchdown Rate
Touchdown Rate is a receiver’s total amount of touchdowns scored per touch. A high Touchdown Rate is not necessarily indicative of more total touchdowns. It is, however, an indicator of unstable touchdown production. Only six of 112 receivers who finish with a minimum 15-percent Touchdown Rate went on to repeat that efficiency the next season.
Let’s take Mecole Hardman‘s 2022 season as an example of this takeaway. Hardman, who played eight games, finished with six touchdowns on a 20.7-percent rate. We expect this efficiency to regress, especially now that he’ll be in a slower-paced Jets offense that will have a fiercer competition to earn high-value touches. Because of this, Hardman is an easy fade in drafts.
Expected Fantasy Points per Game
Expected Fantasy Points per Game takes into account the down, distance, field position, game situation, and play type/direction/depth to calculate the most likely fantasy production if the player were to provide league-average execution on the play. The Expected Points Differential is the difference between the player’s expected and actual fantasy production.
You can use Expected Fantasy Points per Game and the differential to identify over and under-performers. Jahan Dotson was a clear over-achiever, clearing his Expected Fantasy Points per Game by 2.47 points thanks to an 18.9-percent Touchdown Rate. D.K. Metcalf was an under-performer, posting his lowest YAC per Target and Touchdown Rate in his career.
Efficiency Metrics
Yards per Team Pass Attempt
Yards per Team Pass Attempt is one of the strongest predictors of fantasy production since 2017. This metric measures how efficiently a player is producing with respect to their team’s offensive passing volume and can highlight players who’s production was diminished by a sluggish offense.
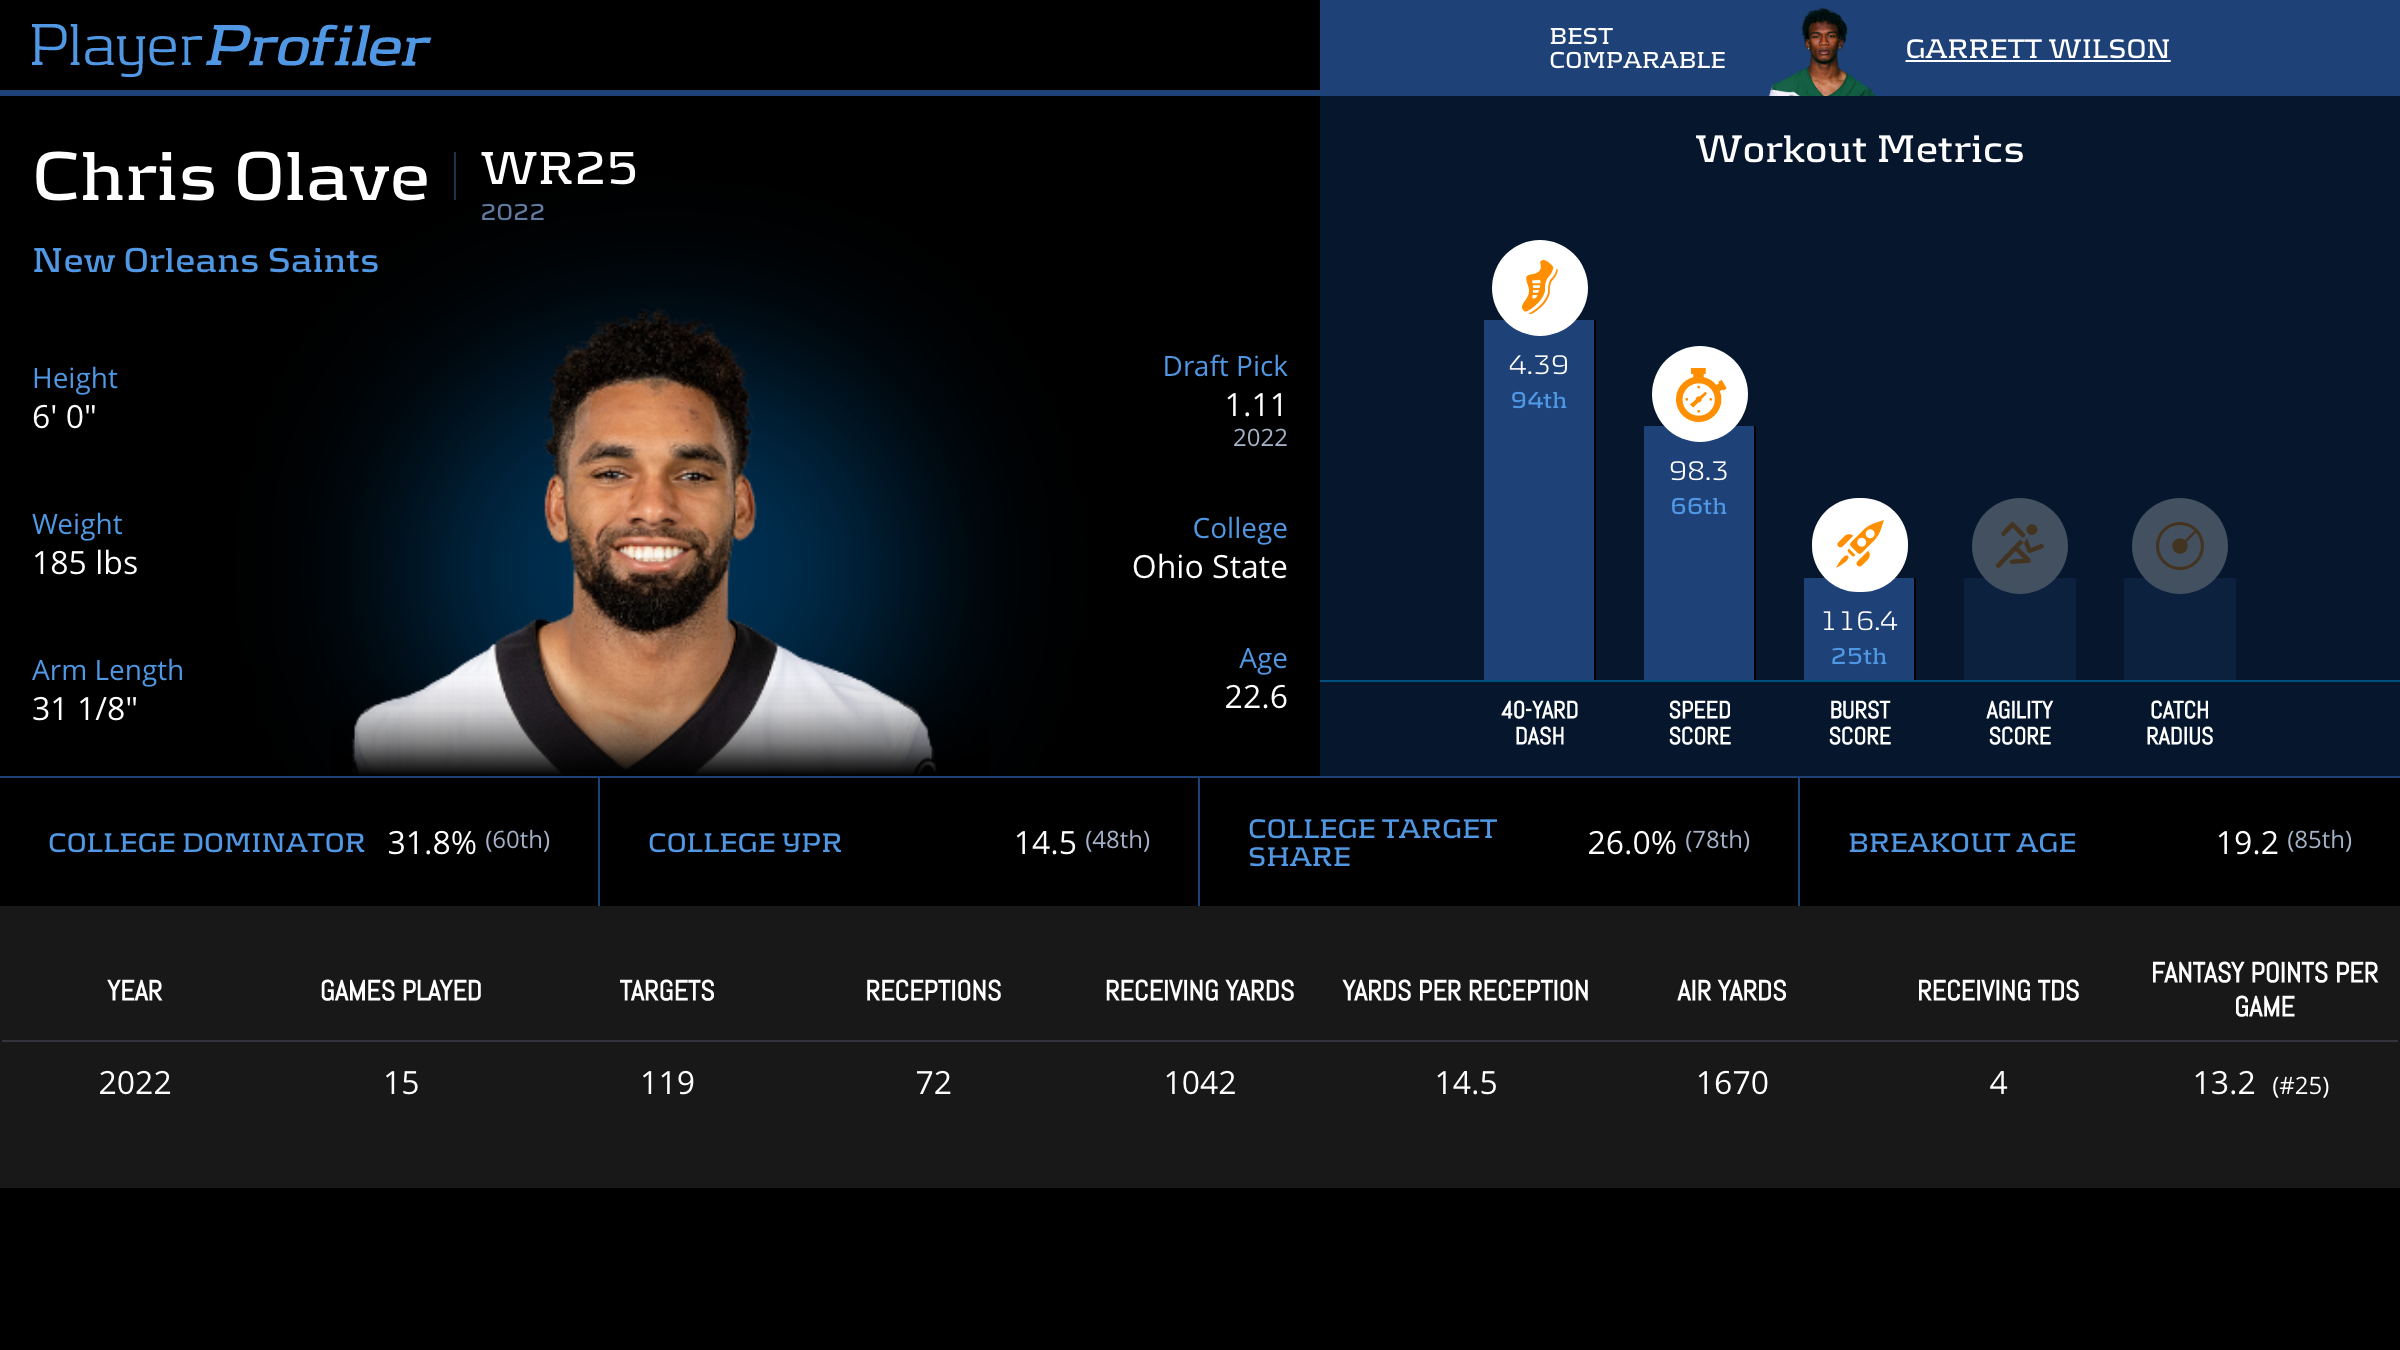
Chris Olave Advanced Stats & Metrics Profile
Chris Olave is one of four rookie receivers since 2017 to surpass 2.25 Yards per Team Pass Attempt, joining Justin Jefferson, Ja’Marr Chase, and A.J. Brown. Similarly to A.J. Brown, an anemic passing offense bottled Olave’s fantasy production. Both players posted acceptable, but overall uninspiring, rookie seasons. Brown went on the next season to explode for 17.7 Fantasy Points per Game the following season. After a historic rookie season, Olave is poised for a breakout sophomore campaign.
Target Accuracy
PlayerProfiler’s Performance Analysts chart grade every throw of every game on a 1-10 scale, with 10 being the most accurate. Targets above a grade of eight are considered highly accurate, and those below seven are considered relatively inaccurate. This metric is not a strong predictor of fantasy performance, but there is some correlation since targets must be caught to score fantasy points.
Despite a solid rookie performance, Garrett Wilson could have gone even bigger. His 6.6 (No. 90) Target Accuracy led to a sub-60-percent Catch Rate and him performing below his expected fantasy production by a whopping 2.31 points per game. Wilson is in line for quarterback upgrades and is a massive value in drafts this offseason.
Yards per Route Run
Yards per Route Run is one of the strongest efficiency metrics for predicting total fantasy points. Exhibiting high per-route efficiencies is generally an indication of a talented receiver. Since 2017, 80 of the 174 receivers with at least 50 targets and two Yards per Route Run finished with over 15 fantasy points per game. Only 13 receivers finished with under 10 fantasy points per game.
In his rookie season, Drake London recorded a 2.40 (No. 11) Yards per Route Run. Despite completely dominating his teams passing volume, he only scored 10.5 (No. 43) fantasy points per game. This was mainly due to a lack of touchdowns and big plays. With both he and quarterback Desmond Ridder gaining valuable experience going into Year 2. This metric, along with many others in his profile, signal London is in for a massive sophomore campaign.
True Catch Rate
True Catch Rate calculates the percent of catchable passes a receiver converts into receptions. This allows us to measure the reliability of the receiver and his ability to make tough grabs. A player can have a True Catch Rate above 100-percent if he has more receptions than he does catchable targets. This metric is not a strong predictor of fantasy production, and is better for contextualizing opportunity.
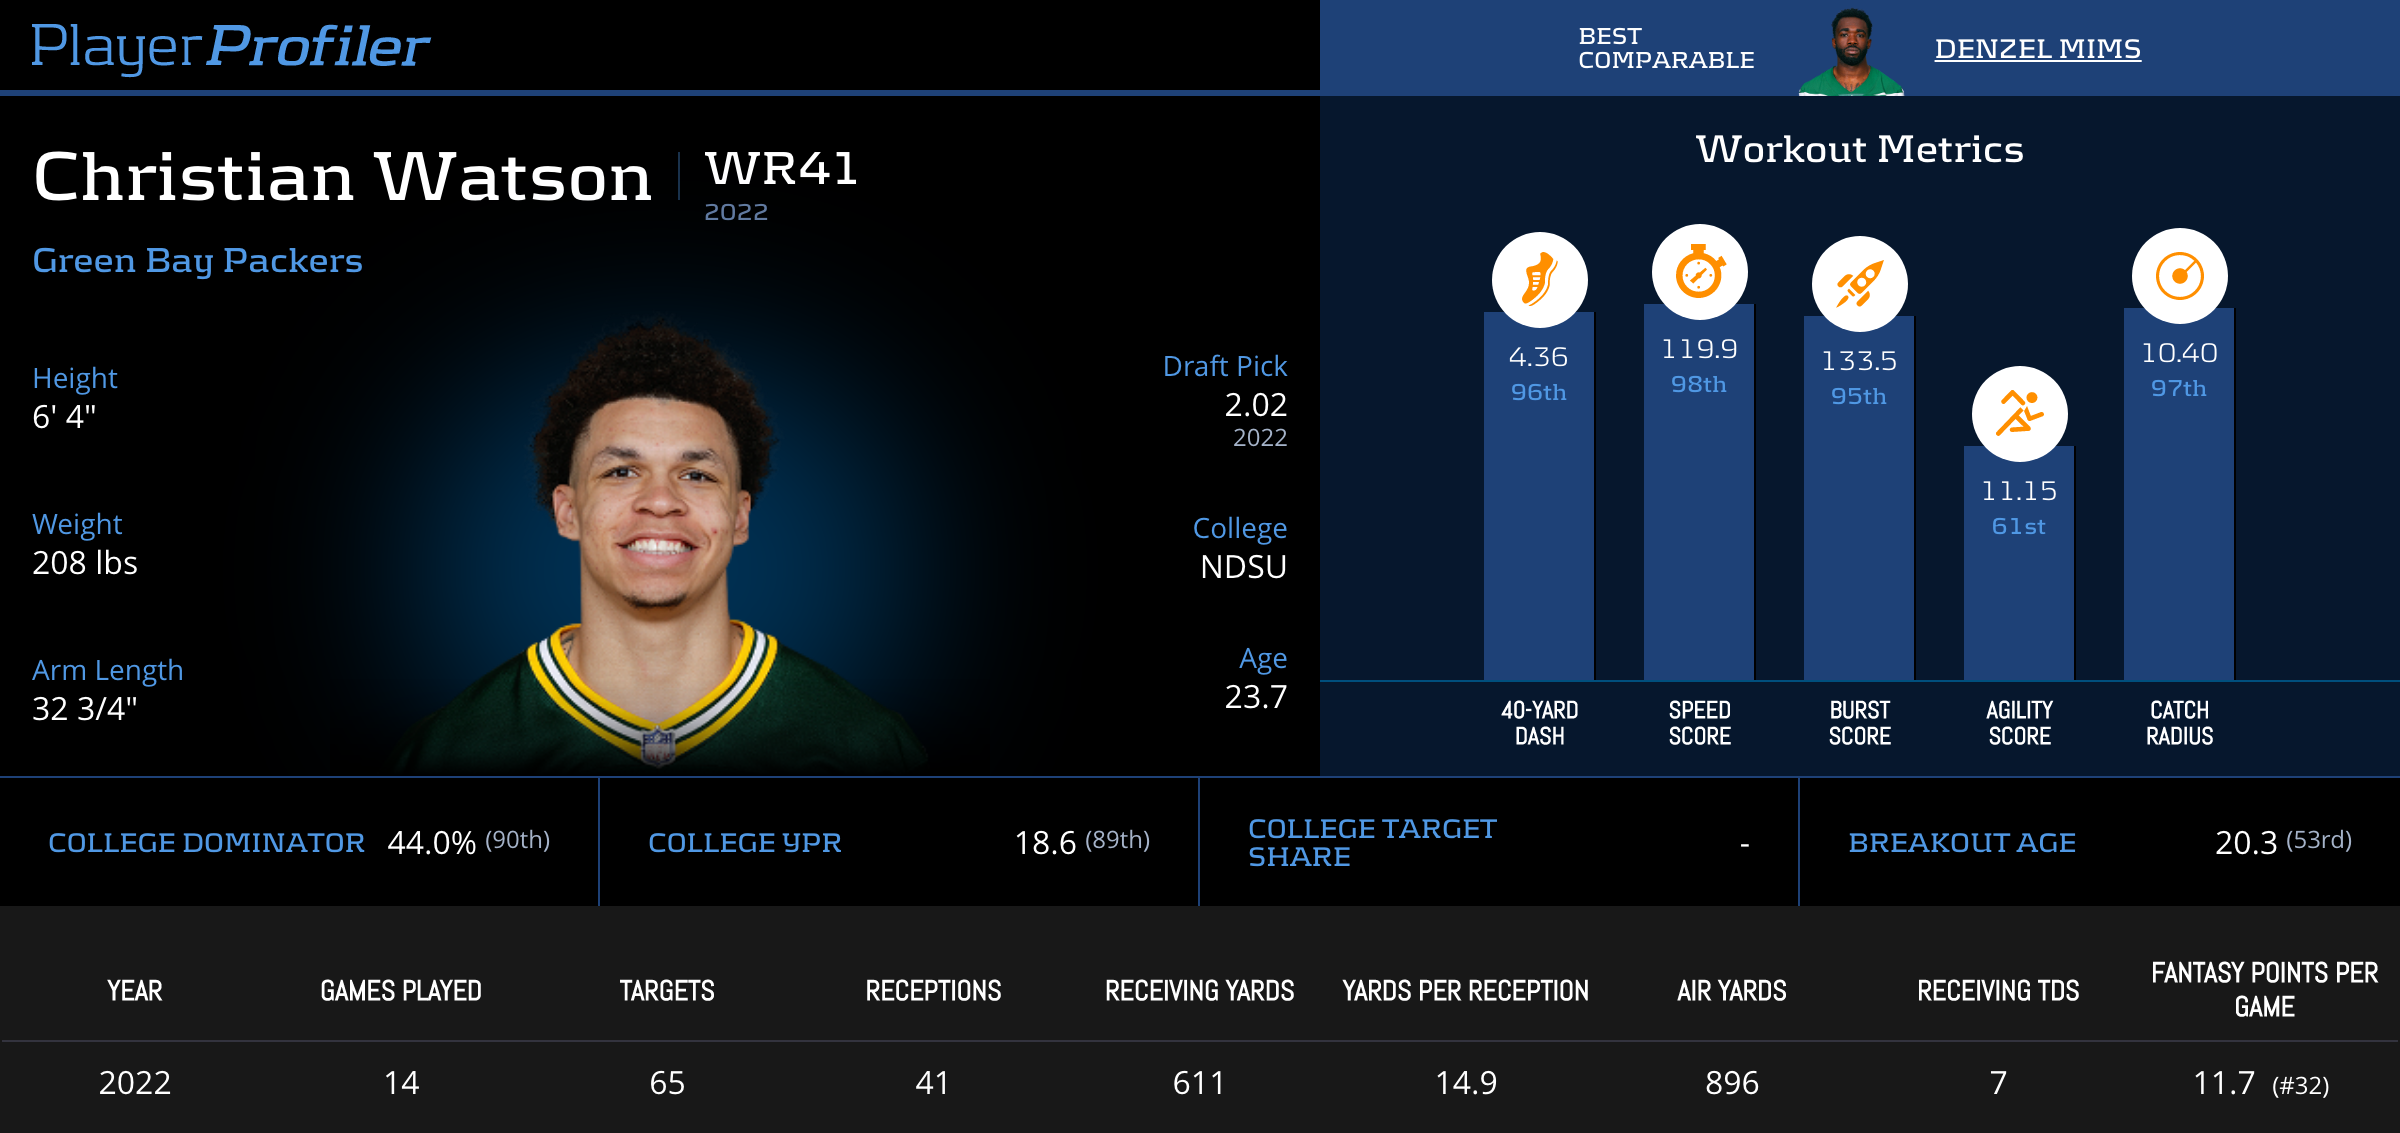
Christian Watson Advanced Stats & Metrics Profile
Despite dropping his first target, Christian Watson posted a 102.5-percent (No. 7) True Catch Rate, making the most of his 4.56 (No. 90) Target Quality Rating. This is one of many symbols that Watson is (virtually) QB-proof. He has the measurables and the college production, and now we’ve seen him make Aaron Rodgers look better by turning inaccurate deep balls into touchdowns. Watson is in for a booming sophomore campaign.
Target Separation
Target Separation is a great metric for identifying quality deep threats as well as pure route winners. In terms of fantasy production, Target Separation really does not matter. Big-bodied pass catchers (Mike Evans) and smaller, slot receivers (Tyler Boyd) alike have produced highly successful seasons without being known as pure separators.
Brandon Aiyuk is a good example of Target Separation put to good use. After a concerning sophomore slump, he vastly improved as a route runner, increasing his Route Win Rate and generating an average 2.31 (No. 3) yards of separation at the arrival of the pass. Having Trey Lance at quarterback will, naturally, increase the number of pass attempts in San Francisco next season. With Aiyuk set to earn more opportunity next season, he is currently a value atWR35.
Target Premium
Target Premium is the percentage of fantasy points per target that a receiver generates above his pass-catching teammates. While this metric is not directly indicative of total fantasy production, it is a useful tool when evaluating how a quarterback upgrade is going to affect a player’s future production. Those who record a high Target Premium accomplish more with their opportunity than those with a low or negative Target Premium.
Christian Watson‘s surreal +53.2-percent Target Premium is fantastic news for his current and prospective fantasy managers. When Aaron Rodgers is ultimately traded, there will be a downgrade in offensive productivity under Jordan Love. That being said, we can trust Watson to rise above his fellow teammates and dominate the receiving production in Green Bay.
Dominator Rating
A receiver’s Dominator Rating is his percentage share of his team’s total receiving yards and touchdowns. Aptly named, it describes the player’s ability to truly dominate his target competition. Those who record an elite Dominator Rating (30-percent or above) are alphas in their respective offenses. Receivers reaching this threshold have averaged 16.6 Fantasy Points per Game.
Jerry Jeudy has been at the center of trade rumors all off-season.
Which NFL team needs him the MOST? pic.twitter.com/PvJeqY19Up
— Jack Caporuscio (@Caporuscio_Jack) April 1, 2023
Finishing with a 31.1-percent (No. 11) Dominator Rating, Jerry Jeudy was a sneaky dominant receiver within the Denver Broncos’ offense. Buried beneath the shadows of a broken offense, Jeudy had a career season. He was surprisingly an efficient producer, generating 2.29 (No. 16) Yards per Route Run and 1.92 (No. 21) Yards per Team Pass Attempt. Despite the narrative surrounding Jeudy throughout his career, he displayed a level of talent that demands respect in your upcoming drafts.
Production Premium
Production Premium standardizes every play outcome by calculating the average performance taking into consideration down, distance, play type, and game situation. This allows us to compare all players’ production profiles across the league with one another. Player’s with a positive Production Premium can be considered more efficient than other players with similar opportunities in similar situations.
In his rookie season, Christian Watson immediately proved he was an above-average playmaker. Thanks to 9.4 (No. 15) Yards per Target and an 18.8-percent Touchdown Rate, he generated a +16.4 (No. 4) Production Premium. With a potential quarterback change on the horizon, his stellar rookie performance should signal that Watson has the talent to produce at an above-average rate no matter the quality of opportunity he’ll see.
Expected Points Added (EPA)
Expected Points Added (commonly known as EPA) calculates a player’s actual contribution to the points on the scoreboard by taking into account down, distance, field position and game situation. EPA looks to quantify the true value a player brings to his team.
Let’s use Mack Hollins as an example. On the surface, his profile isn’t pretty. He was an inefficient producer who scored only four touchdowns all season, yet clocked in with +45.5 (No. 22) Expected Points Added because of how often Hollins was making drive-saving plays. Because this metric can be impacted by low-fantasy-value plays, this metric is not a powerful predictor of fantasy production. It is, however, a powerful way to contextualize a player’s involvement in the offense.
Best Ball Points Added
Best Ball Points Added aides in the evaluation of a player’s value in Best Ball scoring formats. Due to the format, this penalizes low-volume consistency and emphasizes weekly volatility. This is why Garrett Wilson was a more valuable asset in Best Ball than Brandon Aiyuk, despite finishing with less fantasy points per game.
Wilson’s volatility led to six games of 17 or more fantasy points (clearing 24 fantasy points in three of them) while Ayiuk finished with only three such games last season. You want to build a portfolio of different production profiles and ranges of outcomes, but in general you want to prioritize the “unpredictable” reviews who can net you big weeks throughout the season.
Route Win Rate
The PlayerProfiler performance analysts watch every route run by every receiver and determine if each one was a “win” or a “loss”. A “win” is when the receiver gained enough separation to be considered “open”. Those who win a high percentage of their routes are the smoothest route technicians in the game, and are also one who we want to keep our eyes on for fantasy football.
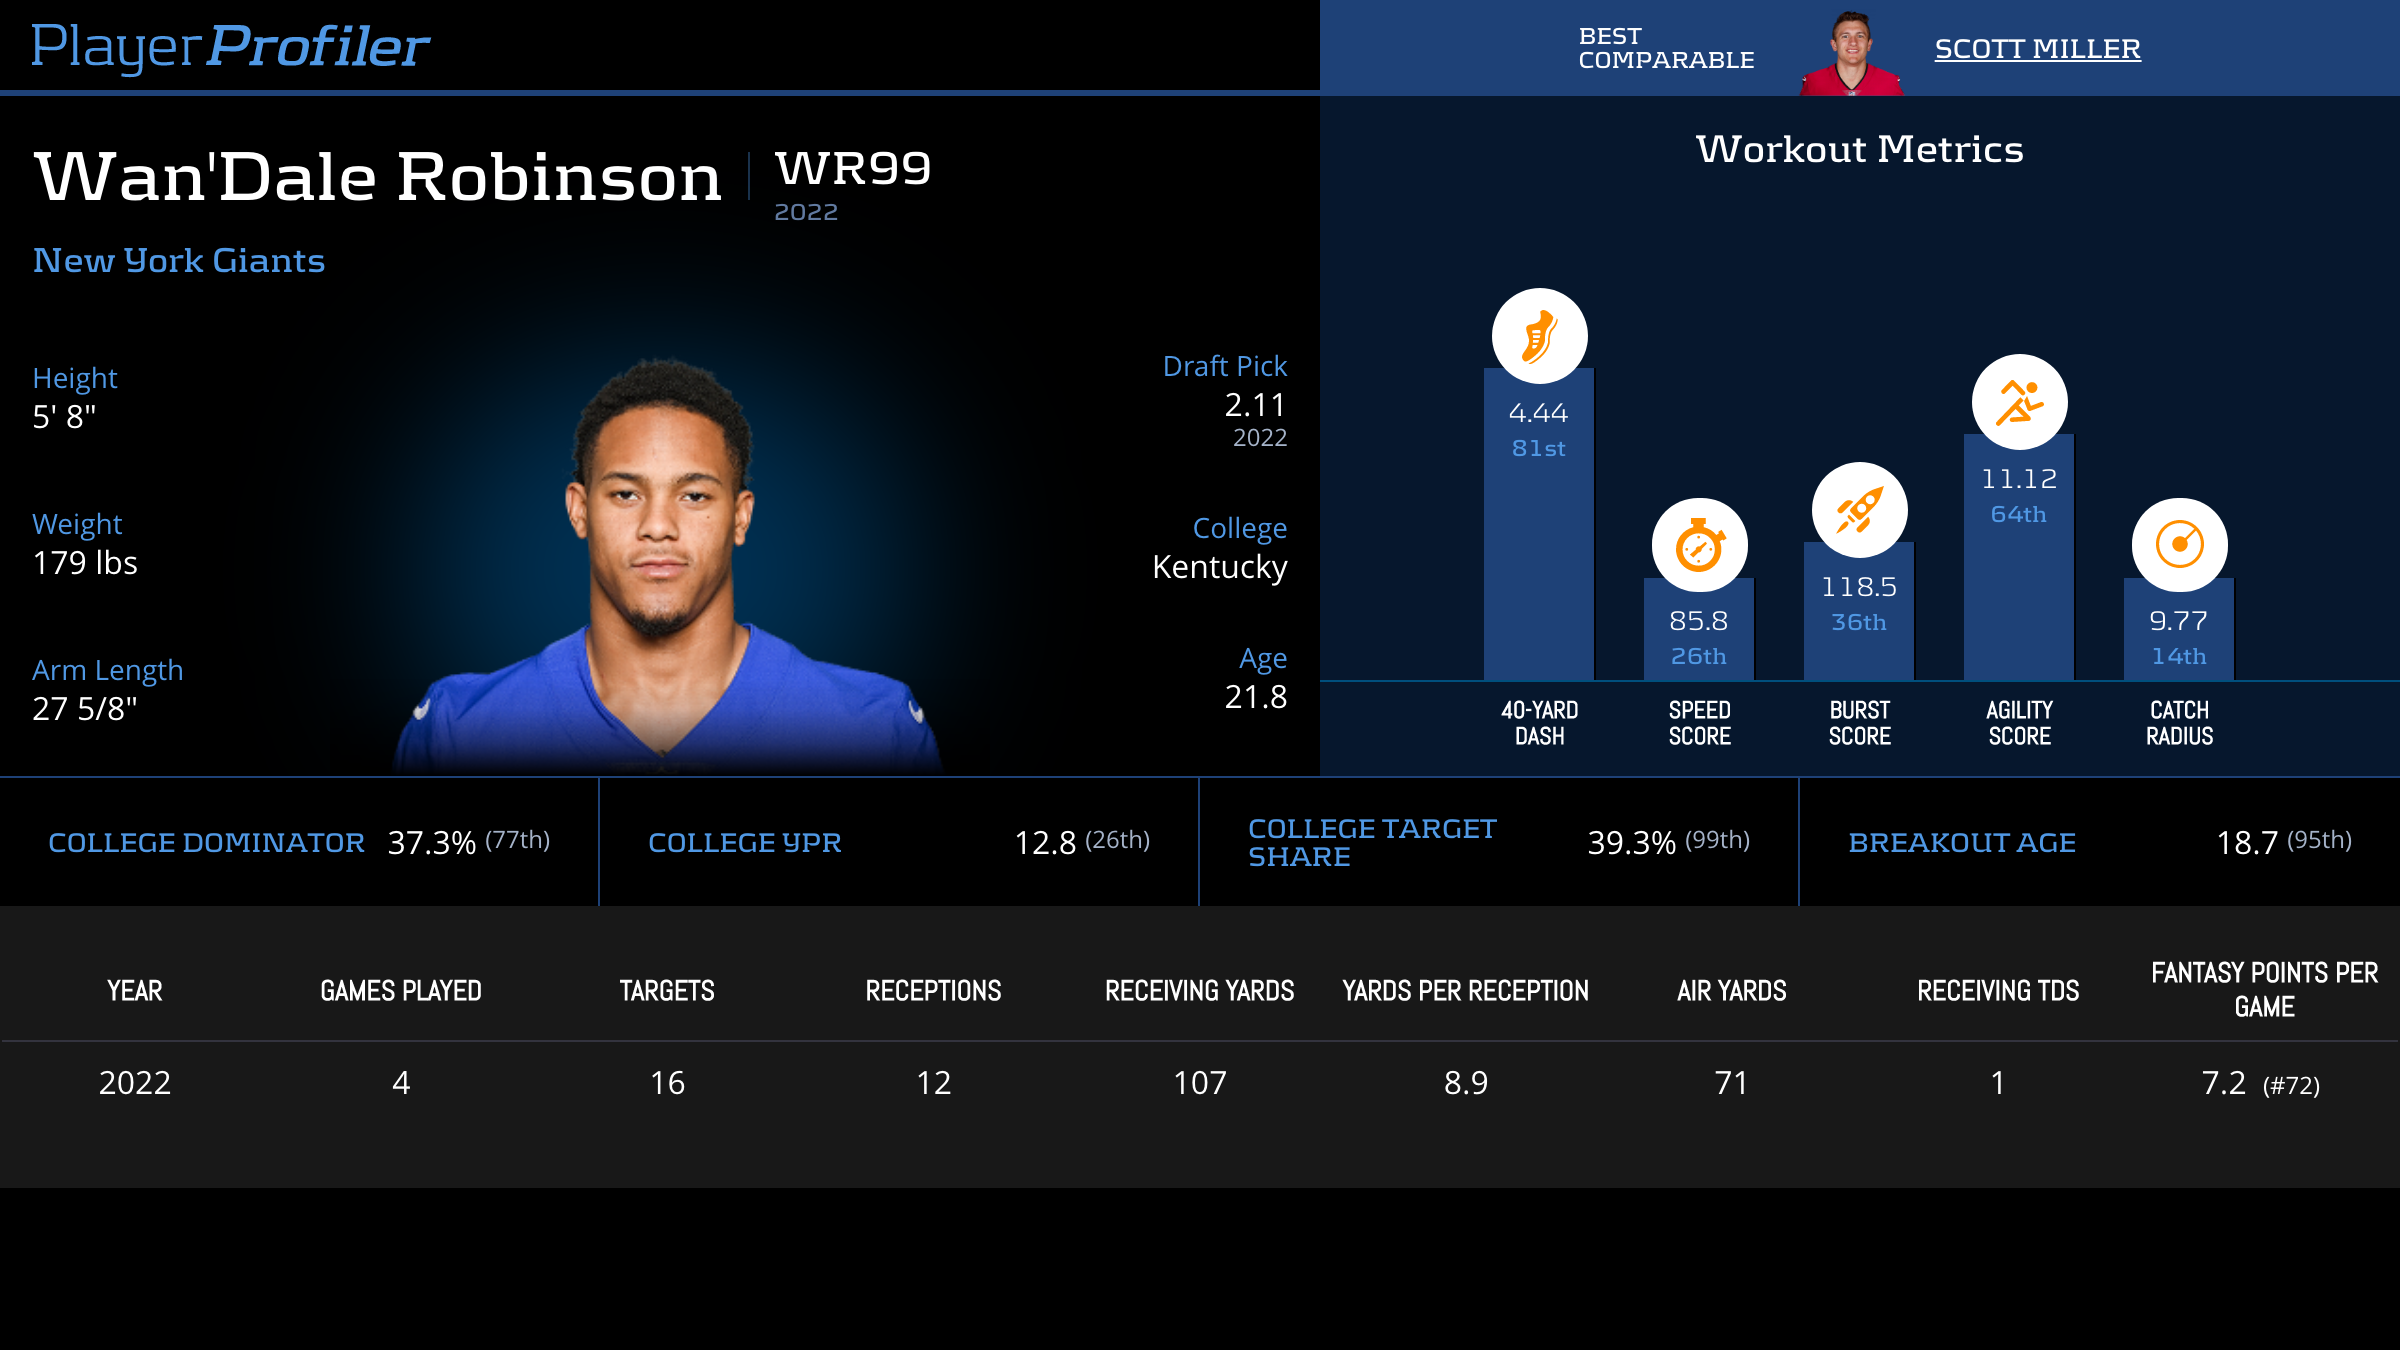
Wan’Dale Robinson Advanced Stats & Metrics Profile
Receivers who get open get more targets and, subsequently, more fantasy points. Wan’Dale Robinson is a player we only experienced in a small sample size, but his 54.1-percent Route Win Rate signals that he is the real deal. His ability to get open allowed him to post 2.03 Yards per Route Run and churn out three double-digit fantasy performances in six games. His teammate, Isaiah Hodgins, should also be of stronger consideration in fantasy drafts, finishing with a 53.1-percent (No. 1) Route Win Rate.
College Production & Workout Metrics
We know that the best predictor of future opportunity is past opportunity, but what do we do for rookies? For incoming talent, there is no stronger predictor than draft capital. Next to the level of investment a team places in a player, we can look to his college production and workout metrics to evaluate the quality of his prospect profile.
40-Yard Dash / Speed Score / Height-Adjusted Speed Score
The 40-Yard dash is the most anticipated athletic test in football. Measuring a player’s straight-line speed is important to NFL scouts to gauge the athlete’s overall athleticism. That being said, stopping at the player’s 40-time is just scratching the surface. The real value is uncovered when you take into account a player’s size in tandem with his Speed. Speed Score aims to better predict running back success by factoring in the back’s weight, placing a premium on larger, faster backs. Height-Adjusted Speed Score (HaSS) aims to better predict wide receiver and tight end success by factoring in the player’s weight and height, placing a premium on taller, heavier, and faster pass-catchers.
For example, Drake London, standing at 6-4 and 213-pounds, ran a 4.58 (37th-percentile) 40-Yard Dash and generated a 100.8 (73rd-percentile) Height-Adjusted Speed Score. Tyreek Hill, standing at 5-10 and 185-pounds, similarly produced a 100.0 (71st percentile) HaSS. This is not to say London is as fast or faster than Hill. Merely, their relative speeds are of similar prowess given their sizes.
Burst Score & Agility Score
Burst Score quantifies a player’s stop-and-start acceleration and ability to catch the ball outside of his frame by summing together his Vertical Leap and Broad Jump. For this metric, the Broad Jump and Vertical leap are weighted equally. Burst Score is particularly useful for wide receivers as it measures one’s ability to quickly explode off of the line of scrimmage and put his defender in an unfavorable position.
Agility Score measures a player’s short area quickness and balance by summing his 20-Yard Shuttle and 3-Cone drills. This correlates with the ability to easily create yards before contact and break in and out of routes.
College Dominator Rating
A player’s largest share of his team’s receiving yards and touchdowns in a single season is known as his College Dominator Rating. When a college prospect displays the ability to be the driver of his team’s passing offense, that player is more likely to be able to command a significant share of opportunity in the NFL.
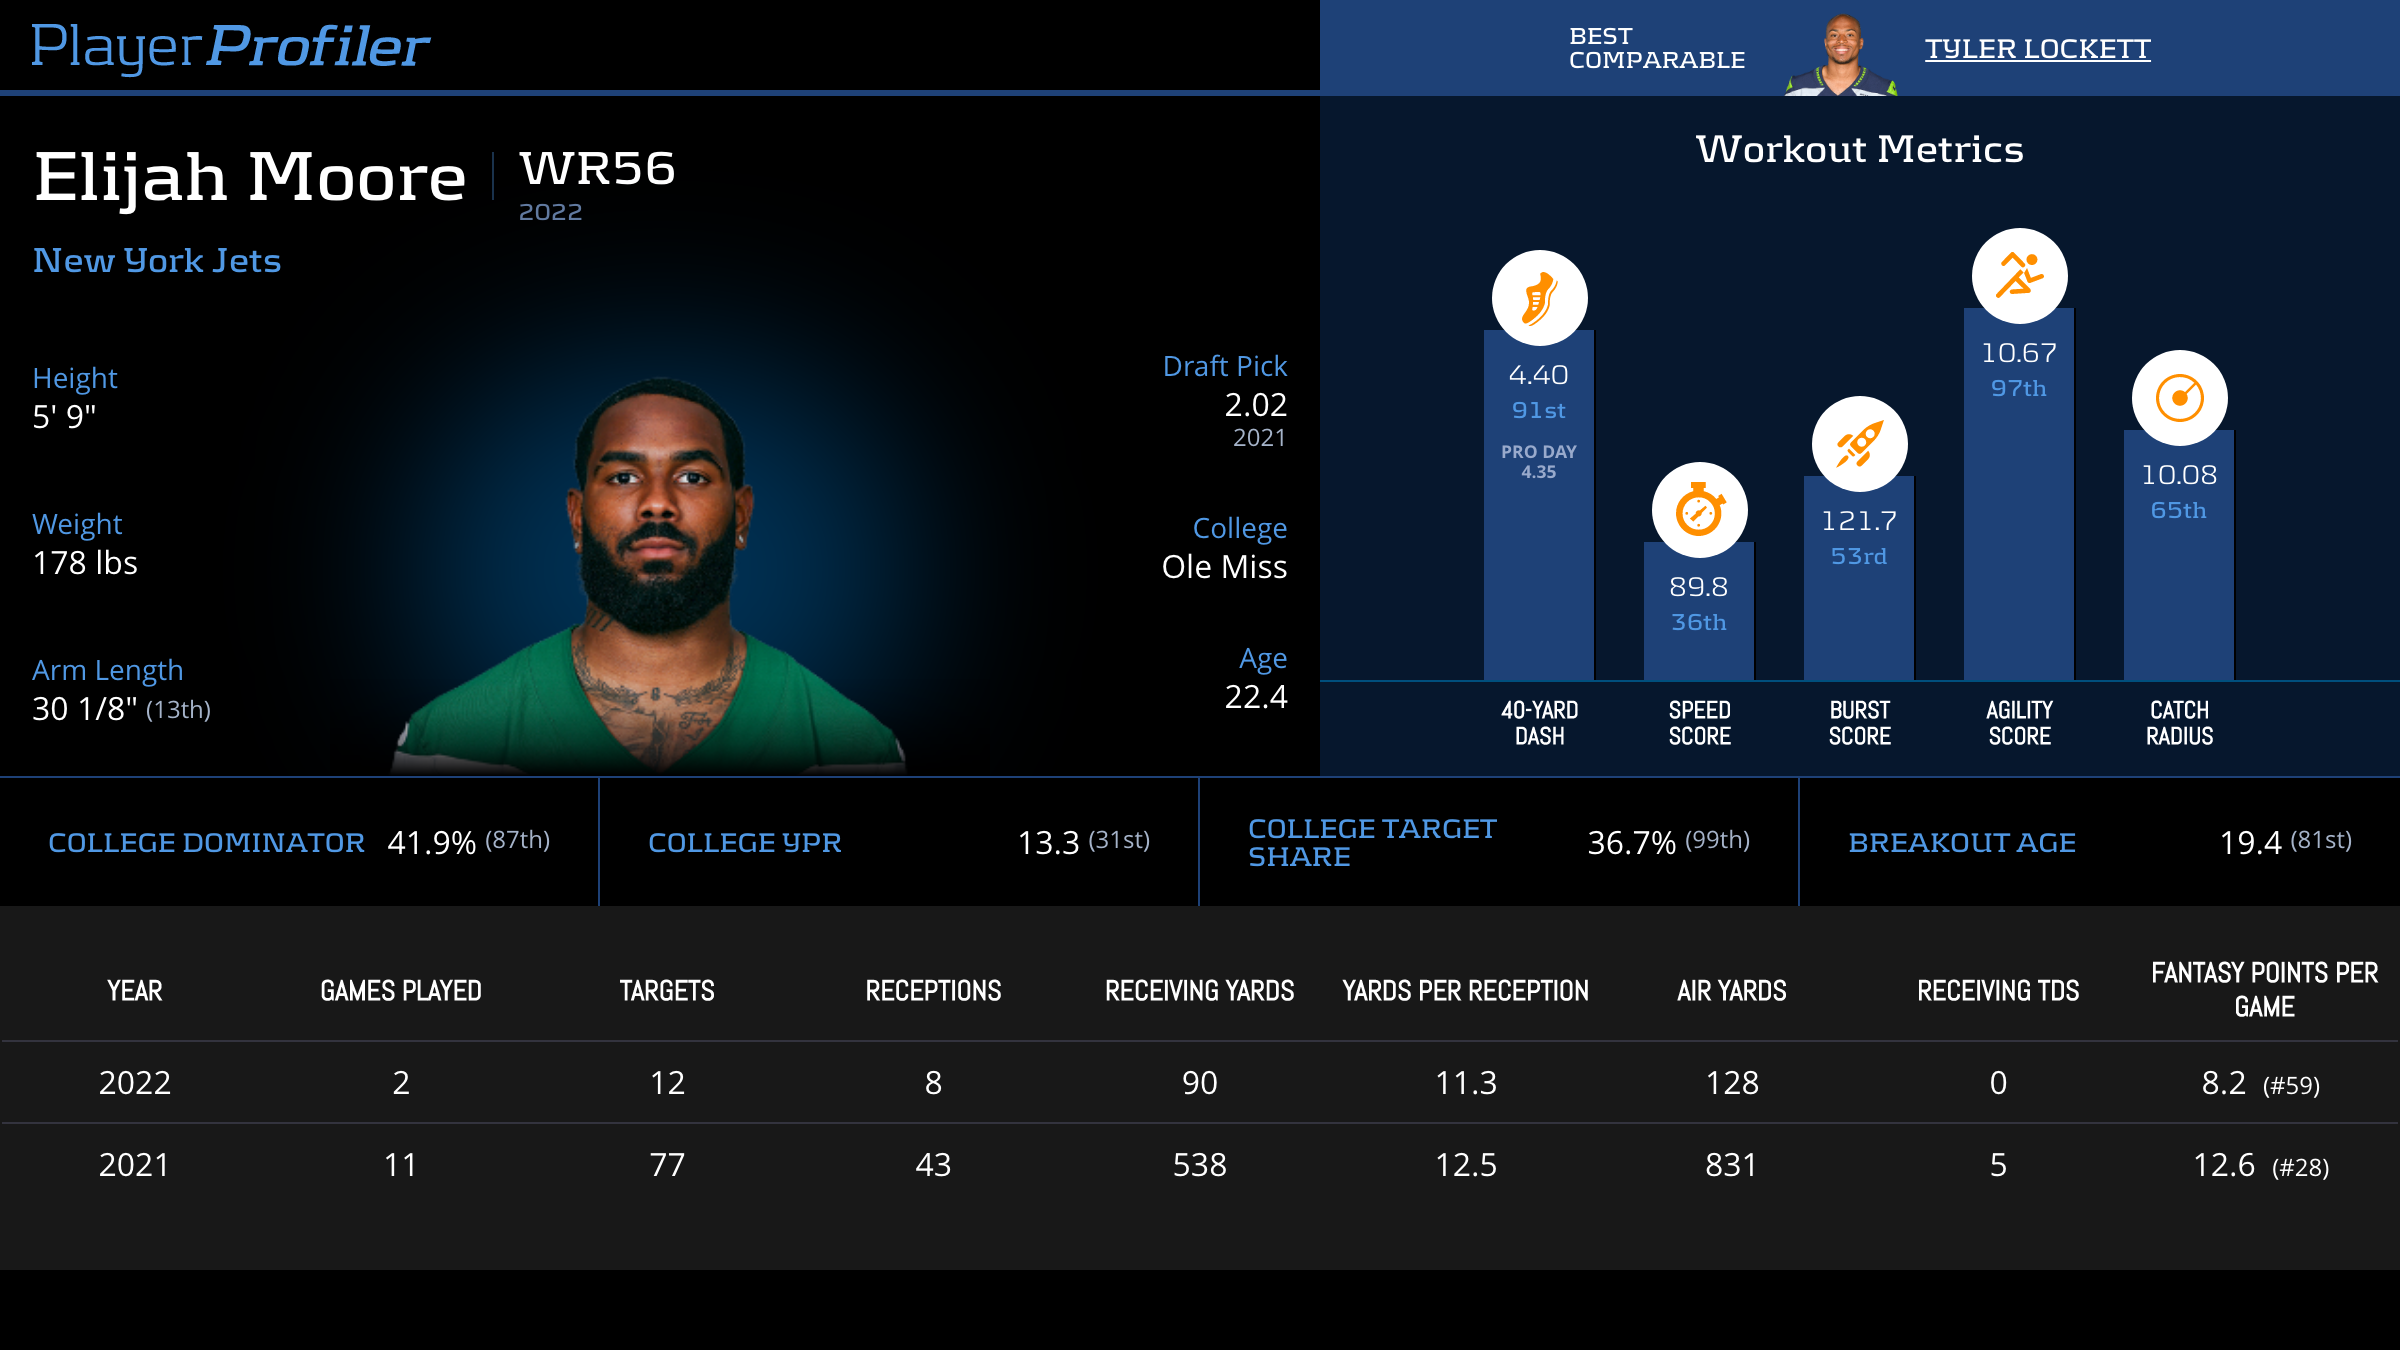
Elijah Moore Advanced Stats & Metrics Profile
Elijah Moore recorded a 41.9-percent (87th-percentile) College Dominator Rating at LSU. That immediately translated his rookie season, accounting for 26.1-percent of the Jets’ receiving production. Despite his recent struggles, his prospect profile and rookie production signal that Moore is a talented receiver. Now in Cleveland, he’ll have the opportunity to potentially work as the No. 2 receiver.
College Target Share
A player’s largest single-season Target Share is known as his College Target Share. Similarly to College Dominator Rating, the larger a player’s College Target Share, the more likely he’ll be to command significant volume at the next level. 34 of the 98 receivers drafted since 2017 who recorded a minimum 25-percent College Target Share have already gone on to achieve at least one season of 10+ fantasy points per game.
In tandem with his Dominator Rating, Trey Palmer‘s 32.6-percent (96th-percentile) College Target Share should ease the concerns brought on by his third-year transfer to Nebraska. He dominated the receiving opportunity and production at a power-5 school, and possesses a size-speed combo that gives him a promising career outlook. Ranked as the WR11 in the Dynasty Deluxe Rookie Rankings, Palmer is going to be a gem in upcoming rookie drafts.
Breakout Age
The younger someone becomes a leader in his/her field, the more likely that person is to become phenomenal in their craft. Frank DuPont and Shawn Siegle first examined wide receiver’s Breakout Age. A receiver’s Breakout Age is his age at the beginning of the season where he first records at or above a 20-percent College Dominator Rating.
The earlier a receiver’s breakout age, the more likely he is to break out at the next level. Stefon Diggs is considered an outlier for achieving his level of success while being a 5th-round pick. However, his 18.8 (93rd-percentile) Breakout Age signaled that he was capable of becoming a phenom long before he entered the draft.
Follow @babich_matt10

