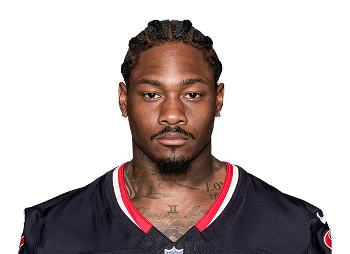
Stefon Diggs Receives Four-Year Contract Extension
Buffalo Bills wide receiver Stefon Diggs became the latest ...
Year Year | Games Played Games | Targets Tgts | Receptions Rec | Receiving Yards Rec Yds | Yards Per Reception YPR | Air Yards Air Yds | Receiving TDs Rec TD | Fantasy Points Per Game Fantasy Pts/Game |
---|---|---|---|---|---|---|---|---|
2021 | 17 | 164 | 103 | 1225 | 11.9 | 1828 | 10 | 16.8 (#9) |
2020 | 16 | 166 | 127 | 1535 | 12.1 | 1716 | 8 | 20.5 (#3) |
2019 | 15 | 93 | 63 | 1129 | 17.9 | 1394 | 6 | 14.3 (#24) |
2018 | 15 | 148 | 102 | 1021 | 10.0 | 1373 | 9 | 17.6 (#11) |
2017 | 14 | 95 | 64 | 849 | 13.3 | 1117 | 8 | 14.2 (#11) |
2016 | 13 | 112 | 84 | 903 | 10.8 | 997 | 3 | 14.9 (#14) |
2015 | 13 | 84 | 52 | 720 | 13.8 | - | 4 | 11.5 (#42) |
Targets | Target Share | Target Rate | Snap Share | Slot Snaps | Routes Run | Route Participation Route % |
---|---|---|---|---|---|---|
164 (9.6 p/g) | 26.4% (29.1% rz) | 28.9% | 82.7% | 145 (15.3% rate) | 567 (33.4 p/g) | 86.7% |
#5 | #13 | #8 | #25 | #64 | #7 | #30 |
Air Yards | Air Yards Share | Average Target Distance (ADOT) Target Depth (ADOT) | Deep Targets | Red Zone Targets Red Zone Tgts | Target Quality Rating | Catchable Target Rate |
---|---|---|---|---|---|---|
1828 (107.5 p/g) | 34.3% | 11.1 | 28 (1.6 p/g) | 34 (20 rec) | 5.38 | 72.0% (118 tgts) |
#2 | #17 | #37 | #7 | #2 | #47 | #69 |
Receptions Recs | Receiving Yards Rec Yards | Yards After Catch YAC | Unrealized Air Yards | Total TDs | Fantasy Points Per Game Fantasy Pts/Game | Expected Fantasy Points Per Game Expected Fantasy Pts/Game |
---|---|---|---|---|---|---|
103 (6.1 p/g) | 1225 (72.1 p/g) | 320 (2.0 p/tgt) | 923 (5.6 p/tgt) | 10 (9.7% rate) | 16.8 | 18.3 (-1.47 diff) |
#8 | #7 | #23 | #2 | #7 | #9 | #6 |
Target Accuracy | Yards Per Route Run | Formation Adjusted Yards Per Route Run Formation Adjusted YPRR | Yards Per Target YPT | Yards Per Reception YPR | Yards Per Team Pass Attempt Yards/Team Pass Attempt | True Catch Rate |
---|---|---|---|---|---|---|
7.3 | 2.16 | 2.08 | 7.5 | 11.9 | 1.87 | 87.3% (62.8% actual) |
#39 | #14 | #14 | #65 | #62 | #15 | #40 |
Target Separation | Average Cushion | Target Premium | Dominator Rating | Juke Rate | Drops | Contested Catch Rate Contested Catch % |
---|---|---|---|---|---|---|
1.57 | 4.00 | -3.7% | 27.7% | 8.7% | 4 (2.4% rate) | 40.0% (35 tgts) |
#64 | #91 | #61 | #18 | #48 | #48 | #38 |
Production Premium | Expected Points Added (EPA) EPA | QB Rating Per Target QB Rating Per Target | Best Ball Points Added Best Ball Pts Added | Fantasy Points Per Route Run Fantasy Points Per Route | Fantasy Points Per Target Fantasy Points Per Target | Total Fantasy Points Total Fantasy Pts |
---|---|---|---|---|---|---|
-2.6 | +41.7 | 100.8 | 131.0 (7.7 p/g) | 0.50 | 1.74 | 285.50 |
#63 | #26 | #51 | #8 | #15 | #51 | #7 |
Total Route Wins | Route Win Rate | Routes vs Man | Win Rate vs Man | Target Rate vs Man | Target Separation vs Man Tgt Separation vs Man | Fantasy Points Per Target vs Man Fantasy Pts/Tgt vs Man |
---|---|---|---|---|---|---|
267 | 46.8% | 333 (228 zone) | 42.3% (50.4% zone) | 27.9% (27.2% zone) | 1.51 (2.12 zone) | 1.80 (1.80 zone) |
#2 | #13 | #6 | #13 | #17 | #61 | #44 |
Targets | Target Share | Target Rate | Snap Share | Slot Snaps | Routes Run | Route Participation Route % |
---|---|---|---|---|---|---|
166 (10.4 p/g) | 29.1% (19.0% rz) | 27.9% | 87.5% | 223 (24.7% rate) | 595 (37.2 p/g) | 100.0% |
#1 | #3 | #5 | #13 | #35 | #8 | - |
Air Yards | Air Yards Share | Average Target Distance (ADOT) Target Depth (ADOT) | Deep Targets | Red Zone Targets Red Zone Tgts | Target Quality Rating | Catchable Target Rate |
---|---|---|---|---|---|---|
1716 (107.3 p/g) | 33.7% | 10.3 | 18 (1.1 p/g) | 15 (12 rec) | 6.67 | 84.9% (141 tgts) |
#4 | #15 | #52 | #30 | #14 | #11 | #11 |
Receptions Recs | Receiving Yards Rec Yards | Yards After Catch YAC | Unrealized Air Yards | Total TDs | Fantasy Points Per Game Fantasy Pts/Game | Expected Fantasy Points Per Game Expected Fantasy Pts/Game |
---|---|---|---|---|---|---|
127 (7.9 p/g) | 1535 (95.9 p/g) | 463 (2.8 p/tgt) | 644 (3.9 p/tgt) | 8 (6.3% rate) | 20.5 | 18.6 (+1.90 diff) |
#1 | #1 | #7 | #18 | #12 | #3 | #2 |
Target Accuracy | Yards Per Route Run | Formation Adjusted Yards Per Route Run Formation Adjusted YPRR | Yards Per Target YPT | Yards Per Reception YPR | Yards Per Team Pass Attempt Yards/Team Pass Attempt | True Catch Rate |
---|---|---|---|---|---|---|
507.0 | 2.58 | 2.48 | 9.2 | 12.1 | 2.58 | 90.1% (76.5% actual) |
#1 | #6 | #4 | #26 | #65 | #3 | #26 |
Target Separation | Average Cushion | Target Premium | Dominator Rating | Juke Rate | Drops | Contested Catch Rate Contested Catch % |
---|---|---|---|---|---|---|
1.64 | 3.76 | -5.7% | 26.1% | - | 6 (3.6% rate) | 62.9% (35 tgts) |
#52 | #54 | #114 | #31 | - | #16 | #17 |
Production Premium | Expected Points Added (EPA) EPA | QB Rating Per Target QB Rating Per Target | Best Ball Points Added Best Ball Pts Added | Fantasy Points Per Route Run Fantasy Points Per Route | Fantasy Points Per Target Fantasy Points Per Target | Total Fantasy Points Total Fantasy Pts |
---|---|---|---|---|---|---|
+3.4 | +87.1 | 112.9 | 178.2 (11.1 p/g) | 0.55 | 1.98 | 328.60 |
#59 | #2 | #21 | #3 | #5 | #30 | #3 |
Targets | Target Share | Target Rate | Snap Share | Slot Snaps | Routes Run | Route Participation Route % |
---|---|---|---|---|---|---|
93 (6.2 p/g) | 21.9% (10.9% rz) | 24.5% | 83.1% | 109 (14.7% rate) | 380 (25.3 p/g) | 85.4% |
#34 | #25 | #38 | #42 | #79 | #46 | #24 |
Air Yards | Air Yards Share | Average Target Distance (ADOT) Target Depth (ADOT) | Deep Targets | Red Zone Targets Red Zone Tgts | Target Quality Rating | Catchable Target Rate |
---|---|---|---|---|---|---|
1394 (92.9 p/g) | 40.3% | 15.0 | 28 (1.9 p/g) | 5 (1 rec) | 7.88 | 82.8% (77 tgts) |
#21 | #3 | #9 | #5 | #89 | #1 | #17 |
Receptions Recs | Receiving Yards Rec Yards | Yards After Catch YAC | Unrealized Air Yards | Total TDs | Fantasy Points Per Game Fantasy Pts/Game | Expected Fantasy Points Per Game Expected Fantasy Pts/Game |
---|---|---|---|---|---|---|
63 (4.2 p/g) | 1129 (75.3 p/g) | 283 (3.0 p/tgt) | 548 (5.9 p/tgt) | 6 (8.8% rate) | 14.3 | - |
#30 | #15 | #27 | #38 | #23 | #24 | - |
Target Accuracy | Yards Per Route Run | Formation Adjusted Yards Per Route Run Formation Adjusted YPRR | Yards Per Target YPT | Yards Per Reception YPR | Yards Per Team Pass Attempt Yards/Team Pass Attempt | True Catch Rate |
---|---|---|---|---|---|---|
7.4 | 2.97 | - | 12.1 | 17.9 | 2.54 | 81.8% (67.7% actual) |
#19 | #4 | - | #3 | #6 | #2 | #48 |
Target Separation | Average Cushion | Target Premium | Dominator Rating | Juke Rate | Drops | Contested Catch Rate Contested Catch % |
---|---|---|---|---|---|---|
1.62 | 3.60 | +32.5% | 27.2% | - | 6 (6.5% rate) | 41.2% (17 tgts) |
#36 | #96 | #9 | #25 | - | #18 | #45 |
Production Premium | Expected Points Added (EPA) EPA | QB Rating Per Target QB Rating Per Target | Best Ball Points Added Best Ball Pts Added | Fantasy Points Per Route Run Fantasy Points Per Route | Fantasy Points Per Target Fantasy Points Per Target | Total Fantasy Points Total Fantasy Pts |
---|---|---|---|---|---|---|
+33.9 | +76.4 | 108.2 | 94.9 (6.3 p/g) | 0.56 | 2.30 | 214.00 |
#4 | #8 | #23 | #22 | #8 | #6 | #22 |
Targets | Target Share | Target Rate | Snap Share | Slot Snaps | Routes Run | Route Participation Route % |
---|---|---|---|---|---|---|
148 (9.9 p/g) | 26.0% (26.5% rz) | 27.9% | 94.3% | 139 (16.1% rate) | 531 (35.4 p/g) | 90.9% |
#7 | #11 | #15 | #12 | #56 | #7 | #11 |
Air Yards | Air Yards Share | Average Target Distance (ADOT) Target Depth (ADOT) | Deep Targets | Red Zone Targets Red Zone Tgts | Target Quality Rating | Catchable Target Rate |
---|---|---|---|---|---|---|
1373 (91.5 p/g) | 30.7% | 9.3 | - (0.0 p/g) | 18 (12 rec) | 5.55 | 79.1% (117 tgts) |
#18 | #18 | #80 | - | #11 | #62 | #41 |
Receptions Recs | Receiving Yards Rec Yards | Yards After Catch YAC | Unrealized Air Yards | Total TDs | Fantasy Points Per Game Fantasy Pts/Game | Expected Fantasy Points Per Game Expected Fantasy Pts/Game |
---|---|---|---|---|---|---|
102 (6.8 p/g) | 1021 (68.1 p/g) | 414 (2.8 p/tgt) | 766 (5.2 p/tgt) | 9 | 17.6 | - |
#8 | #17 | #10 | #13 | #8 | #11 | - |
Target Accuracy | Yards Per Route Run | Formation Adjusted Yards Per Route Run Formation Adjusted YPRR | Yards Per Target YPT | Yards Per Reception YPR | Yards Per Team Pass Attempt Yards/Team Pass Attempt | True Catch Rate |
---|---|---|---|---|---|---|
7.1 | 1.92 | - | 6.9 | 10.0 | 1.75 | 87.2% (68.9% actual) |
#48 | #47 | - | #80 | #97 | #28 | #22 |
Target Separation | Average Cushion | Target Premium | Dominator Rating | Juke Rate | Drops | Contested Catch Rate Contested Catch % |
---|---|---|---|---|---|---|
1.36 | 3.87 | +5.7% | 27.9% | - | 4 (2.7% rate) | 59.3% (27 tgts) |
#67 | #75 | #41 | #18 | - | #36 | #20 |
Production Premium | Expected Points Added (EPA) EPA | QB Rating Per Target QB Rating Per Target | Best Ball Points Added Best Ball Pts Added | Fantasy Points Per Route Run Fantasy Points Per Route | Fantasy Points Per Target Fantasy Points Per Target | Total Fantasy Points Total Fantasy Pts |
---|---|---|---|---|---|---|
-1.4 | - | 102.9 | 116.9 (7.8 p/g) | 0.50 | 1.79 | 264.30 |
#50 | - | #38 | #19 | #27 | #51 | #11 |
Targets | Target Share | Target Rate | Snap Share | Slot Snaps | Routes Run | Route Participation Route % |
---|---|---|---|---|---|---|
95 (6.8 p/g) | 20.9% (24.6% rz) | 22.6% | 82.9% | 63 (8.5% rate) | 421 (30.1 p/g) | 91.9% |
#32 | #29 | #33 | #36 | #74 | #45 | #27 |
Air Yards | Air Yards Share | Average Target Distance (ADOT) Target Depth (ADOT) | Deep Targets | Red Zone Targets Red Zone Tgts | Target Quality Rating | Catchable Target Rate |
---|---|---|---|---|---|---|
1117 (79.8 p/g) | 30.1% | 11.8 | - (0.0 p/g) | 14 (12 rec) | 0.00 | 81.1% (77 tgts) |
#31 | #26 | #53 | - | #22 | - | #21 |
Receptions Recs | Receiving Yards Rec Yards | Yards After Catch YAC | Unrealized Air Yards | Total TDs | Fantasy Points Per Game Fantasy Pts/Game | Expected Fantasy Points Per Game Expected Fantasy Pts/Game |
---|---|---|---|---|---|---|
64 (4.6 p/g) | 849 (60.6 p/g) | 262 (2.8 p/tgt) | 530 (5.6 p/tgt) | 8 (0.1% rate) | 14.2 | - |
#22 | #23 | #31 | #44 | #8 | #11 | - |
Target Accuracy | Yards Per Route Run | Formation Adjusted Yards Per Route Run Formation Adjusted YPRR | Yards Per Target YPT | Yards Per Reception YPR | Yards Per Team Pass Attempt Yards/Team Pass Attempt | True Catch Rate |
---|---|---|---|---|---|---|
0.0 | 2.02 | - | 8.9 | 13.3 | 1.85 | 83.1% (67.4% actual) |
- | #19 | - | #17 | #45 | #15 | #43 |
Target Separation | Average Cushion | Target Premium | Dominator Rating | Juke Rate | Drops | Contested Catch Rate Contested Catch % |
---|---|---|---|---|---|---|
1.55 | 4.22 | +43.4% | 28.8% | - | 5 (5.3% rate) | 83.3% (18 tgts) |
#42 | #15 | #5 | #14 | - | #39 | #4 |
Production Premium | Expected Points Added (EPA) EPA | QB Rating Per Target QB Rating Per Target | Best Ball Points Added Best Ball Pts Added | Fantasy Points Per Route Run Fantasy Points Per Route | Fantasy Points Per Target Fantasy Points Per Target | Total Fantasy Points Total Fantasy Pts |
---|---|---|---|---|---|---|
+19.6 | - | 119.2 | 92.1 (6.6 p/g) | 0.47 | 2.09 | 198.20 |
#12 | - | #4 | #31 | #12 | #8 | #19 |
Targets | Target Share | Target Rate | Snap Share | Slot Snaps | Routes Run | Route Participation Route % |
---|---|---|---|---|---|---|
112 (8.6 p/g) | 22.8% (18.8% rz) | 0.0% | 0.0% | 252 (0.0% rate) | - (0.0 p/g) | 0.0% |
#29 | #24 | - | - | #17 | - | - |
Air Yards | Air Yards Share | Average Target Distance (ADOT) Target Depth (ADOT) | Deep Targets | Red Zone Targets Red Zone Tgts | Target Quality Rating | Catchable Target Rate |
---|---|---|---|---|---|---|
997 (76.7 p/g) | 29.0% | 8.9 | - (0.0 p/g) | 12 (11 rec) | 0.00 | 0.0% ( tgts) |
#46 | #31 | #84 | - | #42 | - | - |
Receptions Recs | Receiving Yards Rec Yards | Yards After Catch YAC | Unrealized Air Yards | Total TDs | Fantasy Points Per Game Fantasy Pts/Game | Expected Fantasy Points Per Game Expected Fantasy Pts/Game |
---|---|---|---|---|---|---|
84 (6.5 p/g) | 903 (69.5 p/g) | 295 (2.6 p/tgt) | 389 (3.5 p/tgt) | 3 (3.5% rate) | 14.9 | - |
#14 | #31 | #31 | #67 | #63 | #14 | - |
Target Accuracy | Yards Per Route Run | Formation Adjusted Yards Per Route Run Formation Adjusted YPRR | Yards Per Target YPT | Yards Per Reception YPR | Yards Per Team Pass Attempt Yards/Team Pass Attempt | True Catch Rate |
---|---|---|---|---|---|---|
0.0 | 0.00 | - | 8.1 | 10.8 | 1.85 | 0.0% (75.0% actual) |
- | - | - | #43 | #90 | #19 | - |
Target Separation | Average Cushion | Target Premium | Dominator Rating | Juke Rate | Drops | Contested Catch Rate Contested Catch % |
---|---|---|---|---|---|---|
0.00 | 0.00 | +2.8% | 22.5% | - | 4 (3.6% rate) | 75.0% (8 tgts) |
- | - | #51 | #47 | - | #40 | #11 |
Production Premium | Expected Points Added (EPA) EPA | QB Rating Per Target QB Rating Per Target | Best Ball Points Added Best Ball Pts Added | Fantasy Points Per Route Run Fantasy Points Per Route | Fantasy Points Per Target Fantasy Points Per Target | Total Fantasy Points Total Fantasy Pts |
---|---|---|---|---|---|---|
+7.0 | - | 0.0 | 77.6 (6.0 p/g) | 0.00 | 1.73 | 193.30 |
#37 | - | - | #18 | - | #48 | #30 |
Targets | Target Share | Target Rate | Snap Share | Slot Snaps | Routes Run | Route Participation Route % |
---|---|---|---|---|---|---|
84 (6.5 p/g) | 22.7% (21.1% rz) | 0.0% | 0.0% | - (0.0% rate) | - (0.0 p/g) | 0.0% |
#48 | #25 | - | - | - | - | - |
Air Yards | Air Yards Share | Average Target Distance (ADOT) Target Depth (ADOT) | Deep Targets | Red Zone Targets Red Zone Tgts | Target Quality Rating | Catchable Target Rate |
---|---|---|---|---|---|---|
- (0.0 p/g) | 0.0% | 0.0 | - (0.0 p/g) | 8 (3 rec) | 0.00 | 0.0% ( tgts) |
- | - | - | - | #64 | - | - |
Receptions Recs | Receiving Yards Rec Yards | Yards After Catch YAC | Unrealized Air Yards | Total TDs | Fantasy Points Per Game Fantasy Pts/Game | Expected Fantasy Points Per Game Expected Fantasy Pts/Game |
---|---|---|---|---|---|---|
52 (4.0 p/g) | 720 (55.4 p/g) | - (0.0 p/tgt) | - (0.0 p/tgt) | 4 (7.3% rate) | 11.5 | - |
#41 | #43 | - | - | #43 | #42 | - |
Target Accuracy | Yards Per Route Run | Formation Adjusted Yards Per Route Run Formation Adjusted YPRR | Yards Per Target YPT | Yards Per Reception YPR | Yards Per Team Pass Attempt Yards/Team Pass Attempt | True Catch Rate |
---|---|---|---|---|---|---|
0.0 | 0.00 | - | 8.6 | 13.8 | 1.90 | 0.0% (61.9% actual) |
- | - | - | #33 | #44 | #21 | - |
Target Separation | Average Cushion | Target Premium | Dominator Rating | Juke Rate | Drops | Contested Catch Rate Contested Catch % |
---|---|---|---|---|---|---|
0.00 | 0.00 | -4.4% | 28.5% | - | - (0.0% rate) | 58.3% (12 tgts) |
- | - | #70 | #20 | - | - | #20 |
Production Premium | Expected Points Added (EPA) EPA | QB Rating Per Target QB Rating Per Target | Best Ball Points Added Best Ball Pts Added | Fantasy Points Per Route Run Fantasy Points Per Route | Fantasy Points Per Target Fantasy Points Per Target | Total Fantasy Points Total Fantasy Pts |
---|---|---|---|---|---|---|
+8.2 | - | 0.0 | 55.9 (4.3 p/g) | 0.00 | 1.78 | 149.30 |
#33 | - | - | #42 | - | #40 | #46 |
Week Wk | Opponent Opp | Primary Corner Primary Corner | Snap Share Snap Share | Routes Routes | Targets Targets | Receptions Receptions | Receiving Yards Receiving Yards | Fantasy Points Fantasy Points |
---|---|---|---|---|---|---|---|---|
1 | PIT | Joe Haden | 92.4% | 43 | 14 (2 rz) | 9 | 69 (150 air) | 15.9 (#29) |
2 | MIA | Xavien Howard | 81.0% | 28 | 8 (2 rz) | 4 (1 tds) | 60 (107 air) | 16.0 (#27) |
3 | WAS | Benjamin St. Juste | 77.6% | 37 | 10 | 6 | 62 (158 air) | 12.2 (#36) |
4 | HOU | Desmond King | 73.2% | 25 | 10 (2 rz) | 7 | 114 (128 air) | 18.4 (#16) |
5 | KC | Rashad Fenton | 75.9% | 15 | 5 (1 rz) | 2 | 69 (90 air) | 8.9 (#48) |
6 | TEN | Janoris Jenkins | 83.6% | 41 | 11 (4 rz) | 9 (1 tds) | 89 (92 air) | 23.9 (#7) |
8 | MIA | Xavien Howard | 77.3% | 30 | 7 (1 rz) | 5 (1 tds) | 40 (31 air) | 15.0 (#23) |
9 | JAX | Shaquill Griffin | 89.2% | 43 | 8 | 6 | 85 (72 air) | 14.5 (#18) |
10 | NYJ | Bryce Hall | 82.5% | 31 | 13 (5 rz) | 8 (1 tds) | 162 (181 air) | 30.2 (#2) |
11 | IND | Kenny Moore | 75.9% | 32 | 6 (2 rz) | 4 (2 tds) | 23 (66 air) | 18.3 (#17) |
12 | NO | Marshon Lattimore | 82.3% | 23 | 9 (1 rz) | 7 (1 tds) | 74 (68 air) | 20.4 (#7) |
13 | NE | J.C. Jackson | 94.7% | 30 | 7 (1 rz) | 4 | 51 (108 air) | 9.1 (#38) |
14 | TB | Carlton Davis | 89.3% | 51 | 13 (1 rz) | 7 | 74 (151 air) | 14.4 (#33) |
15 | CAR | Stephon Gilmore | 82.0% | 31 | 7 (2 rz) | 4 (1 tds) | 35 (61 air) | 13.5 (#18) |
16 | NE | J.C. Jackson | 80.5% | 39 | 13 (5 rz) | 7 (1 tds) | 85 (131 air) | 21.5 (#9) |
17 | ATL | A.J. Terrell | 82.2% | 26 | 9 (3 rz) | 5 | 52 (109 air) | 10.2 (#43) |
18 | NYJ | Brandin Echols | 84.8% | 42 | 14 (2 rz) | 9 (1 tds) | 81 (125 air) | 23.1 (#13) |
19 | NE | J.C. Jackson | 66.7% | 21 | 4 | 3 | 60 (48 air) | 9.0 (#24) |
20 | KC | Charvarius Ward | 84.4% | 38 | 6 (1 rz) | 3 | 7 (56 air) | 5.7 (#17) |
Week Wk | Opponent Opp | Primary Corner Primary Corner | Snap Share Snap Share | Routes Routes | Targets Targets | Receptions Receptions | Receiving Yards Receiving Yards | Fantasy Points Fantasy Points |
---|---|---|---|---|---|---|---|---|
1 | NYJ | Blessuan Austin | 95.1% | 52 | 9 (1 rz) | 8 | 86 (93 air) | 16.6 (#22) |
2 | MIA | Noah Igbinoghene | 71.7% | 29 | 13 (1 rz) | 8 (1 tds) | 153 (152 air) | 29.3 (#2) |
3 | LAR | Jalen Ramsey | 94.8% | 33 | 6 (2 rz) | 4 (1 tds) | 49 (42 air) | 14.9 (#31) |
4 | LV | Trayvon Mullen | 89.8% | 33 | 7 | 6 | 115 (103 air) | 17.5 (#17) |
5 | TEN | Johnathan Joseph | 84.1% | 43 | 16 | 10 | 106 (132 air) | 20.6 (#13) |
6 | KC | Charvarius Ward | 88.2% | 28 | 8 (1 rz) | 6 (1 tds) | 46 (131 air) | 16.6 (#17) |
7 | NYJ | Blessuan Austin | 97.2% | 48 | 11 | 6 | 48 (101 air) | 10.8 (#47) |
8 | NE | J.C. Jackson | 87.5% | 21 | 9 (1 rz) | 6 | 92 (87 air) | 15.2 (#26) |
9 | SEA | Quinton Dunbar | 87.5% | 39 | 12 | 9 | 118 (131 air) | 20.8 (#15) |
10 | ARI | Patrick Peterson | 95.5% | 50 | 10 | 10 (1 tds) | 93 (78 air) | 25.3 (#3) |
12 | LAC | Michael Davis | 96.6% | 29 | 9 (1 rz) | 7 | 39 (45 air) | 10.9 (#36) |
13 | SF | Jason Verrett | 92.5% | 41 | 10 (1 rz) | 10 | 92 (92 air) | 19.2 (#17) |
14 | PIT | Steven Nelson | 93.0% | 46 | 14 (2 rz) | 10 (1 tds) | 130 (165 air) | 29.1 (#1) |
15 | DEN | Michael Ojemudia | 96.9% | 40 | 13 (3 rz) | 11 | 147 (175 air) | 25.7 (#4) |
16 | NE | J.C. Jackson | 77.1% | 36 | 11 (2 rz) | 9 (3 tds) | 145 (113 air) | 41.5 (#2) |
17 | MIA | Xavien Howard | 50.0% | 27 | 8 | 7 | 76 (76 air) | 14.6 (#32) |
Week Wk | Opponent Opp | Primary Corner Primary Corner | Snap Share Snap Share | Routes Routes | Targets Targets | Receptions Receptions | Receiving Yards Receiving Yards | Fantasy Points Fantasy Points |
---|---|---|---|---|---|---|---|---|
1 | ATL | Desmond Trufant | 54.2% | 10 | 2 | 2 | 37 | 5.7 (##73) |
2 | GB | Kevin King | 89.8% | 27 | 7 (2 rz) | 1 (1 tds) | 49 | 11.9 (##42) |
3 | OAK | Gareon Conley | 66.1% | 15 | 3 | 3 | 15 | 4.5 (##78) |
4 | CHI | Prince Amukamara | 98.1% | 29 | 7 | 7 | 108 | 15.8 (##16) |
5 | NYG | Deandre Baker | 80.3% | 21 | 4 | 3 | 44 | 7.4 (##51) |
6 | PHI | Rasul Douglas | 64.1% | 21 | 11 (1 rz) | 7 (3 tds) | 167 | 43.5 (##1) |
7 | DET | Justin Coleman | 80.3% | 27 | 8 | 7 | 142 | 21.2 (##8) |
8 | WAS | Fabian Moreau | 84.4% | 21 | 7 | 7 | 143 | 19.3 (##12) |
9 | KC | Charvarius Ward | 95.4% | 34 | 4 (1 rz) | 1 | 4 | 2.6 (##82) |
10 | DAL | Byron Jones | 85.3% | 28 | 6 (1 rz) | 3 | 49 | 7.9 (##43) |
11 | DEN | Chris Harris | 100.0% | 35 | 5 | 5 (1 tds) | 121 | 23.1 (##6) |
13 | SEA | Tre Flowers | 96.2% | 35 | 9 | 4 | 25 | 9.2 (##49) |
14 | DET | Darius Slay | 72.5% | 25 | 9 | 6 | 92 | 15.2 (##26) |
15 | LAC | Casey Hayward | 74.2% | 22 | 6 | 4 | 76 | 12.0 (##36) |
16 | GB | Jaire Alexander | 100.0% | 30 | 5 | 3 (1 tds) | 57 | 14.7 (##26) |
Week Wk | Opponent Opp | Primary Corner Primary Corner | Snap Share Snap Share | Routes Routes | Targets Targets | Receptions Receptions | Receiving Yards Receiving Yards | Fantasy Points Fantasy Points |
---|---|---|---|---|---|---|---|---|
1 | SF | Richard Sherman | 88.2% | 32 | 6 | 3 (1 tds) | 43 | 14.1 (##32) |
2 | GB | Tramon Williams | 98.5% | 48 | 13 (1 rz) | 9 (2 tds) | 128 | 33.9 (##1) |
3 | BUF | Tre'Davious White | 93.4% | 47 | 10 | 4 | 17 | 5.7 (##73) |
4 | LA | Sam Shields | 92.5% | 44 | 15 (1 rz) | 11 | 123 | 23.3 (##12) |
5 | PHI | Ronald Darby | 90.0% | 35 | 11 (2 rz) | 10 | 91 | 21.6 (##8) |
6 | ARI | Patrick Peterson | 100.0% | 33 | 5 | 3 | 33 | 7.2 (##62) |
7 | NYJ | Morris Claiborne | 98.4% | 37 | 14 (2 rz) | 8 | 33 | 10.6 (##39) |
8 | NO | Marshon Lattimore | 96.8% | 37 | 11 (2 rz) | 10 (1 tds) | 119 | 27.9 (##5) |
11 | CHI | Kyle Fuller | 100.0% | 41 | 18 (2 rz) | 13 (1 tds) | 126 | 31.6 (##4) |
12 | GB | Josh Jackson | 100.0% | 36 | 11 (2 rz) | 8 (1 tds) | 77 | 22.9 (##6) |
13 | NE | Stephon Gilmore | 80.7% | 34 | 5 (1 rz) | 5 | 49 | 9.9 (##42) |
14 | SEA | Shaquill Griffin | 90.7% | 30 | 6 | 4 | 76 | 12.1 (##32) |
15 | MIA | Minkah Fitzpatrick | 86.9% | 18 | 7 (2 rz) | 4 (1 tds) | 49 | 15.8 (##13) |
16 | DET | Darius Slay | 87.5% | 27 | 6 (1 rz) | 2 (1 tds) | 10 | 9.0 (##56) |
17 | CHI | Prince Amukamara | 100.0% | 32 | 10 (2 rz) | 8 (1 tds) | 47 | 18.7 (##15) |
Week Wk | Opponent Opp | Primary Corner Primary Corner | Snap Share Snap Share | Routes Routes | Targets Targets | Receptions Receptions | Receiving Yards Receiving Yards | Fantasy Points Fantasy Points |
---|---|---|---|---|---|---|---|---|
1 | NO | - | 93.5% | 28 | 8 (3 rz) | 7 (2 tds) | 93 | 27.7 (##2) |
2 | PIT | - | 100.0% | 38 | 6 | 2 | 27 | 5.1 (##73) |
3 | TB | - | 64.3% | 24 | 11 (2 rz) | 8 (2 tds) | 173 | 37.3 (##1) |
4 | DET | - | 88.5% | 28 | 7 | 5 | 98 | 14.8 (##19) |
5 | CHI | - | 82.5% | 31 | 4 | 1 | 4 | 1.4 (##98) |
8 | CLE | - | 79.2% | 41 | 6 | 4 | 27 | 6.6 (##41) |
10 | WAS | - | 81.7% | 26 | 5 (2 rz) | 4 (1 tds) | 78 | 17.8 (##16) |
11 | LA | - | 67.1% | 32 | 6 | 4 | 32 | 7.2 (##52) |
12 | DET | - | 88.7% | 28 | 7 (1 rz) | 5 | 66 | 12.5 (##28) |
13 | ATL | - | 72.1% | 24 | 5 | 2 | 32 | 5.7 (##58) |
14 | CAR | - | 100.0% | 42 | 10 (1 rz) | 6 | 64 | 12.4 (##33) |
15 | CIN | - | 71.2% | 20 | 6 (2 rz) | 5 (1 tds) | 30 | 14.7 (##28) |
16 | GB | - | 87.9% | 24 | 8 (2 rz) | 5 (1 tds) | 60 | 17.3 (##6) |
17 | CHI | - | 84.6% | 30 | 6 (1 rz) | 6 (1 tds) | 65 | 17.7 (##14) |
Week Wk | Opponent Opp | Primary Corner Primary Corner | Snap Share Snap Share | Routes Routes | Targets Targets | Receptions Receptions | Receiving Yards Receiving Yards | Fantasy Points Fantasy Points |
---|---|---|---|---|---|---|---|---|
1 | TEN | - | 91.8% | - | 9 (0 rz) | 7 | 103 | 17.2 (##17) |
2 | GB | - | 96.2% | - | 11 (2 rz) | 9 | 182 | 33.2 (##1) |
3 | CAR | - | 94.2% | - | 7 (0 rz) | 4 | 40 | 8.0 (##50) |
4 | NYG | - | 100.0% | - | 7 (0 rz) | 5 | 47 | 9.6 (##49) |
7 | PHI | - | 89.7% | - | 5 (1 rz) | 2 | 18 | 3.8 (##77) |
8 | CHI | - | 100.0% | - | 13 (0 rz) | 8 | 76 | 21.6 (##7) |
9 | DET | - | 87.7% | - | 14 (5 rz) | 13 | 80 | 22.2 (##9) |
10 | WAS | - | 83.6% | - | 15 (0 rz) | 13 | 164 | 29.4 (##4) |
11 | ARI | - | 82.7% | - | 7 (0 rz) | 6 | 37 | 9.7 (##39) |
13 | DAL | - | 87.9% | - | 8 (1 rz) | 8 | 59 | 13.9 (##24) |
14 | JAC | - | 60.3% | - | 5 (0 rz) | 3 | 55 | 8.5 (##49) |
15 | IND | - | 96.1% | - | 5 (0 rz) | 2 | 13 | 3.3 (##85) |
16 | GB | - | 81.4% | - | 6 (3 rz) | 4 | 29 | 12.9 (##35) |
Week Wk | Opponent Opp | Primary Corner Primary Corner | Snap Share Snap Share | Routes Routes | Targets Targets | Receptions Receptions | Receiving Yards Receiving Yards | Fantasy Points Fantasy Points |
---|---|---|---|---|---|---|---|---|
4 | DEN | - | 61.3% | - | 10 (2 rz) | 6 | 87 | 14.7 |
6 | KC | - | 86.4% | - | 9 (0 rz) | 7 | 129 | 19.9 |
7 | DET | - | 84.3% | - | 9 (1 rz) | 6 | 108 | 23.7 |
8 | CHI | - | 83.6% | - | 12 (0 rz) | 6 | 95 | 21.5 |
9 | STL | - | 72.6% | - | 5 (0 rz) | 3 | 42 | 7.2 |
10 | OAK | - | 76.4% | - | 2 (0 rz) | 2 | 46 | 7.6 |
11 | GB | - | 96.4% | - | 9 (0 rz) | 6 | 66 | 12.6 |
12 | ATL | - | 77.6% | - | 4 (1 rz) | 4 | 31 | 7.1 |
13 | SEA | - | 95.5% | - | 6 (0 rz) | 2 | 22 | 3.6 |
14 | ARI | - | 100.0% | - | 7 (2 rz) | 2 | 12 | 3.2 |
15 | CHI | - | 71.4% | - | 4 (1 rz) | 3 | 55 | 20.5 |
16 | NYG | - | 80.0% | - | 5 (1 rz) | 4 | 19 | 5.9 |
17 | GB | - | 73.9% | - | 2 (0 rz) | 1 | 8 | 1.8 |
Value Over Stream: Valuation scheme calculates a player’s fantasy pts/game over the average waiver wire replacement in standard fantasy league formats during either the current season (or previous year during the offseason) and adjusts for positional bust rates. VOS rank in parenthesis spans all positions, enabling player comparisons across QB's, RB's, WR's, and TE's.
Buffalo Bills wide receiver Stefon Diggs became the latest ...
Buffalo Bills wide receiver Stefon Diggs was held ...
Buffalo Bills wide receiver Stefon Diggs had three catches ...
Player Popularity Index (PPI) ranks PlayerProfiler page views over the last 30 days. For example, the No. 1 PPI player page is the most frequently visited page in recent weeks.
Year Year | Games Games | Receptions Recs | Receiving Yards Rec Yds | Target Share Tgt Share | Catch Rate Catch Rate | Special Teams Yards Special Teams | Age Age | School School |
---|---|---|---|---|---|---|---|---|
2012 | 11 (WR) | 54 (80 tgts) | 848 (15.7 ypr) | 26.4% | 67.5% | 934 (2 tds) | 18 | Maryland |
2013 | 7 (WR) | 34 (56 tgts) | 587 (17.3 ypr) | 13.5% | 60.7% | 280 | 19 | Maryland |
2014 | 10 (WR) | 62 (94 tgts) | 792 (12.8 ypr) | 22.5% | 66.0% | 478 | 20 | Maryland |
Stefon Diggs was drafted by the Minnesota Vikings in the fifth round. Stefon Diggs' impact was instant in his first season with the team. Despite being inactive for the first three games of the season, he still led the team in receptions and receiving yards, earned a 22% target share, and was nominated to the Pro Football Writers of America’s All Rookie Team. His numbers continued to climb in his second and third season, establishing himself as a top wide receiver in the NFL. In the 2017 NFC Divisional round of the playoffs, he exploded for 137 receiving yards, including a 61-yard touchdown as time expired, the play was dubbed the “Minneapolis Miracle.”
Following the 2017 season, Diggs signed a 5-year, $72 million contract and finished the season with 102 catches, for 1,021 yards. He had over 1,000 yards in the 2019 season and was number five in the NFL in Deep Ball Targets. Just before the 2020 NFL Draft, the Vikings traded Diggs away to the Buffalo Bills in exchange for a first-round pick, and fifth and sixth round picks. Diggs quickly formed a connection with Bills quarterback Josh Allen and had his best season yet, finishing the season first in receptions (127), first in receiving yards (1,535), and averaging 20.5 fantasy points per game. He received his first trip to the Pro Bowl, and was also nominated First-Team All Pro. The Bills would be led by the Diggs-Allen Connection all the way to the AFC Championship where they would fall to the Kansas City Chiefs.
In 2021, Diggs had 1,225 receiving yards, and a career high 10 touchdowns. He finished the year with the fantasy ranking of WR 7 and has had only ten drops in the last two seasons with Buffalo. His elite talent paired with Josh Allen at quarterback has proven to be an elite combination as he had finished top five in the NFL in air yards in both of his seasons with Buffalo. Diggs had an ADP of 1.11, and while it may drop some, its unlikely to see his ADP drop much as long as he is catching passes from Josh Allen.