
Player variance is the hidden force behind the most memorable and miserable fantasy football weeks of your life.
Tyler Lockett blessed you with 50 points against the Arizona Cardinals in Week 7 last year, and then followed it up with a seven-point dud in Week 8 against the San Francisco 49ers. Variance and uncertainty make fantasy football the Herculean challenge it is to all of us; no matter how smart our processes are, the dice don’t always roll our way.
We’re in draft season right now, where projections are tidy and players are clearly in an established hierarchy. Every year, fantasy football seems to make so much sense when we draft. Then Week 1 comes along. Our expectations shatter as the real NFL season leaves our players vulnerable to that all-powerful, fundamental force that mocks and humbles our abilities to predict and project player outcomes: variance.
I will dive into variance across positions with an emphasis on running backs and wide receivers, answering three main questions:
-
1) Is variance a sticky and sustainable attribute from year to year for any given player?
-
2) How do different positions experience variance differently?
-
3) Who are the types of players that have a high-variance, week-winning upside profile to target at the end of best ball drafts?
Importantly, I am focusing on week-to-week variance in-season for players, i.e. Will Fuller scored 34 fantasy points the week prior, then only seven fantasy points in the current week. This is a fundamentally different type of variance than the uncertainty associated with a player’s preseason range of outcomes; i.e. Fuller could have anywhere from 450-1,100 receiving yards in 2021.
When I look at profiles of high-variance players, I am not looking at players whose forecasted week-to-week uncertainty stems from preseason ambiguity regarding their role. I am instead looking at player types who are consistently inconsistent on a week-by-week basis. A basic example of this would be Sammy Watkins the past two seasons on the Chiefs; we knew he was the team’s WR2 with a roughly 15.0-percent Target Share, yet we never knew which weeks would be the ones where he would record a massive performance.
Standard deviation is the traditional proxy for player variance in statistics; a useful tool that lets us understand the range of values a player will likely score in a given week.


What is Standard Deviation?
The standard deviation of a set of values can be used in conjunction with the average of that set of values in order to represent the bounds where roughly two thirds of the values will fall.
To put it into fantasy football terms, since Tyler Lockett averaged 16.6 Fantasy Points Per Game last season and had a standard deviation of 13.36 Fantasy Points Per Game, then we can roughly expect him to score between his average, plus or minus one standard deviation. This would put Lockett’s low-end expectation at about three fantasy points (16.6 – 13.36), and his high-end expectation in a given week at around 30 fantasy points (16.6 + 13.36). If you want to read more about standard deviation, check out PlayerProfiler’s Director of Analytics Josh Larky‘s breakdown in this thread.
Unfortunately, standard deviation isn’t a perfect statistic, and isn’t a suitable enough proxy for variance for this article’s purposes. Let’s see why.
We already mentioned how Lockett had that insane 50-point week followed by a series of underwhelming performances. His 2020 season was a classic profile of a high variance player, and his standard deviation was 13.36 fantasy points. Davante Adams last year was one of the best performing wide receivers ever in fantasy football and consistently turned in strong weeks all season. He had a standard deviation almost as high as Lockett’s, with 12.23 fantasy points.
Yet, this doesn’t really pass our sanity test. Adams felt like a much more consistent and reliable player than Lockett last season. So why are their standard deviations so similar?
The difference between the two players is in their Fantasy Points Per Game averages. Lockett averaged only 16.6 FPPG compared to Adams’ monstrous 25.6 FPPG. Lockett’s standard deviation is a huge portion of his average points per game. While Adams’ standard deviation, though similar to Lockett’s, represents a much smaller percentage of Adams’ average points per game. Despite their similar standard deviations, Lockett was a much higher-variance player than Adams when taking average PPG into account.
The coefficient of variance takes into account the average of a dataset to provide a more standardized measure of variance. This way, we can compare across datasets that are centered around different numbers.
In other words, it lets us compare the variance of two very different players on an equal playing field. The coefficient of variance is equal to the standard deviation of the data divided by the mean, or average, of the data.
Lockett’s coefficient of variation comes out to an absurdly high 0.8 (13.36 / 16.6). While Adams’ is a much smaller expected value of 0.47 (12.23 / 25.6). The coefficient of variation illustrates Lockett was the much higher-variance player last season. His his expected point totals were within 80-percent (0.8 coefficient of variation) of his points per game on either side. Adams’ expected point totals were within 47-percent (0.47 coefficient of variation) of his average points per game on either side.
Now that we understand the coefficient of variation, we can find out whether variance is a sticky player attribute. In other words, is a player’s variance in one year predictive of their variance in the following year? Is there such a thing as high-variance players and low-variance players? Or is season-long player variance just season-long statistical noise that results from the small sample size of the NFL season?
I graphed players’ coefficients of variance from one year to the next over the past 20 years to identify whether there was a correlation. In all of the following graphs and analyses, I eliminated small sample size players who were injured or didn’t have a role for much of the season in order to not have my data skewed by players who weren’t gracing our fantasy lineups anyways.
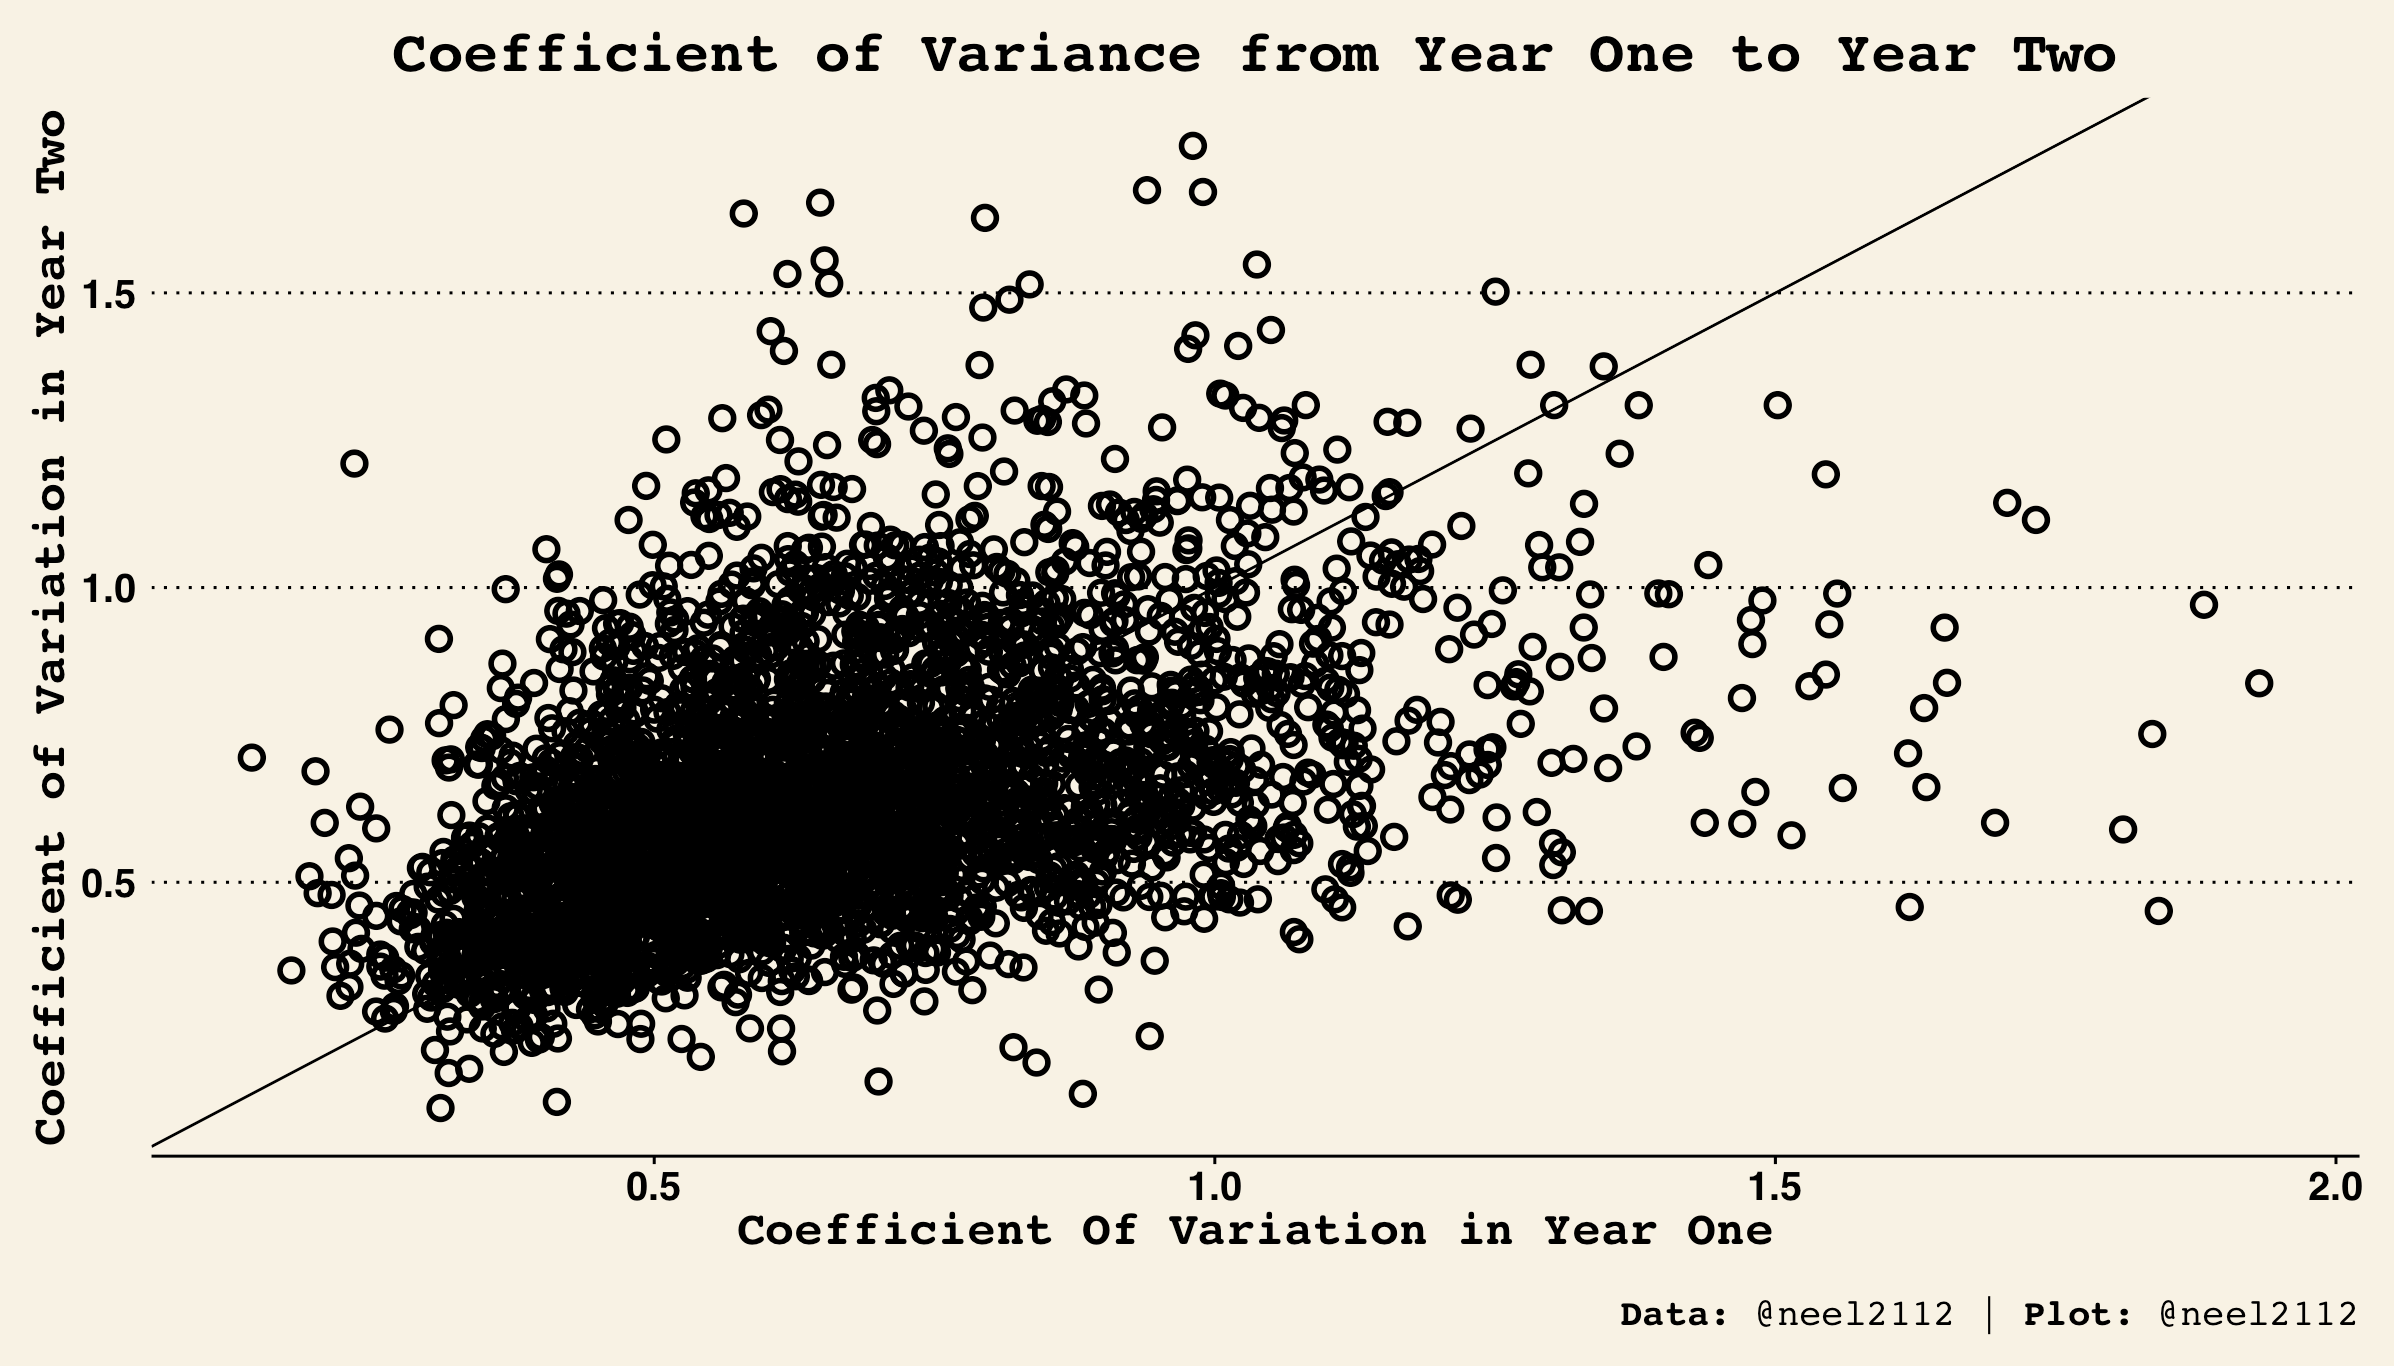
There is a very strong correlation between players’ coefficients of variation from one year to the next. The black line drawn straight through the heart of the data is a simple line of slope cutting through all the points where a player’s coefficient of variation in year one equaled their coefficient of variation in year two.
The approximate 45 degree angle of this slope indicates that players’ year two coefficients of variation are localized right around their prior season’s coefficient of variation. Variance is somewhat sticky; high variance players one year are usually high variance the next season, and vice-versa. So, who are these high variance players? Who are these low variance players?
Let’s break it down by position.
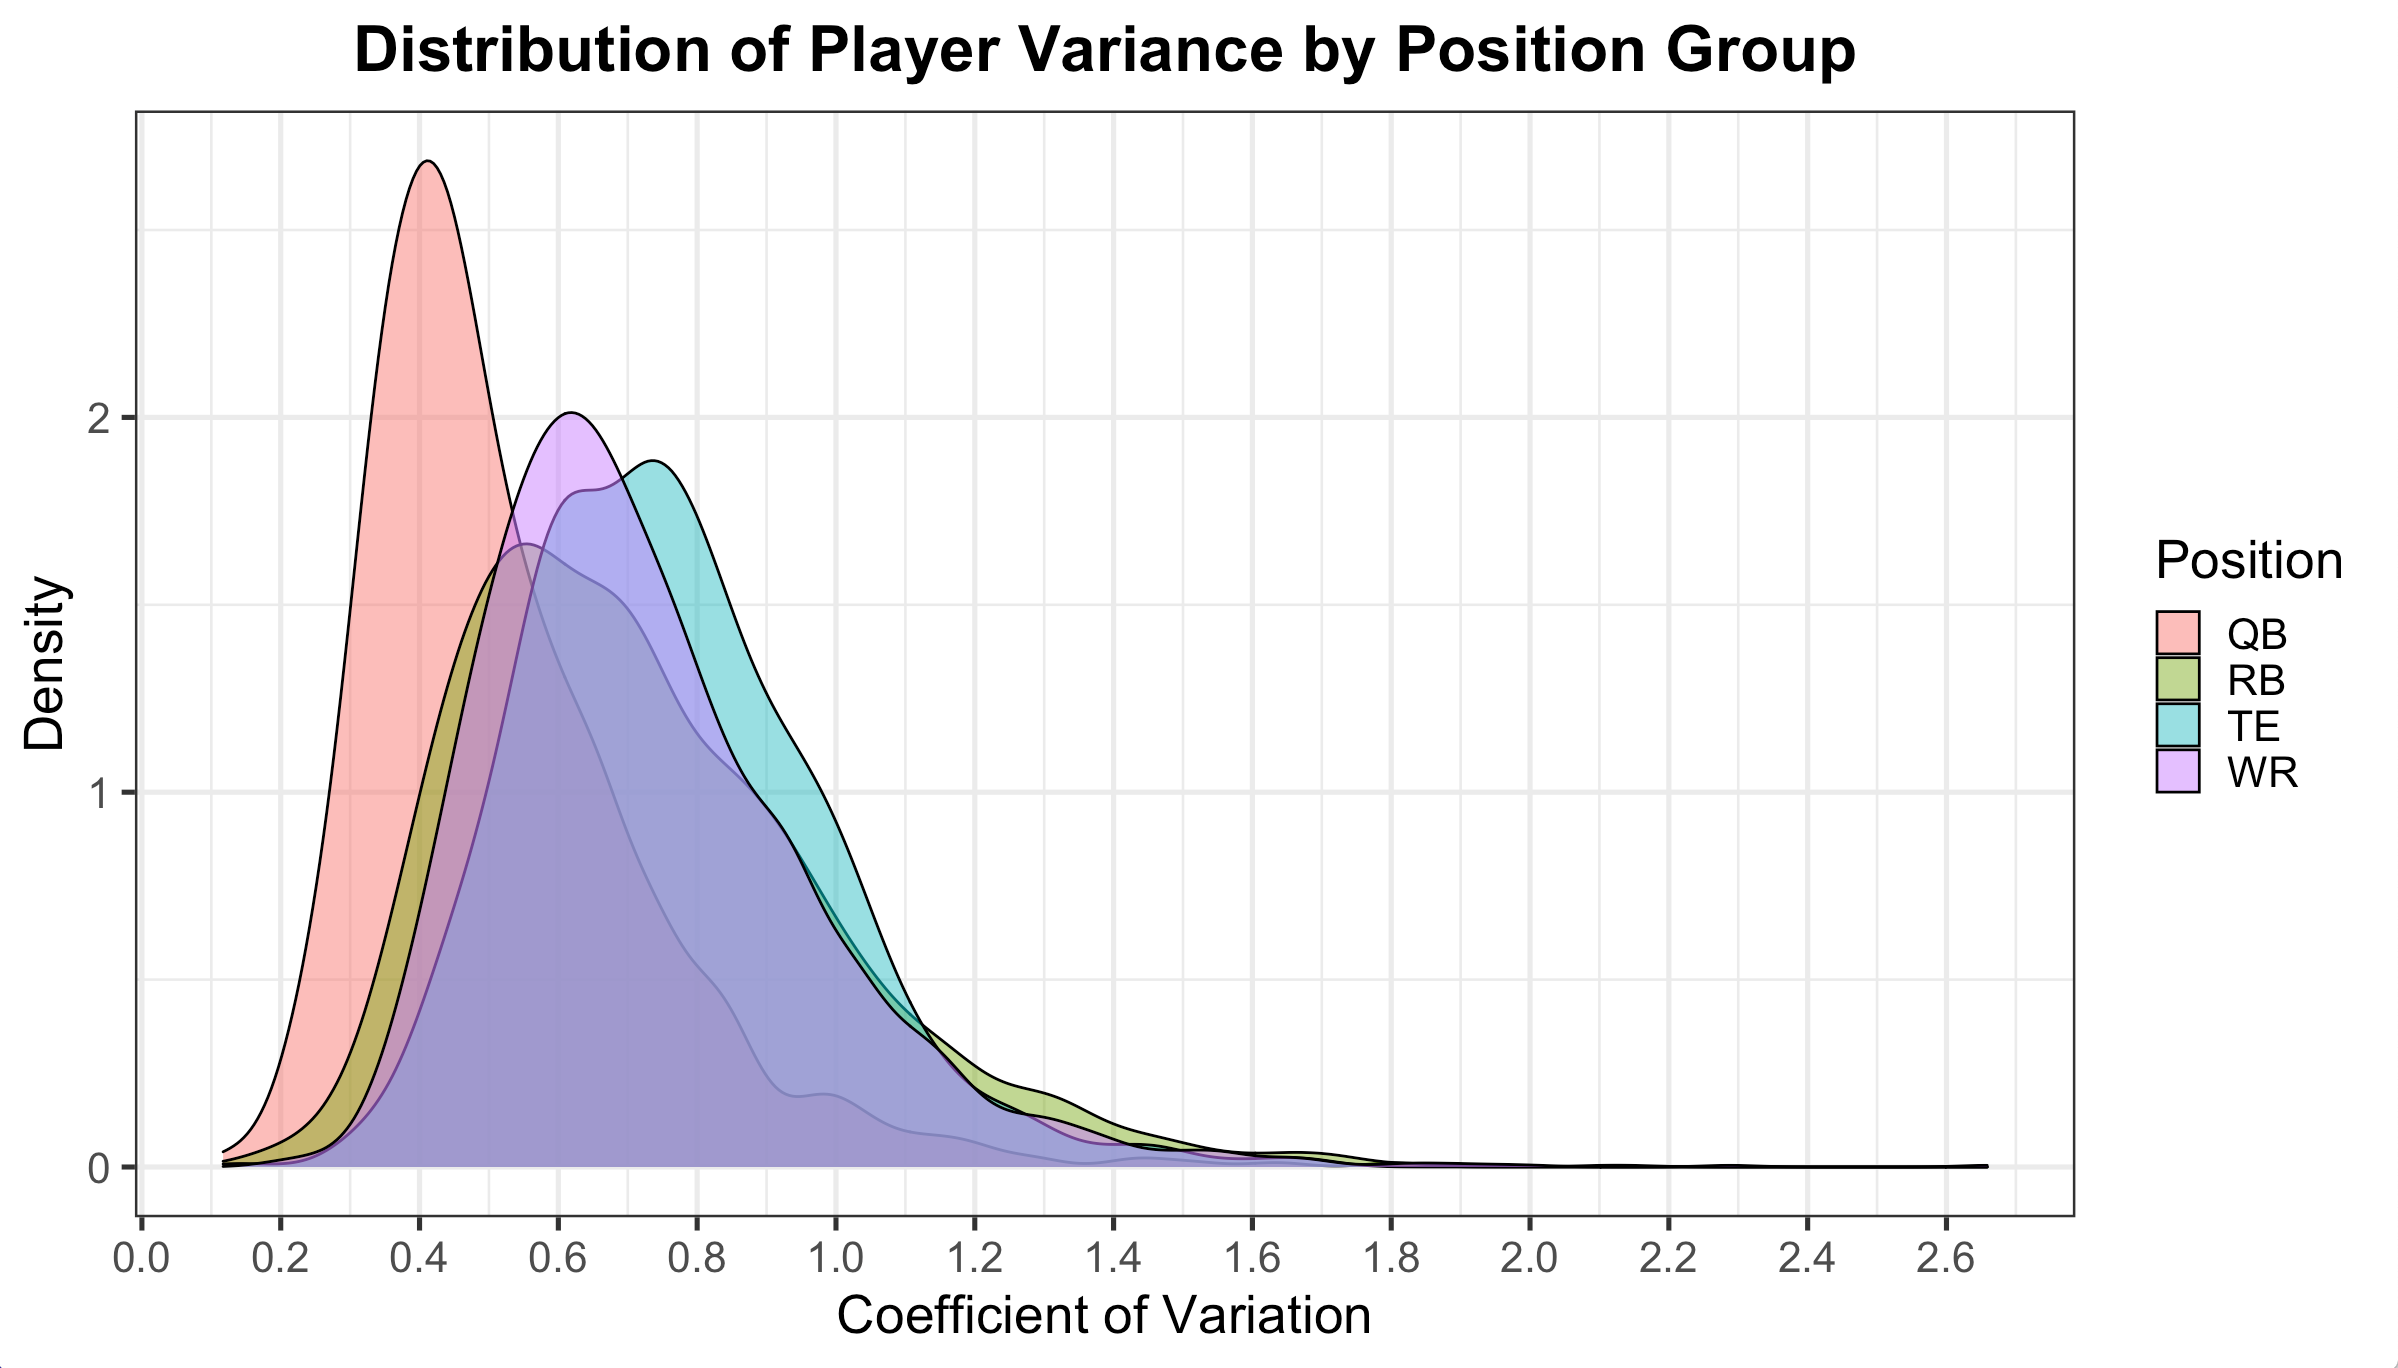
The above visual is a density graph that represents how each position group experiences variance differently. The x-axis represents the coefficient of variation and the y-axis represents how often players scored near that coefficient of variation. For example, look at how the pink QB curve peaks in height at about 0.4 on the x-axis. This means that it is most common for quarterbacks to have coefficients of variation in that range. RBs peak at about 0.5-0.6, WRs at about 0.6-0.7, and TEs at about 0.7-0.8.
While wide receivers (in purple), running backs (in green), and tight ends (in blue) have similar looking distributions of their position group spread across the coefficient of variance, quarterbacks (in pink) stand out as incredibly stable and lower variance. Quarterbacks’ average coefficients of variance are by far the lowest in our dataset. And there are rarely any quarterbacks that are truly higher-variance quarterbacks.
There are quite a few forces pushing quarterbacks towards their lower-variance profiles. Primarily, quarterbacks have an incredibly stable workload from week-to-week. They’re almost never game-scripted out the way RBs can be in losing situations, or WRs can in difficult CB matchups. Even if a quarterback is game-scripted out by the 4th quarter (think Lamar Jackson in 2019), it’s likely because they’ve already piled on a bunch of points in the game.
Quarterback ceiling is also managed and kept in check by the way most fantasy leagues are scored. Passing yards are worth very little from a points perspective. So even large differences in yardage totals from game to game are compressed in their effect on the quarterback’s final fantasy points score.
Instead, much of quarterback variance stems from touchdowns and rushing yardage, which are both more impactful than passing yards.
However, quarterbacks accumulate fewer of both these stats than passing yards. So week-to-week quarterback scoring fluctuations often are due to spikes in rushing and touchdowns.
Historically, in our dataset ranging from 2000-2020, conventional pocket passers with incredibly stable week-to-week scoring totals make up the majority. The higher-variance rushing yards and rushing touchdowns stats rarely came into play, easily making QB fantasy’s most stable position. The influx of mobile quarterbacks in the last few years has altered the scoring profile towards the higher-variance ground game; perhaps leading to a future where quarterback gets a bit closer to WR and RB in terms of positional variance.
RB, WR, and TE are where most of our high variance players come from. I’ll focus on RBs and WRs in this article because frankly, gamers are usually starting one TE every week. And there isn’t the luxury of having a decision-point regarding taking a higher-upside TE compared to a higher-floor TE. You just take what you can get and live with the results nearly every week.
I dove into profiles of high-variance wide receivers in 2020 and while there are some high-scoring outliers like Tyler Lockett, a majority of high-variance receivers have a points per game number below 10 and are not traditionally featured wide receivers.

Scott Miller, Marquez Valdes-Scantling, David Moore, Mecole Hardman are your 2020 variance wide receivers kings with over a 0.8 coefficient of variance. Who are they?
These are tertiary options on prolific aerial attacks. Every single one of these players averaged between six and eight PPR Fantasy Points Per Game throughout the season, and each and every one of them had at least one high-scoring breakout week where they finished in the top-15 at their position. These are low Target Share players who are thrown the ball downfield. These receivers have speed to burn, with above-average 40-yard dash times for the position.
If I’m in the final few rounds of a best ball draft looking at wide receivers with projections of six-to-eight points per game over the course of the season, I’m taking guys like these. Speed guys on high-volume aerial attacks who just need the right cornerback matchup to get one deep lineup-making touchdown. Last year, the players who had a similar Fantasy Points Per Game average but a much lower coefficient of variance were WRs like Golden Tate and Larry Fitzgerald. Obviously they’re tertiary options. But they’re also older players who are either on anemic offenses (Tate), or lack the burst they once had (Fitzgerald).
In non-best ball formats though, you’ll never realistically be able to guess when a player like Hardman will pop. In his one or two weeks of relevance, he will likely be wasting away on your bench.
High-variance players hit their ceiling once or twice a season. And playing a below average player for the chance at upside is almost never the correct move in traditional formats. Especially once we start looking at higher-profile wide receivers.
If we restrict our sample to players who averaged over 11 fantasy points in 2020, variance starts to become a much more compressed stat. And there seems to be very little edge in sacrificing average points per game for a bit more upside. In that 10-13 Fantasy Points Per Game slot at wide receiver, where conceivably you could be choosing between a couple of players on your team, the coefficient of variance doesn’t vary much (haha I know).
The lowest variance player in our sample here is Jarvis Landry with a 0.5 coefficient of variance, while our highest variance player is Michael Gallup with a 0.75 coefficient of variance. While Gallup does check all the boxes we’re looking for (a secondary threat in a dynamic offense), his average points per game deficit of 20-percent versus Landry more or less nullifies his increased volatility.
Higher-volume wide receivers are inherently a lot more stable than lower-volume receivers. And there aren’t significant enough edges from a player profile standpoint to be found over the course of a season. While you may be going up against the league leader in points scored in round one of your playoff matchup, don’t look to player profiles as an indicator of where the upside lies at your WR2 spot to pull off an upset.
Running back variance is fundamentally different from wide receiver variance in that it is often a direct property of workload, rather than a potential WR-CB matchup or other factor unrelated to workload.
The high-variance running backs are players that, for reasons like injury or coaching decisions, have their workload radically expanded or reduced throughout the course of the season.In 2020, these were running backs like Tony Pollard, Alexander Mattison, Darrell Henderson, and Boston Scott. There’s not much to say about players like these; their breakout weeks are directly tied to variables outside of their player profile. And the fantasy industry is already good at recognizing how teams’ backup RB projections change when the starter is out.
While the high variance wide receiver is a real player profile that’s directly identifiable as lower-volume explosive players in prolific passing attacks, there is no such analog at the RB position.
Play your best running backs every week. And don’t look to certain types of running backs as having week-winning upside that other types don’t. A ground and pound running back like Nick Chubb, with not much work in the passing game, has an identical coefficient of variance to players like Dalvin Cook and Austin Ekeler, who are used more in the passing game. Even when comparing committee backs to each other, a satellite back like Nyheim Hines has an identical coefficient of variance to players like Gus Edwards and J.K. Dobbins, who almost exclusively touch the ball through the running game. At running back, variance is organized almost exclusively by usage, and similarly scoring players have closely comparable coefficients of variance.
To clarify, I am looking purely at week-to-week variance for players with similar per-game scoring averages. Players involved in the pass-catching game have both more seasonal league upside and higher floors than players who aren’t; however, since I am controlling for average Fantasy Points Per Game during the season by comparing similarly scoring players, I have already pre-selected for players that score similarly, regardless of their player type.
So when can we exploit player variance to gain an edge against our opponents?
Unfortunately, not often in traditional redraft leagues with head-to-head lineup setting. Don’t bank your hopes on a receiver like Scott Miller in your flex hitting his rare upside to win your week, or in any perceived running back who you believe has an “inherently higher upside” than a higher-scoring peer. Those players don’t exist, at least not from a player profile perspective.
Matchup variables are the place to look when identifying potential boom weeks for lower-scoring players.
In deep best ball leagues, however, wide receiver where variance becomes a real differentiator between similarly scoring players; specifically on the lower end of the spectrum. Go for explosive depth receivers in offenses that produce an abundance of fantasy points through the air. Players like these don’t need an injury to a player above them on the depth chart to hit their theoretical upside. Field-stretching wide receivers have a chance to enter your lineup twice a season and return value at their ADP.

