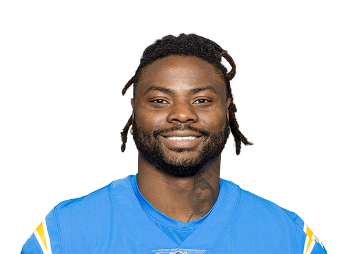
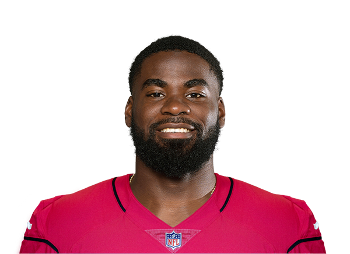
J.K. Dobbins, Gus Edwards Have A Chance To Be Ready
Baltimore Ravens head coach John Harbaugh said it's too ...
Year Year | Games Played Games | Rush Attempts Atts | Rush Yards Rush Yds | Yards Per Carry YPC | Receptions Rec | Receiving Yards Rec Yds | Total Touchdowns TD | Fantasy Points Per Game Fantasy Pts/Game |
---|---|---|---|---|---|---|---|---|
2020 | 16 | 144 | 723 | 5.0 | 9 | 129 | 6 | 8.0 (#45) |
2019 | 16 | 133 | 711 | 5.3 | 7 | 45 | 2 | 5.8 (#60) |
2018 | 11 | 137 | 718 | 5.2 | 2 | 20 | 2 | 8.0 (#47) |
Snap Share | Opportunity Share | Weighted Opportunities | Team Run Plays Per Game Team Run Plays/Gm | Carries | Targets | Red Zone Touches |
---|---|---|---|---|---|---|
33.5% | 38.1% | 106.8 (6.7 p/g) | 34.7 (1.77 pace) | 144 (9.0 p/g) | 13 (0.8 p/g) | 27 (8 gl) |
#55 | #46 | #48 | #1 | #28 | #78 | #31 |
Rushing Yards | Receiving Yards | Receptions | Total TDs | Fantasy Points Per Opportunity Fantasy Pts/Opportunity | Fantasy Points Per Game | Expected Fantasy Points Per Game Expected Fantasy Pts/Gm |
---|---|---|---|---|---|---|
723 (45.2 p/g) | 129 (8.1 p/g) | 9 (0.6 p/g) | 6 (3.9% rate) | 0.82 | 8.0 (+1.13) | 7.0 (+1.13diff) |
#19 | #53 | #79 | #25 | #38 | #45 | #55 |
Target Share | Routes Run | Route Participation Route % | Yards Per Reception | Yards Per Route Run | Catch Rate Catch Rate | Drops |
---|---|---|---|---|---|---|
3.4% | 78 (4.9 p/g) | 19.3% | 14.3 (9.9 ypt) | 1.65 | 69.2% | 0 (0.0% rate) |
- | #74 | - | - | - | - | #80 |
True Yards Per Carry | Yards Per Touch | Juke Rate | Evaded Tackles | Breakaway Run Rate | Breakaway Runs | Best Ball Points Added |
---|---|---|---|---|---|---|
4.8 (5.0 ypc) | 5.6 | 18.3% | 28 (1.8 p/g) | 6.3% | 9 (0.6 p/g) | 32.1 (2.01 p/g) |
#7 | #12 | #38 | #32 | - | #7 | #50 |
Yards Created | Yards Created Per Touch Yards Created/Touch | Production Premium | Expected Points Added (EPA) Expected Pts Added | Dominator Rating | Game Script | Run Blocking Rating |
---|---|---|---|---|---|---|
295 (18.4 p/g) | 1.93 | -4.6 | +16.6 | 13.2% | +6.62 | 74.0 |
#48 | #54 | #90 | #7 | #40 | #1 | #2 |
Average Defenders In The Box Defenders In The Box | Stacked Front Carry Rate Stacked Front Carry % | Base Front Carry Rate Base Front Carry % | Light Front Carry Rate Light Front Carry % | Shotgun Carry Rate Shotgun Carry % | Under Center Carry Rate Under Center Carry % | Stuffed Runs |
---|---|---|---|---|---|---|
7.3 | 33.3% (5.8 ypc) | 51.4% (5.1 ypc) | 15.3% (3.1 ypc) | 93.1% (5.3 ypc) | 6.9% (1.8 ypc) | 19 (13.2% rate) |
#4 | #9 | #5 | #60 | #2 | #81 | #39 |
Snap Share | Opportunity Share | Weighted Opportunities | Team Run Plays Per Game Team Run Plays/Gm | Carries | Targets | Red Zone Touches |
---|---|---|---|---|---|---|
34.1% | 30.9% | 92.4 (5.8 p/g) | 37.2 (1.99 pace) | 133 (8.3 p/g) | 8 (0.5 p/g) | 24 (5 gl) |
#57 | #57 | #52 | #1 | #33 | #94 | #33 |
Rushing Yards | Receiving Yards | Receptions | Total TDs | Fantasy Points Per Opportunity Fantasy Pts/Opportunity | Fantasy Points Per Game | Expected Fantasy Points Per Game Expected Fantasy Pts/Gm |
---|---|---|---|---|---|---|
711 (44.4 p/g) | 45 (2.8 p/g) | 7 (0.4 p/g) | 2 (1.4% rate) | 0.66 | 5.8 | - |
#27 | #93 | #85 | #61 | #102 | #60 | - |
Target Share | Routes Run | Route Participation Route % | Yards Per Reception | Yards Per Route Run | Catch Rate Catch Rate | Drops |
---|---|---|---|---|---|---|
1.9% | 87 (5.4 p/g) | 19.8% | 6.4 (5.6 ypt) | 0.52 | 87.5% | 0 (0.0% rate) |
- | #51 | - | - | - | - | #91 |
True Yards Per Carry | Yards Per Touch | Juke Rate | Evaded Tackles | Breakaway Run Rate | Breakaway Runs | Best Ball Points Added |
---|---|---|---|---|---|---|
5.0 (5.3 ypc) | 5.4 | 29.3% | 41 (2.6 p/g) | 3.8% | 5 (0.3 p/g) | 13.7 (0.90 p/g) |
#3 | #13 | #9 | #28 | #28 | #34 | #64 |
Yards Created | Yards Created Per Touch Yards Created/Touch | Production Premium | Expected Points Added (EPA) Expected Pts Added | Dominator Rating | Game Script | Run Blocking Rating |
---|---|---|---|---|---|---|
197 (12.3 p/g) | 1.41 | -10.3 | +19.2 | 7.4% | +7.39 | 94.3 |
#32 | #23 | #52 | #9 | #80 | #1 | #3 |
Average Defenders In The Box Defenders In The Box | Stacked Front Carry Rate Stacked Front Carry % | Base Front Carry Rate Base Front Carry % | Light Front Carry Rate Light Front Carry % | Shotgun Carry Rate Shotgun Carry % | Under Center Carry Rate Under Center Carry % | Stuffed Runs |
---|---|---|---|---|---|---|
6.4 | 16.5% (4.3 ypc) | 26.3% (6.0 ypc) | 56.4% (5.4 ypc) | 94.0% (5.6 ypc) | 5.3% (1.0 ypc) | 16 (12.0% rate) |
#56 | #32 | #103 | #11 | #2 | #57 | #49 |
Snap Share | Opportunity Share | Weighted Opportunities | Team Run Plays Per Game Team Run Plays/Gm | Carries | Targets | Red Zone Touches |
---|---|---|---|---|---|---|
38.8% | 44.6% | 85.3 (7.8 p/g) | - (2.28 pace) | 137 (12.5 p/g) | 2 (0.2 p/g) | 16 (0 gl) |
#54 | #36 | #61 | - | #33 | #126 | #50 |
Rushing Yards | Receiving Yards | Receptions | Total TDs | Fantasy Points Per Opportunity Fantasy Pts/Opportunity | Fantasy Points Per Game | Expected Fantasy Points Per Game Expected Fantasy Pts/Gm |
---|---|---|---|---|---|---|
718 (65.3 p/g) | 20 (1.8 p/g) | 2 (0.2 p/g) | 2 (1.4% rate) | 0.63 | 8.0 | - |
#26 | #114 | #118 | #61 | #102 | #47 | - |
Target Share | Routes Run | Route Participation Route % | Yards Per Reception | Yards Per Route Run | Catch Rate Catch Rate | Drops |
---|---|---|---|---|---|---|
0.6% | 22 (2.0 p/g) | 6.8% | 10.0 (10.0 ypt) | 0.91 | 100.0% | 0 (0.0% rate) |
- | #95 | - | - | - | - | #82 |
True Yards Per Carry | Yards Per Touch | Juke Rate | Evaded Tackles | Breakaway Run Rate | Breakaway Runs | Best Ball Points Added |
---|---|---|---|---|---|---|
5.0 (5.2 ypc) | 5.3 | 14.4% | 20 (1.8 p/g) | 5.1% | 7 (0.6 p/g) | 21.2 (1.90 p/g) |
#5 | #21 | #56 | #59 | #23 | #26 | #54 |
Yards Created | Yards Created Per Touch Yards Created/Touch | Production Premium | Expected Points Added (EPA) Expected Pts Added | Dominator Rating | Game Script | Run Blocking Rating |
---|---|---|---|---|---|---|
124 (11.3 p/g) | 0.89 | -20.2 | - | 13.4% | +2.14 | - |
#53 | #48 | #66 | - | #50 | #5 | - |
Average Defenders In The Box Defenders In The Box | Stacked Front Carry Rate Stacked Front Carry % | Base Front Carry Rate Base Front Carry % | Light Front Carry Rate Light Front Carry % | Shotgun Carry Rate Shotgun Carry % | Under Center Carry Rate Under Center Carry % | Stuffed Runs |
---|---|---|---|---|---|---|
6.9 | 24.1% (4.1 ypc) | 41.6% (5.1 ypc) | 35.0% (6.1 ypc) | 88.3% (5.5 ypc) | 12.4% (3.4 ypc) | 10 (7.3% rate) |
#23 | #23 | #59 | #31 | #1 | #60 | #58 |
Week Wk | Opponent Opp | Snap Share Snap Share | Carries Carries | Routes Routes | Targets Targets | Receptions Receptions | Total Yards Total Yards | Total TDs Total TDs | Fantasy Points Fantasy Points |
---|---|---|---|---|---|---|---|---|---|
1 | CLE | 25.4% | 4 (0 rz) | 1 | 0 | 0 | 17 | 0 | 1.7 (#74) |
2 | HOU | 26.2% | 10 (1 rz) | 1 | 0 | 0 | 73 | 0 | 7.3 (#41) |
3 | KC | 24.5% | 4 (0 rz) | 1 | 0 | 0 | 39 | 0 | 3.9 (#55) |
4 | WAS | 41.8% | 9 (0 rz) | 4 | 0 | 0 | 38 | 0 | 3.8 (#54) |
5 | CIN | 37.7% | 7 (0 rz) | 15 | 3 | 0 | 25 | 0 | 2.5 (#52) |
6 | PHI | 44.8% | 14 (2 rz) | 8 | 0 | 0 | 26 | 1 | 8.6 (#29) |
8 | PIT | 32.1% | 16 (2 rz) | 6 | 1 | 0 | 87 | 1 | 14.7 (#14) |
9 | IND | 36.5% | 11 (5 rz) | 7 | 2 | 2 | 34 | 1 | 9.4 (#27) |
10 | NE | 23.4% | 7 (1 rz) | 5 | 1 | 1 | 73 | 0 | 8.3 (#31) |
11 | TEN | 17.2% | 3 (1 rz) | 3 | 0 | 0 | 6 | 0 | 0.6 (#63) |
12 | PIT | 46.9% | 9 (2 rz) | 3 | 0 | 0 | 10 | 1 | 7.0 (#33) |
13 | DAL | 33.3% | 7 (1 rz) | 5 | 0 | 0 | 101 | 0 | 10.1 (#27) |
14 | CLE | 29.3% | 7 (2 rz) | 5 | 1 | 1 | 53 | 2 | 18.3 (#13) |
15 | JAX | 39.1% | 9 (2 rz) | 5 | 2 | 2 | 78 | 0 | 9.8 (#31) |
16 | NYG | 52.9% | 15 (6 rz) | 5 | 2 | 2 | 122 | 0 | 14.2 (#18) |
17 | CIN | 26.0% | 12 (1 rz) | 4 | 1 | 1 | 70 | 0 | 8.0 (#42) |
Week Wk | Opponent Opp | Snap Share Snap Share | Carries Carries | Routes Routes | Targets Targets | Receptions Receptions | Total Yards Total Yards | Total TDs Total TDs | Fantasy Points Fantasy Points |
---|---|---|---|---|---|---|---|---|---|
1 | MIA | 38.9% | 17 (7 rz) | 3 | 0 | 0 | 56 | 0 | 5.6 (##47) |
2 | ARI | 20.0% | 3 (1 rz) | 2 | 0 | 0 | 11 | 0 | 1.1 (##75) |
3 | KC | 24.0% | 7 (0 rz) | 6 | 2 | 2 | 68 | 0 | 8.8 (##34) |
4 | CLE | 25.4% | 6 (1 rz) | 4 | 1 | 1 | 36 | 0 | 4.6 (##50) |
5 | PIT | 25.0% | 5 (1 rz) | 4 | 1 | 1 | 23 | 0 | 3.3 (##57) |
6 | CIN | 34.2% | 6 (3 rz) | 6 | 0 | 0 | 34 | 0 | 3.4 (##52) |
7 | SEA | 34.5% | 8 (1 rz) | 7 | 0 | 0 | 35 | 0 | 3.5 (##46) |
9 | NE | 31.2% | 7 (2 rz) | 5 | 0 | 0 | 27 | 1 | 8.7 (##33) |
10 | CIN | 31.1% | 4 (0 rz) | 3 | 0 | 0 | 17 | 0 | 1.7 (##50) |
11 | HOU | 36.5% | 8 (0 rz) | 8 | 0 | 0 | 112 | 1 | 17.2 (##9) |
12 | LA | 36.6% | 14 (4 rz) | 6 | 0 | 0 | 55 | 0 | 5.5 (##37) |
13 | SF | 39.3% | 6 (0 rz) | 10 | 1 | 1 | 22 | 0 | 3.2 (##58) |
14 | BUF | 29.3% | 4 (2 rz) | 8 | 0 | 0 | 20 | 0 | 2.0 (##68) |
15 | NYJ | 31.6% | 5 (0 rz) | 6 | 0 | 0 | 35 | 0 | 3.5 (##60) |
16 | CLE | 39.4% | 12 (1 rz) | 5 | 1 | 1 | 73 | 0 | 8.3 (##34) |
17 | PIT | 69.2% | 21 (0 rz) | 4 | 2 | 1 | 132 | 0 | 12.2 (##25) |
Week Wk | Opponent Opp | Snap Share Snap Share | Carries Carries | Routes Routes | Targets Targets | Receptions Receptions | Total Yards Total Yards | Total TDs Total TDs | Fantasy Points Fantasy Points |
---|---|---|---|---|---|---|---|---|---|
6 | TEN | 18.1% | 10 (0 rz) | 0 | 0 | 0 | 42 | 0 | 4.2 (##48) |
7 | NO | 11.1% | 2 (0 rz) | 2 | 0 | 0 | 0 | 0 | 0.0 (##72) |
8 | CAR | 12.9% | 2 (0 rz) | 4 | 1 | 1 | 19 | 0 | 2.9 (##48) |
9 | PIT | 3.7% | 1 (0 rz) | 0 | 0 | 0 | 10 | 0 | 1.0 (##63) |
11 | CIN | 65.8% | 17 (2 rz) | 2 | 0 | 0 | 115 | 1 | 17.5 (##12) |
12 | OAK | 63.2% | 23 (5 rz) | 4 | 0 | 0 | 118 | 0 | 11.8 (##23) |
13 | ATL | 52.0% | 21 (0 rz) | 1 | 0 | 0 | 82 | 0 | 8.2 (##40) |
14 | KC | 50.8% | 16 (3 rz) | 2 | 0 | 0 | 67 | 0 | 6.7 (##39) |
15 | TB | 47.2% | 19 (3 rz) | 1 | 0 | 0 | 104 | 1 | 16.4 (##19) |
16 | LAC | 40.4% | 14 (2 rz) | 1 | 1 | 1 | 105 | 0 | 11.5 (##29) |
17 | CLE | 47.9% | 12 (1 rz) | 5 | 0 | 0 | 76 | 0 | 7.6 (##37) |
Baltimore Ravens head coach John Harbaugh said it's too ...
Baltimore Ravens running backs J.K. Dobbins (knee) and Gus...
Baltimore Ravens head coach John Harbaugh said that running ...
Player Popularity Index (PPI) ranks PlayerProfiler page views over the last 30 days. For example, the No. 1 PPI player page is the most frequently visited page in recent weeks.
Year Year | Games Games | Rush Attempts Rush Atts | Rushing Yards Rush Yrds | Total Touchdowns TDs | Receptions Rec | Receiving Yards Rec Yrds | Target Share Tgt Share | Age Age | School School |
---|---|---|---|---|---|---|---|---|---|
2013 | 9 (RB) | 66 | 338 (5 tds) | 5 | 0 | 0 | - | 18 | Miami |
2014 | 10 (RB) | 61 | 349 (6 tds) | 6 | 2 (3 tgts) | 44 | 0.8% | 19 | Miami |
2015 | 0 (RB) | 0 | 0 | 0 | 0 | 0 | - | 20 | Miami |
2016 | 10 (RB) | 59 | 290 (1 tds) | 1 | 1 (3 tgts) | 9 | 0.7% | 21 | Miami |
2017 | 12 (RB) | 164 | 713 (6 tds) | 7 | 13 (18 tgts) | 103 | 6.6% | 22 | Rutgers |
After going undrafted, Gus Edwards found a landing spot afterward with the Baltimore Ravens as an unstaffed free agent. He was waived during roster cutdowns in training camp but reverted to Baltimore’s practice squad after going unclaimed on waivers. He did not play a snap in Baltimore's first five games of the 2018 season but eventually got his chance in Week 6. Edwards took off in Week 11 of that season, which coincided with the Ravens’ decision to transition to Lamar Jackson at quarterback. Edwards showed he was not just a capable NFL running back, but a great fit as Lamar Jackson's running mate. In Baltimore’s final seven games that season, Edwards flashed his 4.57 40-yard dash speed and 105 speed score, totaling 654 yards on the ground and scored twice while churning off a robust 5.3 yards per clip. He averaged 11.6 fantasy points per game as a starter to end Baltimore's 2018 season, a mark that would've placed him as the RB22 on a per-game basis.
In that stretch, Gus Edwards cemented his place as an NFL running back. Edwards has averaged 5.2 yards per carry in his three NFL seasons. The Ravens took notice of Edwards' success in training camp of the 2021 season, rewarding him with a two-year contract extension worth $9 million that guaranteed him $3.75 million. Edwards was lucky to secure the bag when he did. Days after starter JK Dobbins tore his ACL, Edwards, unfortunately, followed suit. He was forced to miss the season along with Dobbins. He likely would've beat his ADP of the RB29 should he have gotten the chance. Hopefully, Edwards makes use of the extended rehab time to hit the ground running in 2022.