
For any and all of you who aren’t Best Ball purists yet, the hardest decisions in fantasy football are made week-to-week.
Should I start a running-back or wide-receiver in my flex? Will Wayne Gallman or Mike Davis continue to produce above expectations in the upcoming week?
At quarterback specifically, if you don’t have a Patrick Mahomes or Russell Wilson–type player that you lock and load each week, often you are making weekly decisions between two uninspiring quarterback options.
Maybe you have to choose between Teddy Bridgewater and Kirk Cousins. Perhaps it’s between Tyrod Taylor and Jimmy Garoppolo. Daniel Jones or Sam Darnold??? These are tough and often impactful choices that determine the final outcome of the week.
When deciding on a quarterback, weekly projections are often used to identify the player likely to perform better. Importantly however, projections do not account for the variance in a quarterback’s profile, and are inherently conservative and reluctant in projecting outlier games.


Here’s a basic example to make this concept easy to understand. Say the standard deviation, or variance, of Mahomes’ weekly projections is two fantasy points. Essentially, Mahomes is projected within around two fantasy points every single week, regardless of opponent. Maybe against the Falcons he’s projected for 25 fantasy points, and against the Ravens he’s projected for 23 fantasy points.
Mahomes’ actual fantasy point output is likely to be much more varied week-to-week though. While you would never project him to have 12 fantasy points, or 37 fantasy points, he did actually score 12 fantasy points in Week 7 against Denver and 37 fantasy points in Week 8 against the Jets.
You would be hard pressed to find a projections service that “knew” Mahomes was going to score 12 fantasy points one week and 37 fantasy points the week after; most likely, he was projected around 25 fantasy points in both matchups.
In the below graph, each dot represents an individual quarterback in a specific season between 2013-2020. Where each dot falls along the x-axis tells us how varied a quarterback’s projections were in a single season. And where the dot falls along the y-axis indicates how varied a quarterback’s actual points were in a single season. For the Mahomes example, if his 2020 projections varied by two fantasy points on average, but his 2020 actual fantasy points varied by seven on average, then Mahomes would have a dot at (x=2, y=7).
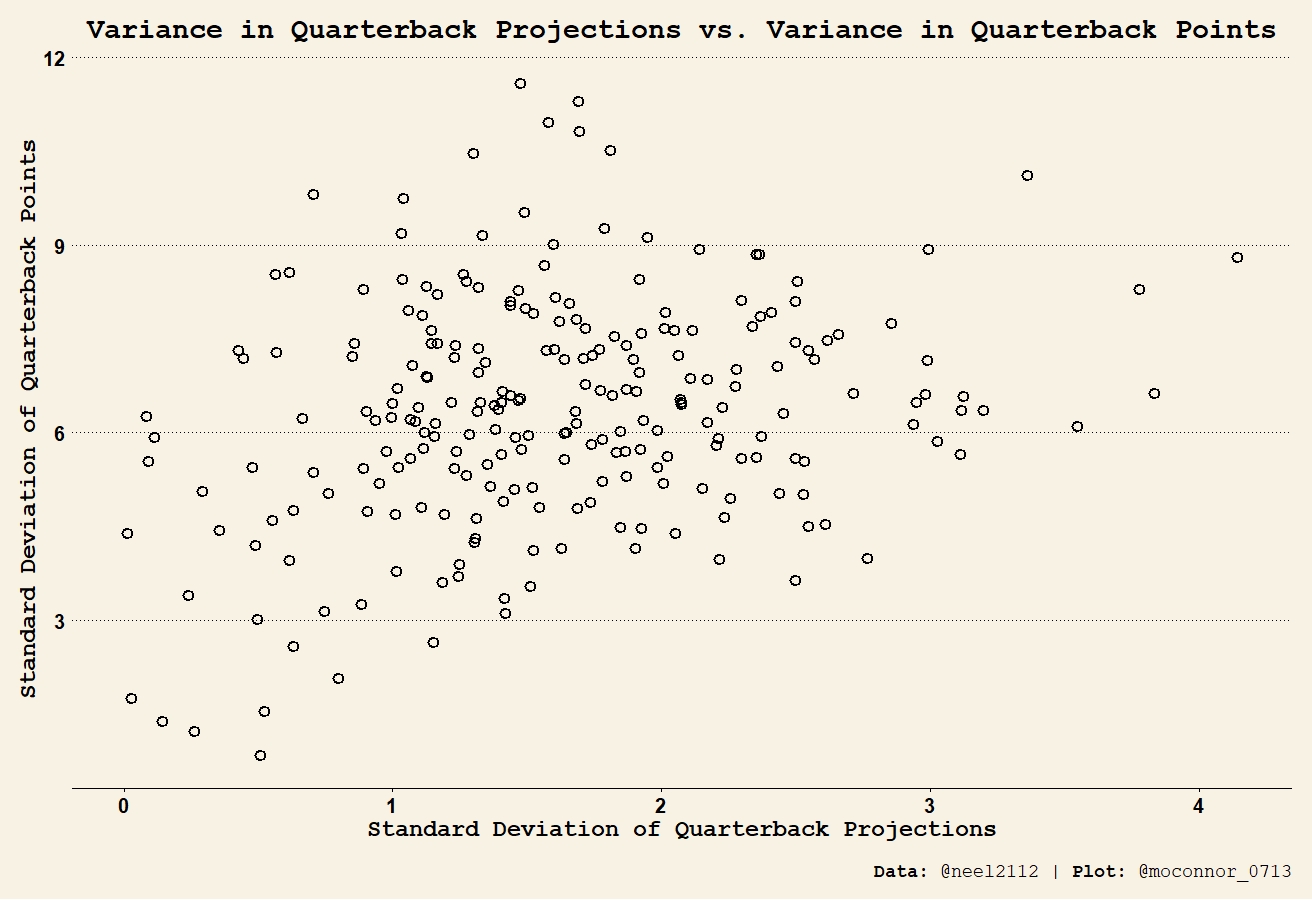
As you can see, the standard deviation of the quarterback projections are consistently well below half that of the standard deviation of the quarterback’s actual points. In fact, the average of the projection standard deviation is only 1.707; while the average of the actual points standard deviation is an astounding 6.623, almost four times the projection value. This isn’t unexpected at all. Projections try to capture the expected value in a player’s performance, rather than try to predict the inherently unpredictable outlier games that players put up.
When do quarterbacks put up big numbers? When are they more likely to have outlier performances?
Quarterbacks perform best when the opposing quarterback is having a big fantasy day. When the opposing quarterback is performing well, your quarterback has to move the ball down the field and score touchdowns to keep up. I graphed density curves of quarterback fantasy point performance based on the amount of points the opposing quarterback scored.
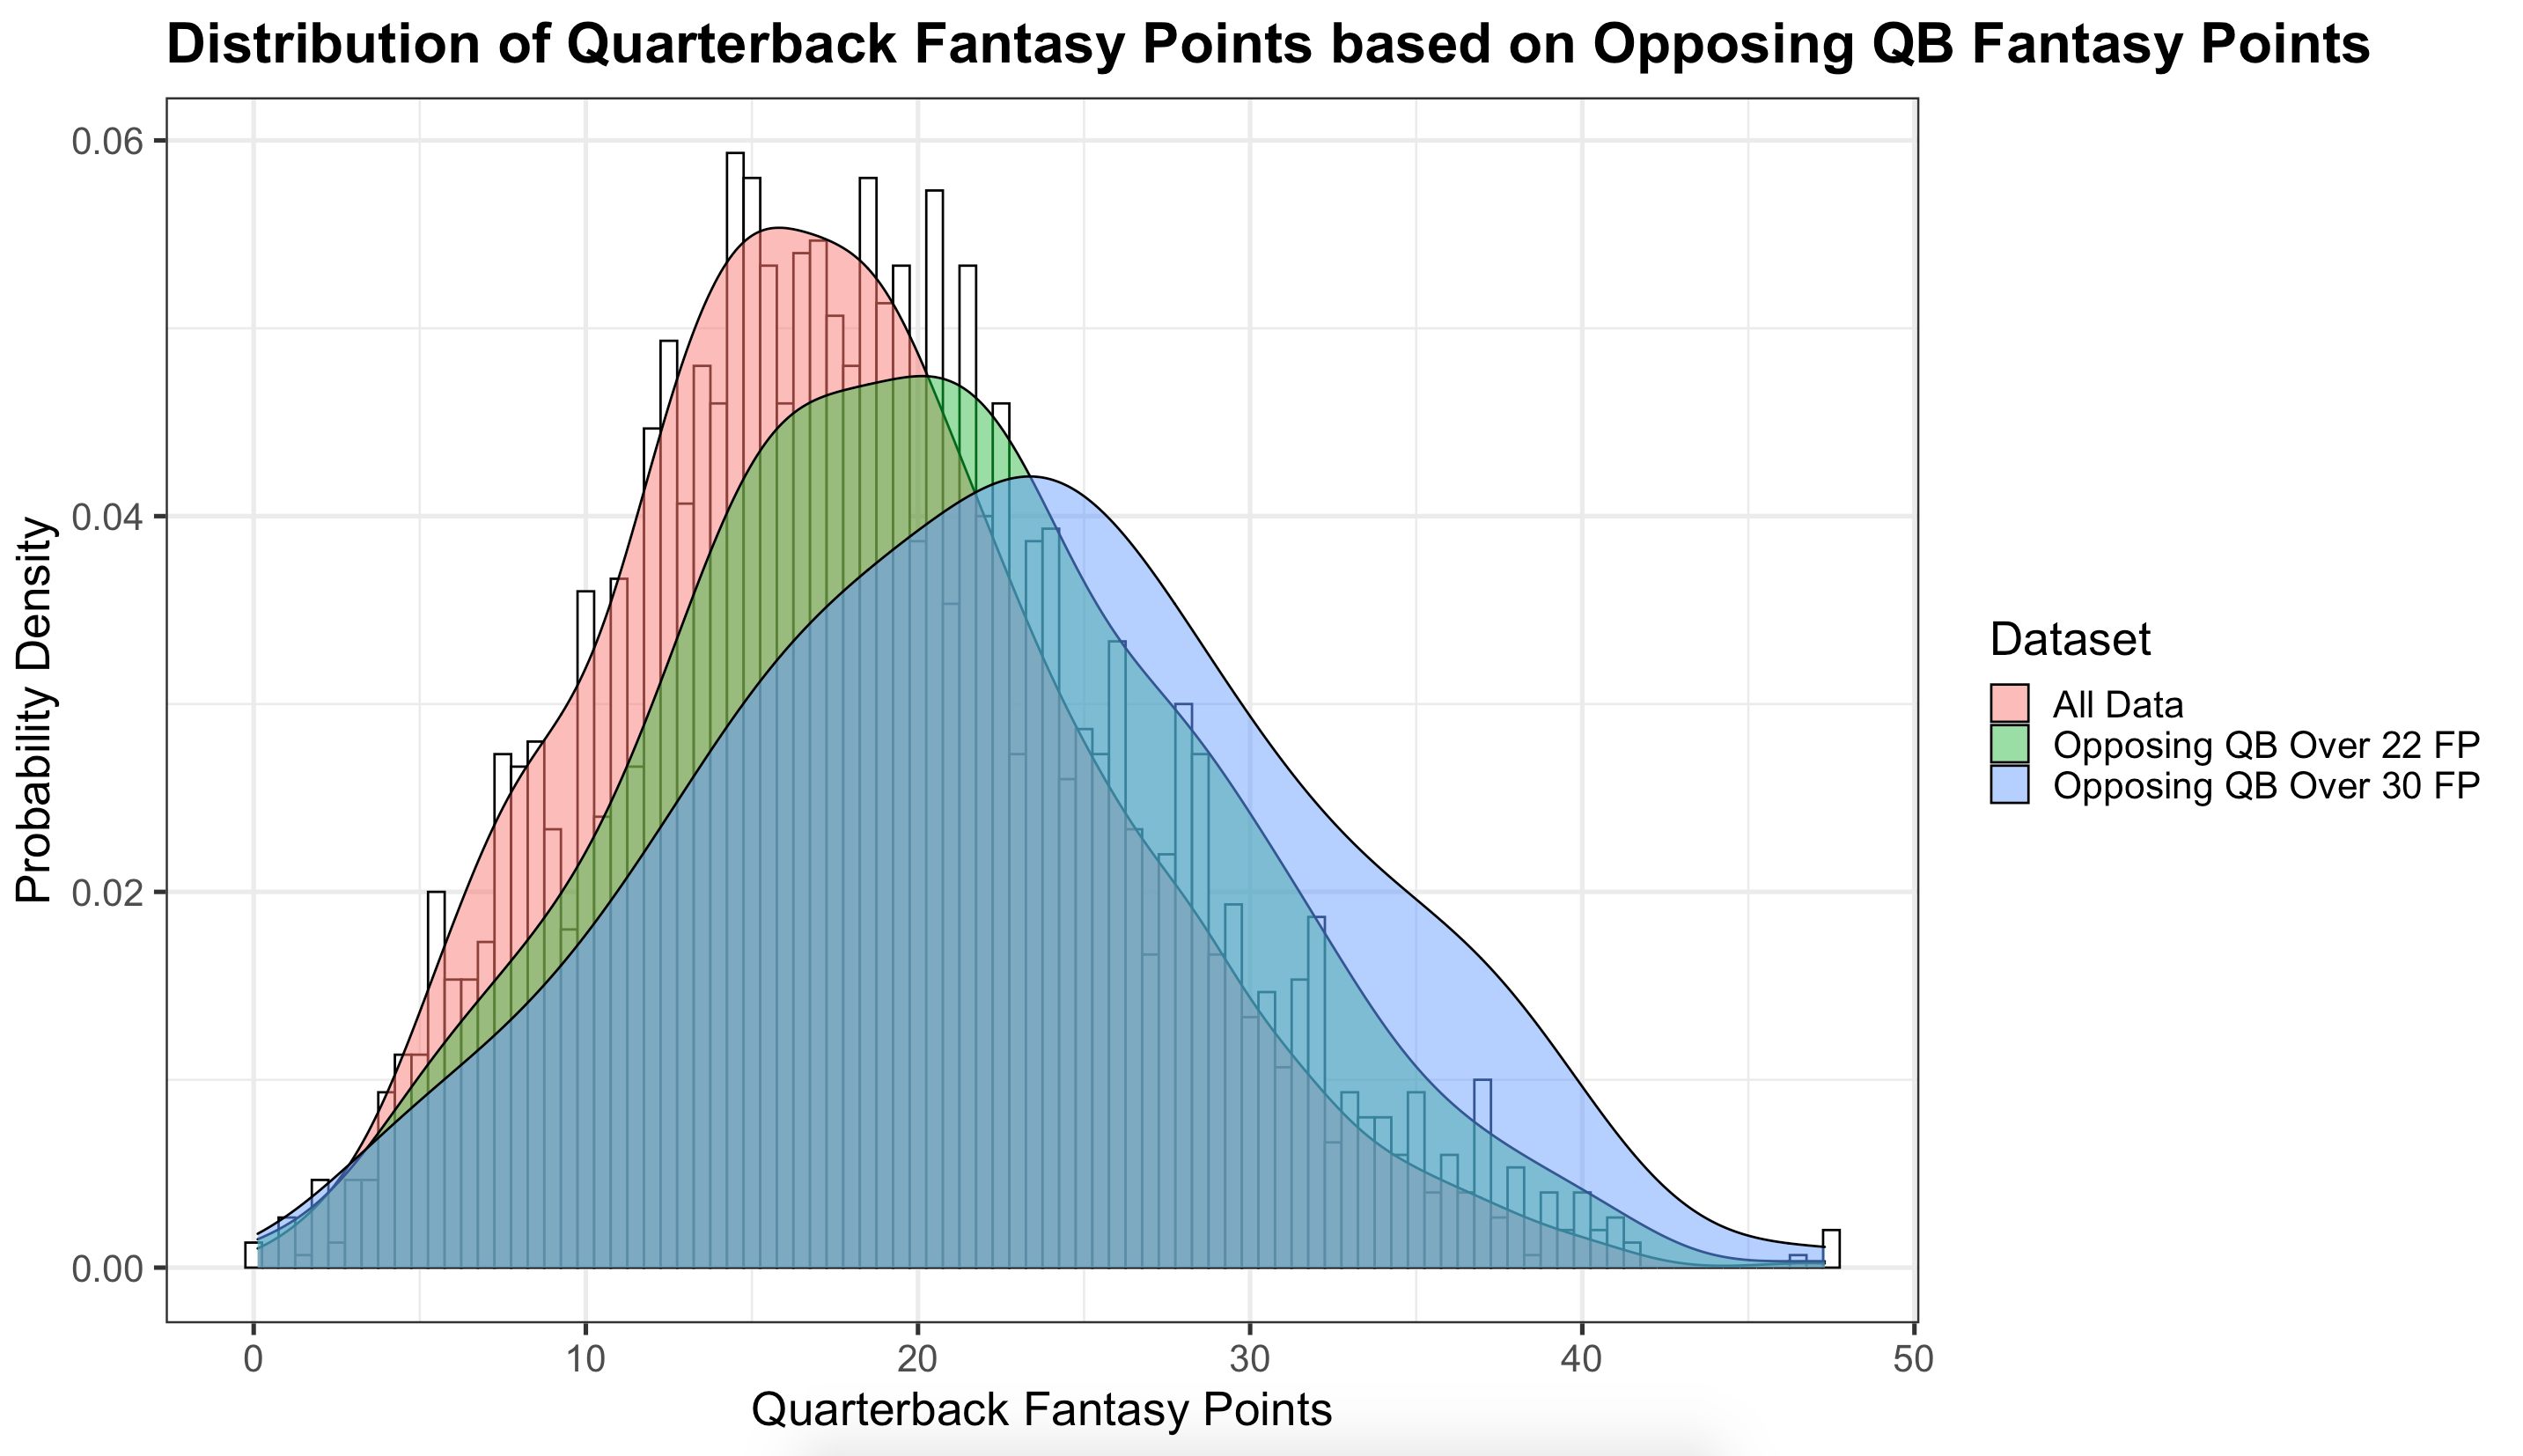
Each curve represents a different portion of my head-to-head quarterback dataset; there is a curve representing the entire dataset (in red), a curve representing the subset of the data where the opposing quarterback scored over 22 points (25-percent of the data, in green), and a curve representing the subset of the data where the opposing quarterback scored over 30 points (6-percent of the data, in blue).
Notice how as the opposing quarterback scores more and more fantasy points, your quarterback’s fundamental distribution is flattened and shifted to the right. In other words, as the opposing quarterback scores more and more points, your quarterback is significantly less likely to score under 20 fantasy points than quarterbacks who are not pre-selected to be playing against high scoring opponents. Your quarterback’s probability of a floor outcome is substantially lowered.
Where does all that probability go? It goes into the quarterback’s ceiling. After around the 23-25 point threshold, the quarterbacks whose opponents are scoring in at least the 3rd-quartile (75th-percentile) are significantly more likely to put up week-winning points.
| Opposing QB Points | Your Average QB Points | % of the Time Your QB Scores Above Their Average |
| All Matchups | 17.38 | 50% |
| Opposing QB > 22 | 19.77 | 62% |
| Opposing QB > 30 | 22 | 70% |
The table above outlines how your average quarterback point total and the percent of the time your quarterback outperforms their season-long average changes depending on how many points the opposing QB scores.
Importantly, projections do not consistently account for your quarterback’s increased expected totals when they are facing a quarterback who is projected to score a lot of points.

When we filter our dataset on matchups where the opposing quarterback is projected to score above 22 fantasy points, your quarterback is only projected to outscore their average 51-percent of the time. In other words, while quarterbacks outperform their average against quarterbacks who scored over 22 points 62-percent of the time, week-to-week projections don’t make this adjustment. Instead, even when projection systems project that the opposing quarterback will eclipse that 22 point threshold, they don’t correspondingly adjust your quarterback’s projected points any higher.
We are consistently under-projecting quarterbacks in matchups against high-scoring opposition.
The Raiders pulled off one of the upsets of the season last year in Week 5 against Mahomes’ top-seeded Chiefs. The Raiders scored 40 points in that game, and Derek Carr threw for three touchdown passes and 350 yards. This game was an outlier performance for Carr in 2020. His final 25 fantasy points was a full standard deviation above his seasonal average. Projections believed Mahomes would score about 25 fantasy points in the game. Yet they only gave 16.5 points of credit to Carr. This was actually less than his season-long average over the first four weeks of the season, 17.8 fantasy points.
Managers might have lost their week because they didn’t start Carr after seeing his below-average projections, which were likely an over-reaction to the Chiefs’ strong defensive play during the start of last season. The Raiders knew they had to chuck it, and Carr put up one of his season’s best fantasy performances. Stream Carr in Weeks 9 and 13 of the upcoming season when he faces Mahomes and his expected barrage of fantasy points.
Weeks like these are where you find outlier performances from average quarterbacks.
We know that projections are inherently conservative in their approach. Projections are localized around players’ averages, fairly sticky, and built around intrinsic variables in the quarterback’s profile. The next step in week-to-week lineup optimization is understanding variance; when does it happen, and how can you take advantage of it. When selecting quarterbacks week-to-week, don’t just look at the defense your quarterback is up against or your quarterback’s seasonal averages; take a look at whether your quarterback is playing against a game-manager like Jared Goff, or a gunslinger like Mahomes, and adjust your projections accordingly.
Historic projection data courtesy of FantasyData.com.

