
In today’s NFL, running backs seem to have shorter and shorter shelf lives. How can we as a fantasy community keep up with running back turnover? Determine efficiency in their team’s scheme? Their ability to be a shifty pass-catcher or a downhill bruiser? One metric that can help determine an running back’s efficiency is the documentation of the Base, Light, and Stacked Fronts that they face.


Defining Fronts
As PlayerProfiler’s Terms Glossary defines fronts: a Base Front is seven defenders in the box.
“The width of the box is the distance between the outer shoulder of right and the outer shoulder of the left tackle. The depth of the box is six yards from the line of scrimmage.”
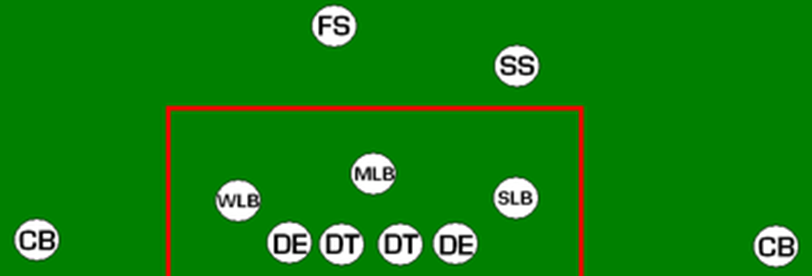
Image of Defensive Box via Wikipedia formation page
A Stacked Front is eight or more defenders in the box, and a Light Front is six or less defenders in the box. Stacked Fronts are used less than Light and Base Fronts, generally to try and stuff a running back. Thus, Stacked Fronts yield fewer yards per carry to running backs on average. A Light Front, due to fewer defenders in the box, tends to yield more yards per carry than average.
Carry rates and yards per carry against of these fronts can help tell a story on what kind of player a particular running back is. We see rushing efficiency against each type of front, which fronts they see the most, and the fronts they’re best against. Using PlayerProfiler’s advanced stats and metrics, we can see Base, Stacked, and Light Front metrics’ utilization.
Base Fronts
Base Fronts are “standard,” with seven defenders in the box. They are seemingly the most basic type of front used by defenses. This front is not necessarily specialized towards adding more defenders against a bruising back, a goal line situation, or using less defenders against a lighter back. The average Base Front Carry Rate among qualifiers in 2020 was 38.7-percent.
Notable players seeing a high Base Front Carry Rate last year were Mark Ingram, Ke’Shawn Vaughn, Duke Johnson, and Raheem Mostert (and Marlon Mack in his single game played). Via PlayerProfiler’s Data Analysis Tool, we see that out of backs that received at least a 50.0-percent Base Front Carry Rate in 2020, three were 49ers RBs, and four were Ravens RBs. The high amount of RBs with a high BFCR tells us that the Ravens and 49ers run the ball heavily as part of their offense.
Nobody ran the ball more than the Baltimore Ravens in 2020 🔥 pic.twitter.com/BhilIeOn1p
— PlayerProfiler (@rotounderworld) March 19, 2021
A notable qualifying player that had a high Base Front Yards Per Carry average was J.K. Dobbins.
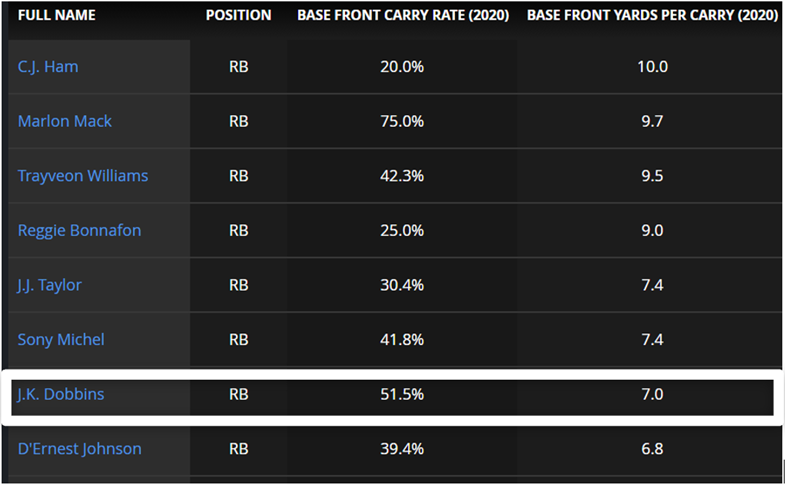
2020 Base Front Advanced Stats & Metrics
Dobbins played in 15 games for Baltimore, saw a BFCR above 50.0-percent, and produced efficiently with a 7.0 BFYPC average. It’s no secret that Dobbins was one of the league’s most efficient backs in 2020, with a 5.4 (No. 1) True Yards Per Carry average. The Ravens offense seeing Base Fronts helped; Dobbins didn’t see extra defenders in the box due to how they line up. His rookie status and not becoming a lead back until the second half of the season also helped him to see more of this “common” look against him. The Baltimore offense seeing a large rate of Base Fronts, plus Dobbins’ efficiency against them, bodes well for him in 2021.
Stacked Fronts
Stacked Fronts have at least an extra defender in the box on the play. Defenses use Stacked Fronts when wanting to load up, potentially seeing a big back, or looking to stuff a short yardage situation. The average Stacked Front Carry Rate among qualifiers in 2020 was 22.0-percent, making it the least used type of front. Goal line plays are one example of a situation where running backs may see a Stacked Front at a higher rate. One example showing this is Jordan Howard, who appeared in seven combined games for the Dolphins and Eagles in 2020.
Howard had a larger-than-average Stacked Front Carry Rate of 40.0-percent, with a 1.5 Stacked Front Yards Per Carry average. While this is not efficient, Howard’s Stacked Front carries primarily stemmed from his 9 (No. 10) goal line carries, and he finished with four (No. 43) total touchdowns.
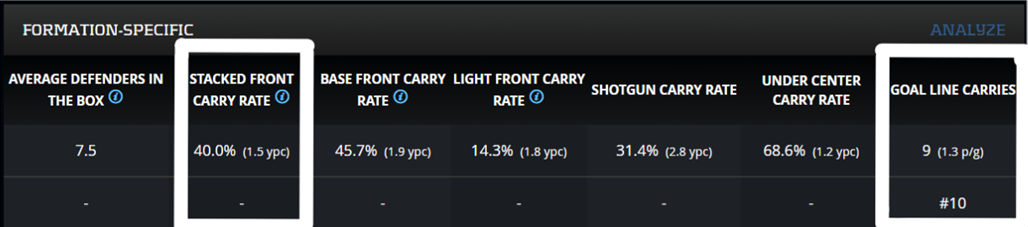
Jordan Howard Formation-Specific Advanced Stats & Metrics
Players like Howard, who may not have efficient stats but face a high number of Stacked Fronts, are backs to monitor as touchdown vultures.
Another player with a high amount of goal line carries and a high Stacked Front Carry Rate was Dalvin Cook; with a 30.4-percent (No. 13) SFCR and 20 (No. 1) goal line carries. Cook also averaged 4.1 SFYPC, and 47.1 Yards Created Per Game, showing that he can get past a Stacked Front, create extra yards despite the extra defender(s), and earn a high amount of goal line opportunity, allowing for more fantasy points to be scored.
Most Carries inside the 5 since 2018 💪
1️⃣ Ezekiel Elliott: 55
2️⃣ Todd Gurley: 54
3️⃣ Dalvin Cook: 50 pic.twitter.com/M2YSQJdNpJ— PlayerProfiler (@rotounderworld) July 5, 2021
One of the most efficient players facing a high SFCR was Nick Chubb. Chubb saw a 28.9-percent (No. 16) SFCR, averaged 6.1 SFYPC, and averaged 54.0 Yards Created per game. Like Cook, Chubb got past the stacked box and created more yardage for himself, boding well for future production.
Lastly, it would not be a Stacked Front discussion without talking about Derrick Henry. The King saw 409 run snaps and a 31.7-percent (No 12) SFCR, averaged 5.0 SFYPC, averaged a whopping 62.3 Yards Created per game, and had a 15.6-percent Stuffed Run Rate, low for someone seeing 23.6 carries per game. Henry’s efficiency, durability, and stability are unrivaled.
Light Fronts
Now we come to the last type of front: Light Fronts. When a defense utilizes a Light Front, they have less defenders in the box than the “norm” of a Base Front. Light Fronts are often utilized against running backs who are smaller, aren’t bruisers, and are used as pass-catchers. Defenses may find it beneficial to split a linebacker out wide instead of in the box against a pass-catching back. The average Light Front Carry Rate among 2020 qualifiers was 38.9-percent, used at about the same rate as Base Fronts. Efficient backs break off larger runs against the reduced defenders in the box.
The top three qualifying players for Light Front Carry Rate in 2020 were Devin Singletary, J.D. McKissic, and Chase Edmonds.
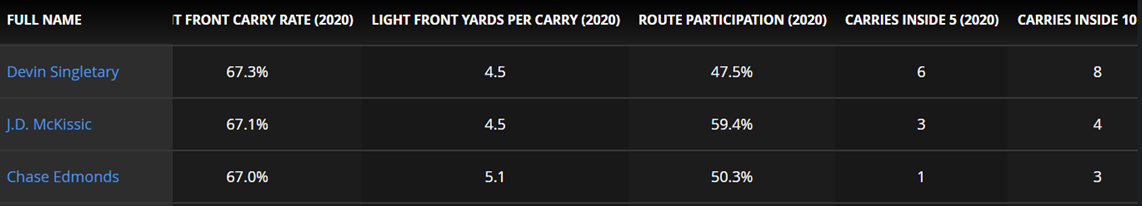
2020 Light Front Advanced Stats & Metrics
All three saw a 67.0-percent or higher LFCR, averaged at least 4.5 Light Front Yards Per Carry, and had high Route Participation rates for an RB, while not reaching double digit red zone carries. This shows that RBs seeing some of the highest LFCRs are more likely to average more yards each carry (less defenders in the box), but don’t get as many red zone or overall carry opportunities. They will, however, get more chances to catch the ball out of the backfield. This information comes in handy for James Conner behind Edmonds and Zack Moss behind Singletary. They will see carry opportunities with neither Edmonds or Singletary possessing the ability to handle full-blown workloads.
Meanwhile, McKissic’s backfield partner, Antonio Gibson, is an exception to the “won’t get as many carry opportunities” rule, with a 60.0-percent (No. 6) LFCR and no other major back to challenge him for carries. There’s a reason he has gained traction in RB rankings in the fantasy community. Gibson averaged 5.5 Light Front Yards Per Carry with 17 carries inside the 10-yard line and a 4.7-percent (No. 23) Breakaway Run Rate. Washington’s top dog is also involved in the receiving game, efficient against a high rate of Light Fronts. Expect him to continue seeing Light Fronts for as long as he remains a receiving threat.
https://youtu.be/o9a8hrqcD64
Other notables with high LFCRs include Joe Mixon (59.7-percent, No. 7) and Clyde Edwards-Helaire (56.9-percent, No. 9). Christian McCaffrey even had a 53.0-percent (No. 15) LFCR in 2019.
Notice a pattern? All top-tier pass-catching backs.
Mixon, like Gibson, may also be an exception to the “won’t get as many carry opportunities” trait. Mixon had the No. 7-ranked LFCR, has no major challengers to his workload, and is a pass-catcher. However, he wasn’t highly efficient against Light Fronts, with a 3.7 LFYPC average and a 2.5-percent (No. 51) Breakaway Run Rate. He only appeared in six games in 2020, but subpar YPC and low rate of large runs against a high rate of Light Fronts does not bode well for his efficiency. Throw in that the Bengals offensive line hardly improved, and Mixon’s value relies more on his volume than his efficiency.

How Can We Use This in Fantasy Football?
Throughout the sections for each front, I outlined notable backs with high carry rates and high or low efficiency numbers. An RB seeing a large rate of one front with high efficiency against it projects better than one with low efficiency. Stacked Fronts are used less by defenses and are utilized heavily in goal line scenarios. A player who is efficient against a high rate of Stacked Fronts can be in line for more goal line carries. Light Fronts, on the other hand, are used as often as Base Fronts. With less box defenders, RBs seeing Light Fronts should see more yards per carry and rip off more large runs.
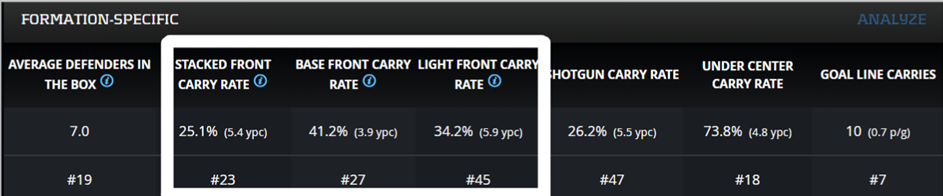
Let’s use Alvin Kamara as an example of how seeing efficiency against fronts connects to fantasy success.
Alvin Kamara Formation-Specific Advanced Stats & Metrics
Kamara faced an above average rate of Stacked Fronts and was one of the most efficient RBs against them with a 5.4 Stacked Front Yards Per Carry average. One reason for his high SFCR was his 15 carries inside the 5-yard line, with a 30.6-percent (No. 2) red zone TD conversion rate. Kamara also had a 13.4-percent Stuffed Run Rate, adding to his Stacked Front efficiency. While he wasn’t highly efficient against Base Fronts, he averaged 5.9 Light Front Yards Per Carry. Toss in his 5.9-percent (No. 10) Breakaway Run Rate and he was efficient against Light Fronts. Combining all this, he was one of fantasy’s most productive players, leading his position with a 25.2 Fantasy Points Per Game average and 243.3 Best Ball Points Added. We can expect this to continue because his efficiency data against fronts is among the league’s best.
On the other hand, Kenyan Drake was less efficient against these fronts:
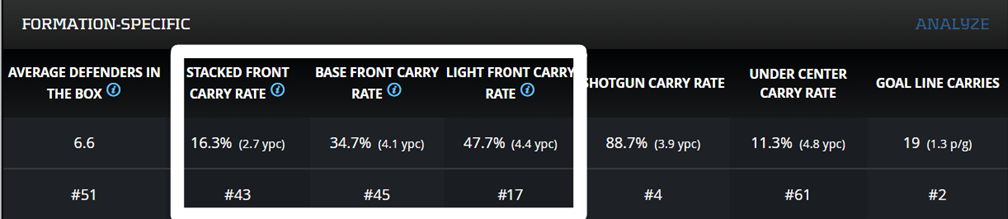
Kenyan Drake Formation-Specific Advanced Stats & Metrics
Drake saw a below-average 16.3-percent SFCR, and averaged 2.7 SFYPC, half of Kamara’s. His Stuffed Run Rate was a high 19.7-percent, and he had a mere 15.5-percent red zone TD conversion rate, with 19 (No. 2) goal line carries. He saw an above average 47.7-percent (No. 17) LFCR, and while his 4.4 LFYPC average isn’t entirely inefficient, he only had a 2.9-percent (No. 48) Breakaway Run Rate. His inefficiency against these fronts showed in his fantasy output, averaging 12.8 (No. 24) Fantasy Points Per Game despite his 66.0-percent (No. 13) Opportunity Share.
With the differences in Kamara and Drake’s 2020 fantasy seasons, we see how efficiency against different fronts helps or hurts. High Stacked Front efficiency leads to high red zone efficiency, while high Light Front efficiency leads to more chunk runs.
We can also use fronts to identify a potential breakout. Damien Harris saw a 42.3-percent (No. 2) Stacked Front Carry Rate, averaging 4.8 SFYPC, 1.7 (No. 9) Yards Created Per Touch, and only a 13.1-percent Stuffed Run Rate. Harris’s efficiency against a stacked box bodes well for him to be a downhill bruiser for the Patriots.
Who is the dude in New England?😊 pic.twitter.com/U6KKbEFtch
— PlayerProfiler (@rotounderworld) July 1, 2021
We can observe player data versus different fronts to see which ones they see the most and the efficiency they show against them. This can help predict if the player sees more opportunity next season and has fantasy-relevant efficiency. Efficiency and rate metrics with Base, Light, and Stacked Fronts can be used to argue that a player will be a touchdown machine, break off chunk gains, or that a player will be inefficient altogether.

