
Last year, I deposited $100 into a player prop platform and quickly lost all my money.
This year, I’ve made hundreds of player prop picks week-after-week on Underdog Fantasy, netting thousands in profit. While anyone can make $1,000 by putting $50 on a Pick-5, it’s much more difficult to be sustainably profitable long-term.
I created this guide to help you do just that. It chronicles my revenge tour, time spent intensely researching player performance and the unique payout structure of platforms like Underdog Fantasy, where I was determined to find an edge for the 2021 season.
The Basic Rules and Payout Structure Explained
When you peruse Underdog Fantasy’s Pick ‘Em section, you’ll see all the players’ over/under lines. You simply click over or under to take that line.
You need to choose between 2-5 different players’ lines, and these 2-5 lines need to be from two or more different teams. Looking below, these are the December 2nd lines for Thursday Night Football. You could take the over on Ezekiel Elliott‘s rushing yards and the under on Dak Prescott‘s passing yards, but this wouldn’t be a valid Pick-2, since you need players from at least two teams. You’d have to add a Taysom Hill or Mark Ingram or Tre’Quan Smith (or another non-Saints/Cowboys) line for it to be valid.
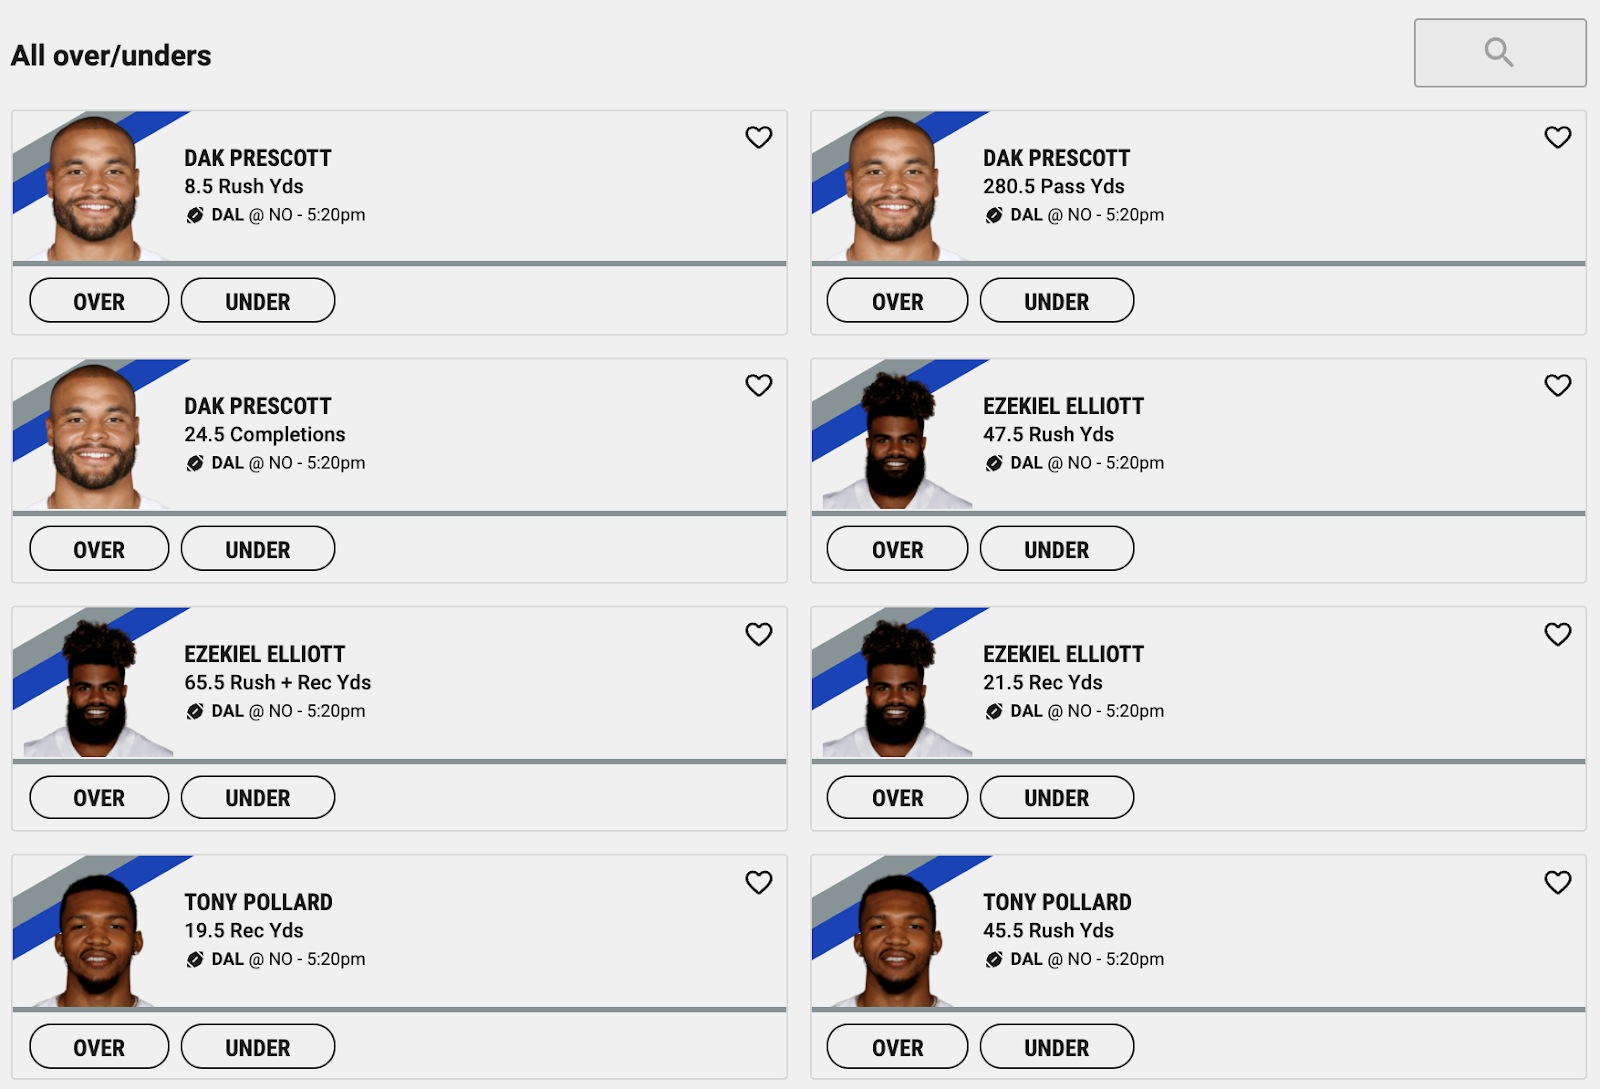
The payout structure is simple on Underdog. All Pick-2s pay out 3x your buy-in. If you put in $10 on a Pick-2 and get it correct, you walk away with $30.
All Pick-3s pay out 6x, all Pick-4s pay out 10x, and all Pick-5s pay out 20x.
It’s important to note how a platform like Underdog Fantasy makes money with their Pick ‘Ems. While Underdog is by far my favorite platform, due to its slick interface, superior customer service, and innovative new formats, it’s still a business that needs to make money.
Let’s say that every single over/under line is truly a 50/50 chance at going over/under, and we pick two random lines and take an over and an under. The chance that two 50/50 situations both happen in our favor is 1 in 4, or 25-percent. It’s the same odds that you can correctly guess a coin flip two times in a row.
But remember, if we get a Pick-2 correct, we only get 3x our buy-in returned to us. If we are purely taking 50/50 over/unders as Pick-2s, then we ideally want a 4x return to break even when we get it correct.
This is where having a deliberate strategy tailored to the payout structure is important. As you can now see, simply taking two random over/unders is NOT the magical key to success with player prop games.
Before moving on to concrete strategies that should hit more often than the break even rate, let’s briefly review Pick-3, Pick-4, and Pick-5 odds and payouts.
The chance you guess 3 random 50/50 events correctly is 1 in 8, yet the payout for a correct Pick-3 is not 8x, it’s 6x.
The chance you guess 4 random 50/50 events correctly is 1 in 16, yet the payout for a correct Pick-4 is not 16x, it’s 10x.
And the chance you guess 5 random 50/50 events correctly is 1 in 32, yet the payout for a correct Pick-5 is not 32x, it’s 20x.
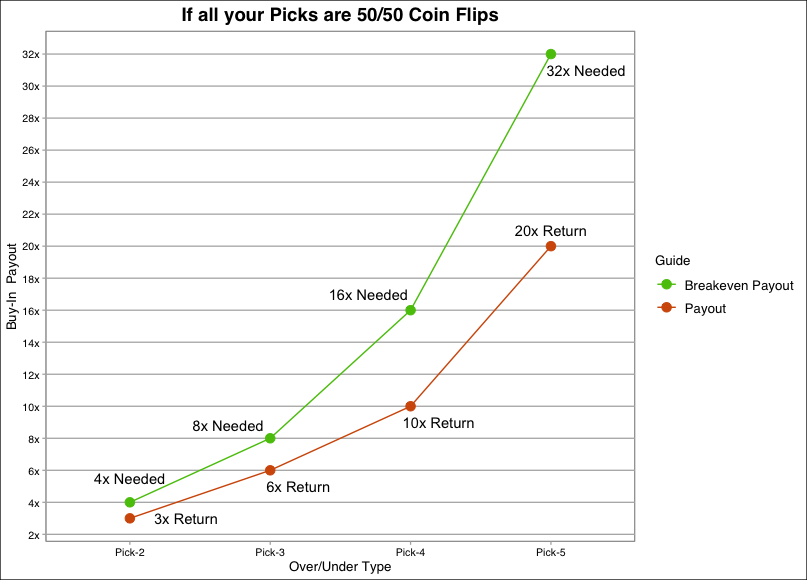
Clearly, we have to do something on our end to identify player prop lines that have a better than 50/50 chance of hitting over or under.
First, a Strategy that Surprisingly Does Not Work
You may be thinking you should just compare player projections to the Underdog Fantasy Pick ‘Em lines. Simple, right?
You see that Tyler Lockett is projected for 67 receiving yards, yet his prop that week is over/under 62.5 receiving yards. You think to yourself this is an absolute smash, since he legally has to go over 62.5 receiving yards if three different sites all project him above 62.5 receiving yards.
And this is where I would caution you. Lockett may be averaging a 25-percent Target Share and 67 receiving yards per game, but I’d assume more than half of Lockett’s actual games are below a 25-percent Target Share and below 67 receiving yards if that’s his average, and a couple huge games are probably lifting up his season-long averages.
Importantly, we are trying our best to find supposedly 50/50 lines that are actually slightly tilted in favor of one side or the other. Remember that taking 50/50 lines over time will result in losing our deposit, as the payouts aren’t equal to the odds of the lines all hitting at a 50/50 rate.
Now, Two Strategies that Do Work
Strategy 1: Correlated UNDER Pick-4s
Before revealing how to implement this strategy, it’s important to note the research that went into this.
The Dataset
I wanted to better understand how quarterbacks and their primary wide receiver accumulated passing and receiving yards, respectively. All data used was from regular season NFL games between 2011-2020.
Looking at all 32 teams each of the past 10 seasons, I identified the primary quarterback (most passing yards on the team that season) and primary wide receiver (most receiving yards on the team that season). With 32 teams and 10 seasons, this led to 320 quarterback seasons and 320 wide receiver seasons.
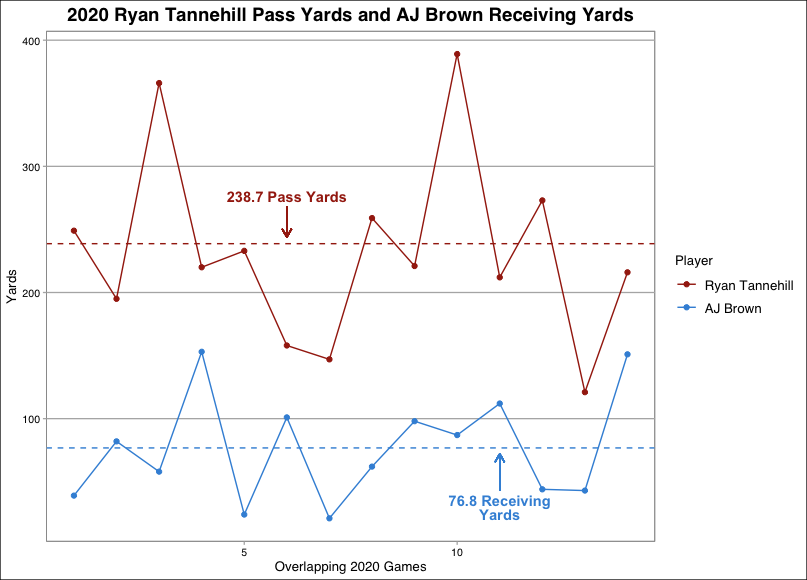
The 2020 Tennessee Titans would have Ryan Tannehill (3,817 passing yards) and A.J. Brown (1,073 receiving yards) as the primary options at each position, as an example.
I then noted how many games the quarterback and wide receiver each played that season, so I could be aware of their per game average in yardage. Tannehill played all 16 games in 2020 (238.7 passing yards per game), while Brown participated in 14 games (76.8 receiving yards per game).
I calculated how many times both players finished a game above their season-long average, and how many times both players finished a game below their season-long average.
In the case of the 2020 Titans, Tannehill and Brown overlapped in 14 games, and in one game (7-percent of overlapping games) Tannehill passed for more than 238.7 yards while Brown racked up more than 76.8 receiving yards. In three games (21-percent of overlapping games) in 2020, they were both under their season-long averages. I repeated this exercise for all 320 QB/WR duos the past 10 seasons.
The Sobering Results
Overall, in 30.0-percent of games, both the QB and WR finished OVER their averages. That, to put it mildly, is not good for us Underdog Fantasy users.
If a correct Pick-2 results in a 3x payout, then we need both props to hit at least 33.3-percent (1/3) of the time to break even with our buy-in.
In 33.7-percent of games, both the QB and WR finished UNDER their averages. 33.7-percent is greater than the 33.3-percent baselines we need to be profitable long-term, barely.
However, we reach another issue. Remember from earlier, we need at least two different teams represented in our Pick ‘Ems, so we can’t just take QB-WR same team UNDERS and print small stacks of money because 33.7-percent is greater than 33.3-percent.
Finally, we Beat the Odds
To get around this, I analyzed same game QB-WR pairings. How often within a game do both quarterbacks and both primary wide receivers go OVER or UNDER their season-long averages.
If we are choosing four players now, reminder that a Pick-4 pays out 10x your buy-in if you get all four picks correct. Essentially, we are hoping all four players go UNDER or all four players go OVER more than 10-percent of the time.
There have been 1,762 games the past 10 years that featured both healthy quarterbacks and both their healthy primary wide receivers. 160 of those games (9.1-percent) featured all four players going OVER their season-long average.
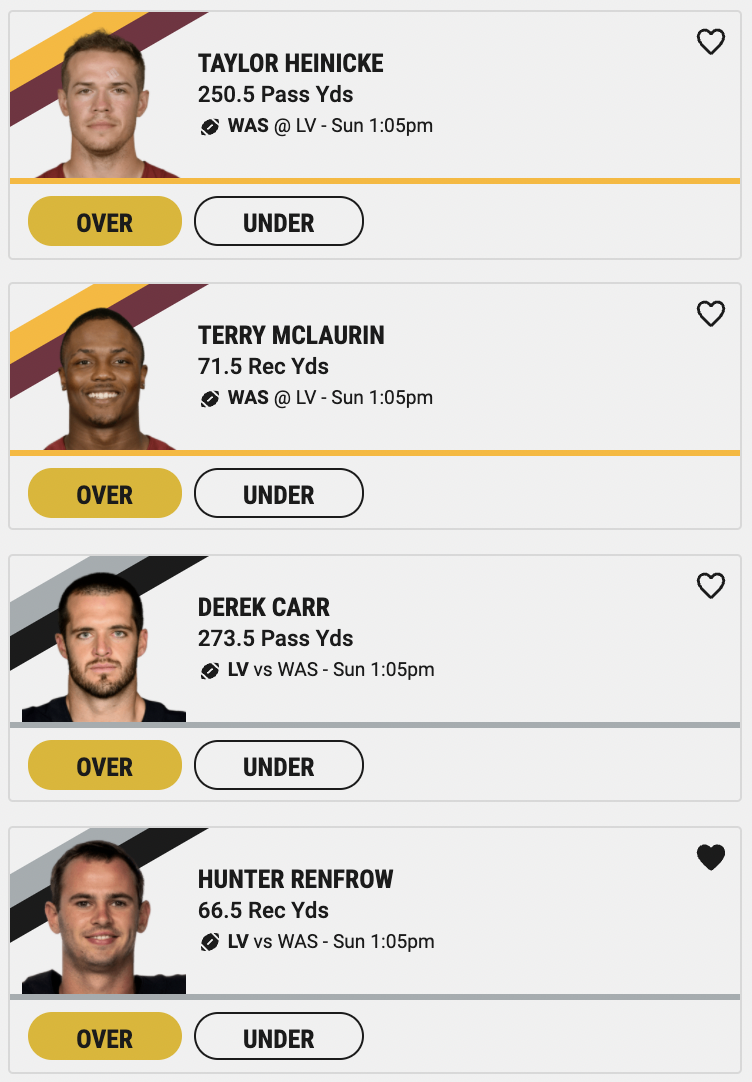
In plain English, if we take the OVERS on the main quarterbacks and primary receivers from the Week 13 Washington at Vegas game (Taylor Heinicke–Terry McLaurin and Derek Carr–Hunter Renfrow), it’s expected to hit 9.1-percent of the time if these over/under lines are roughly the players’ season-long averages, which is under the 10-percent threshold needed to at least break even financially.
To put it simply, this is not a great strategy long-term.
However, if we instead do the opposite and take all four UNDERS, this has hit in 225 of the 1,762 games analyzed (12.8-percent rate). And 12.8-percent is higher than 10-percent.
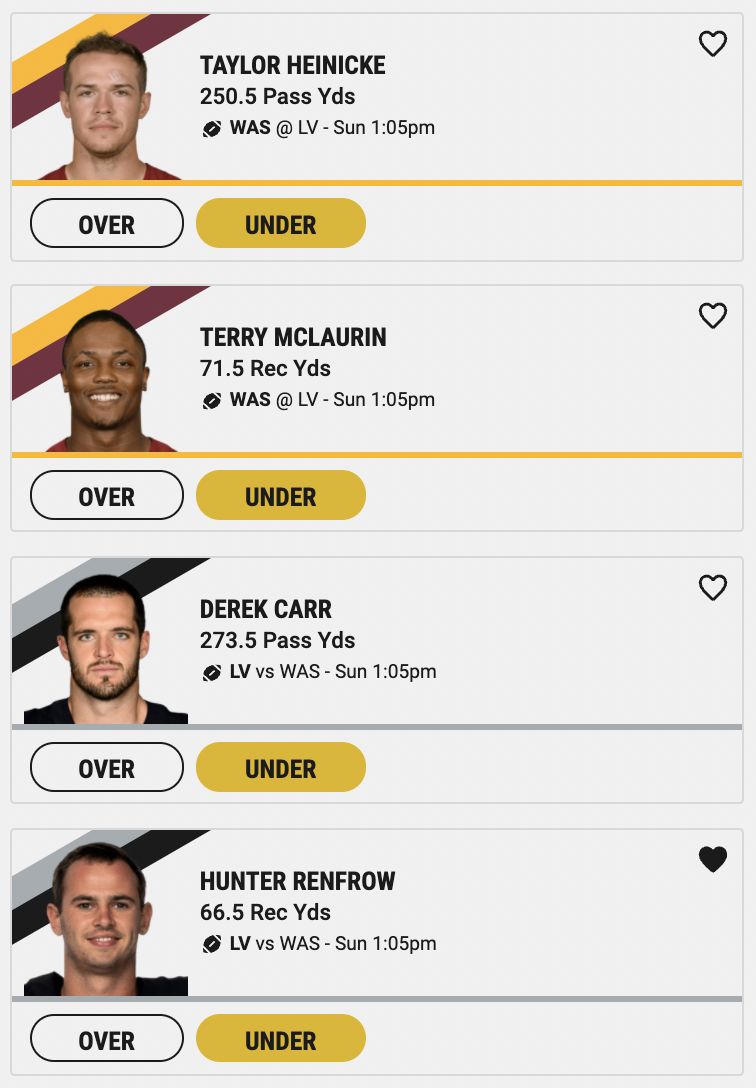
The above Pick-4 slip is the type of well-constructed and highly-correlated Pick ‘Em that should 10x our buy-in more than 1 in 10 tries.
Much of my weekly Pick ‘Em portfolio each week on Underdog consists of these correlated UNDERS with two quarterbacks and two receivers from the same game.
To review, we began by recognizing that four 50/50 events are likely to hit only 1 in 16 times, yet we also knew the payout was only 10x. To solve this puzzle, we aggressively correlated the players within our Pick-4, finding a formula for sustained success in the long-run.

Strategy 2: UNDERS on Volatile Player Archetypes
Not everyone wants to correlate their Pick ‘Ems, and I was determined to identify player archetypes that we could exploit on Underdog.
I looked at running backs from 2011-2020 with at least eight games played and 35-plus total yards per game. And, I studied wide receivers with at least eight games played and 25-plus receiving yards per game. This left me with 578 RB seasons and 939 WR seasons.
Running Backs
With running backs, I then looked at each individual game from that season and compared it to their season-long average. Overall, about 44.6-percent of RB games were OVER their season-long average, with roughly 55.3-percent of their games being UNDER their average.
Higher usage running backs are more consistent. If we only look at RBs with 65-plus total yards per game, the ratio shifts from 44.6/55.3 to 46.0/54.0. If we only look at RBs with 85-plus total yards per game, the ratio further shifts to 47.2-percent of their games being OVER their season-long average, and 52.8-percent of games being UNDER their season-long average.
However, a pocket of volatile running backs emerges if we only look at running backs averaging between 35-50 total yards per game. Looking at the 2,239 RB games that qualify here, 42.7-percent of these RBs will be OVER their season-long average in a given game, while 57.3-percent will be UNDER it.
Wide Receivers
Returning to our 939 wide receiver seasons from earlier, they played in 13,168 individual games from 2011-2020. Overall, 44.1-percent of their games were OVER their season-long average, with about 55.8-percent being UNDER their season-long average yards in a given game.
Like running backs, higher usage wide receivers are more consistent. Bumping the receiving yards threshold up from 25 yards per game to 50 receiving yards per game, these wide receivers were OVER their season-long average in 45.5-percent of games, and UNDER in about 54.4-percent.
However, the real volatility lies in the big play wide receivers. If we only look at wide receivers who average 16 or more yards per reception, we find that they are OVER their season-long average in 43.8-percent of games, and UNDER it in 56.1-percent of games.
The Math in Action
We have 2,239 RB games (57.3-percent UNDER) from the volatile 35-50 total yards per game group, and we have 2,132 WR games (56.1-percent UNDER) from the 16-plus yards per reception group. Both the average and the weighted average come out to 56.7-percent of games being UNDER the season-long average for these two archetypes of players.
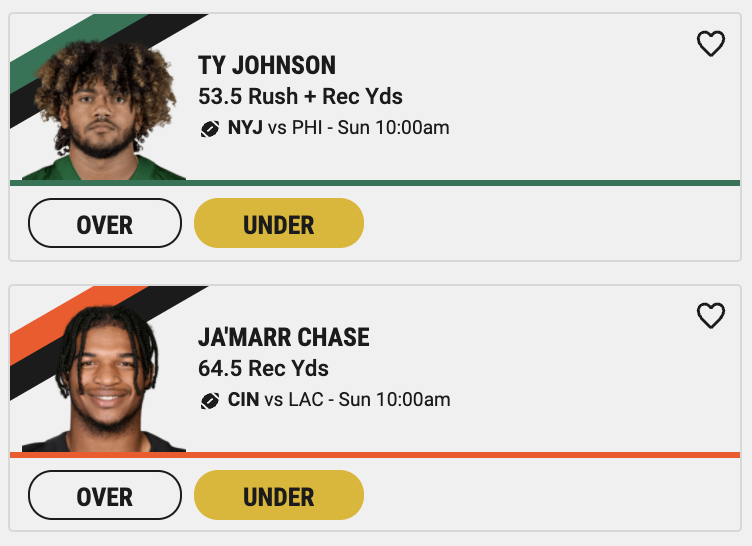
With running backs, we are likely looking at change of pace or pass-catching backs, and with receivers we’re looking at big play or field-stretcher types.
Below are Ty Johnson and Ja’Marr Chase, two players who fit this mold for Week 13 NFL action.
Now, we need to find a way to beat the payout structure odds with these archetypes of RBs/WRs.
Let’s stick with 56.7-percent of games being UNDER the season-long averages for these players. For this section, I’m running 100,000 probability simulations using R code. If you’re interested in learning R and creating your own probability simulations, I teach an R coding course for analytics with football datasets (ThatRCodingSite.com).
If we were to take a Pick-2, where both players had a 56.7-percent chance of hitting the UNDER, we would get both players correct 32.1-percent of the time, which is under the 33.3-percent we need to 3x our money and break even. Put simply, don’t do Pick-2s with these players. Put another way, if we made 100 $1 picks via Pick-2s, we would come away with only $96 on average, slightly less than our original bankroll.
If we were to take a Pick-3, where all three players had a 56.7-percent chance of hitting the UNDER, we would get all three players correct 18.3-percent of the time, which is over the 16.7-percent (1 in 6) odds we need to 6x our money and break even. Put simply, Pick-3s with these volatile RBs/WRs can be profitable long-term. Put another way, if we made 100 $1 picks via these Pick-3s, we would come away with about $110 on average, more than our original bankroll.
Rather than recycle this paragraph structure two more times, the table below illustrates everything for Pick-2s through Pick-5s if we are targeting the volatile RBs/WRs who go UNDER their season-long average 56.7-percent of the time. The final two columns were calculated using 100,000 probability simulations with R code.
| Pick Type | Payout (Odds) | Percent Correct | 100 $1 Picks Made |
| Pick-2 | 3x (33.3%) | 32.1% | $96.50 |
| Pick-3 | 6x (16.7%) | 18.3% | $110.00 |
| Pick-4 | 10x (10%) | 10.3% | $103.50 |
| Pick-5 | 20x (5%) | 5.9% | $118.50 |
To review, the best way to execute this strategy is taking UNDERS on change of pace and pass-catching RBs and field-stretching/high target depth WRs via Pick-3s and Pick-5s.
The Theoretical Difference Between Player Props and DFS
A couple weeks back, I posted on Twitter (@JLarkyTweets) that I was very interested in the UNDER on Jarvis Landry’s receiving yards against the Ravens. I did indeed put my own money on his UNDER via Underdog Fantasy.
I also posted a screengrab after the game ended, where I took down a DFS Showdown tournament with Landry in my captain’s slot. Several of my followers were frustrated that I had deceived them by publicly recommending a Landry UNDER for his player prop, but then having him in the captain slot for DFS. I made a few dozen Showdown lineups and Landry was the captain in only a couple of them, but that anecdote is really besides the point.
With player props, we are chasing the most likely outcome. I want to find over/under lines I believe have a roughly 55-percent-plus chance of hitting. Yet with DFS tournaments, if you finish in the 55th percentile among entrants, you lose your buy-in.
If I enter a 10,000 person tournament and even finish in 3,000th place, I may lose my entire buy-in. However, if we translate that 70th percentile DFS finish to a 70-percent chance of a player prop hitting, that’s an incredible prop to take the OVER or the UNDER on.
With DFS, the majority of the payouts are tied up in the top 1-percent of finishers, so naturally I’m chasing two entirely different outcomes with player props and DFS. For player props, we want to favor most likely outcomes, and with DFS, we want to favor absolute ceiling outcomes.
No Guarantee to Make Money
While I have been profitable playing Underdog Fantasy’s Pick ‘Em games this NFL season, there is no guarantee that 1) I’ll continue to be profitable and 2) that you’ll be profitable.
It’s always important to deposit and gamble responsibly. And hopefully this player prop guide helps you play more strategically and more responsibly, as well.
Bankroll Management
How much money should you be placing on each Pick ‘Em?
Say you’re new to Underdog Fantasy, and you deposit $100 of your own money and use the promo code UNDERWORLD. You get an instant deposit match up to $100 with our promo code. Now you have $200 in your account.
All the margins of potential profitability that I discussed in this guide are slim. It’s unlikely that making 100 $1 picks will result in you having $500 in your account. If you’re successful, you’d hope to have around $110 or $120 in your account after those 100 picks.
If you have $200 in your account, I’d recommend putting between $1-$3 on each Pick ‘Em to get started. Once you have a sustainable system going, you can increase to $5 per pick.
The other aspect of bankroll management is the psychology behind it. Never put in an amount of money that makes you uncomfortable should you lose it all. If you put in five $10 picks, imagine losing all $50. If the thought of that makes you squeamish, you’re playing too high of stakes and risking too large a percentage of your overall bankroll that week.
The psychological aspect is important because losing sucks. A spiral many get caught in is uncomfortably losing money one week, and then putting in twice as much money the next week to “get back to normal.” This is a common strategy, and definitely not an optimal one, which is why I recommend smaller dollar amounts on your picks to keep yourself level-headed and focused.

Now Go Out and Play Some Pick ‘Ems!
Thanks for reading through this guide. I hope you found the material interesting, informative, and helpful.
If you have further questions, you can DM me on Twitter (@JLarkyTweets). I’ll try to answer as many as I have time for.
And remember, promo code UNDERWORLD gets new Underdog Fantasy users up to a $100 instant deposit match.

