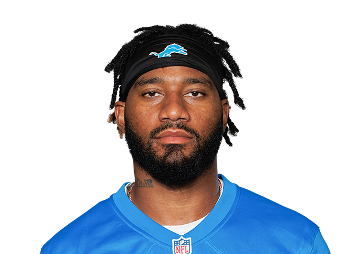
Saints Re-Sign Tre'Quan Smith To Two-Year Deal
The New Orleans Saints are re-signing wide receiver Tre'Quan...
Year Year | Games Played Games | Targets Tgts | Receptions Rec | Receiving Yards Rec Yds | Yards Per Reception YPR | Air Yards Air Yds | Receiving TDs Rec TD | Fantasy Points Per Game Fantasy Pts/Game |
---|---|---|---|---|---|---|---|---|
2021 | 11 | 50 | 32 | 377 | 11.8 | 484 | 3 | 8.0 (#57) |
2020 | 14 | 50 | 34 | 448 | 13.2 | 446 | 4 | 7.4 (#78) |
2019 | 10 | 25 | 18 | 234 | 13.0 | 233 | 5 | 7.1 (#74) |
2018 | 13 | 44 | 28 | 427 | 15.2 | 566 | 5 | 7.7 (#74) |
Targets | Target Share | Target Rate | Snap Share | Slot Snaps | Routes Run | Route Participation Route % |
---|---|---|---|---|---|---|
50 (4.5 p/g) | 15.0% (18.6% rz) | 17.5% | 68.0% | 196 (39.3% rate) | 285 (25.9 p/g) | 80.3% |
#90 | #63 | #81 | #69 | #40 | #87 | #50 |
Air Yards | Air Yards Share | Average Target Distance (ADOT) Target Depth (ADOT) | Deep Targets | Red Zone Targets Red Zone Tgts | Target Quality Rating | Catchable Target Rate |
---|---|---|---|---|---|---|
484 (44.0 p/g) | 20.3% | 9.7 | 5 (0.5 p/g) | 8 (5 rec) | 5.60 | 76.0% (38 tgts) |
#85 | #60 | #60 | #99 | #59 | #39 | #47 |
Receptions Recs | Receiving Yards Rec Yards | Yards After Catch YAC | Unrealized Air Yards | Total TDs | Fantasy Points Per Game Fantasy Pts/Game | Expected Fantasy Points Per Game Expected Fantasy Pts/Game |
---|---|---|---|---|---|---|
32 (2.9 p/g) | 377 (34.3 p/g) | 90 (1.8 p/tgt) | 197 (3.9 p/tgt) | 3 (9.4% rate) | 8.0 | 8.3 (-0.30 diff) |
#88 | #91 | #113 | #98 | #61 | #57 | #66 |
Target Accuracy | Yards Per Route Run | Formation Adjusted Yards Per Route Run Formation Adjusted YPRR | Yards Per Target YPT | Yards Per Reception YPR | Yards Per Team Pass Attempt Yards/Team Pass Attempt | True Catch Rate |
---|---|---|---|---|---|---|
7.7 | 1.32 | 1.22 | 7.5 | 11.8 | 0.98 | 84.2% (64.0% actual) |
#15 | #82 | #74 | #61 | #63 | #64 | #50 |
Target Separation | Average Cushion | Target Premium | Dominator Rating | Juke Rate | Drops | Contested Catch Rate Contested Catch % |
---|---|---|---|---|---|---|
1.66 | 4.68 | +0.8% | 18.2% | 6.3% | 2 (4.0% rate) | 36.4% (11 tgts) |
#41 | #40 | #49 | #49 | #64 | #82 | #49 |
Production Premium | Expected Points Added (EPA) EPA | QB Rating Per Target QB Rating Per Target | Best Ball Points Added Best Ball Pts Added | Fantasy Points Per Route Run Fantasy Points Per Route | Fantasy Points Per Target Fantasy Points Per Target | Total Fantasy Points Total Fantasy Pts |
---|---|---|---|---|---|---|
-0.3 | +8.4 | 106.8 | 20.3 (1.8 p/g) | 0.31 | 1.75 | 87.70 |
#52 | #112 | #41 | #83 | #72 | #48 | #80 |
Total Route Wins | Route Win Rate | Routes vs Man | Win Rate vs Man | Target Rate vs Man | Target Separation vs Man Tgt Separation vs Man | Fantasy Points Per Target vs Man Fantasy Pts/Tgt vs Man |
---|---|---|---|---|---|---|
112 | 37.8% | 143 (131 zone) | 37.1% (39.7% zone) | 19.6% (13.7% zone) | 1.54 (2.06 zone) | 1.56 (1.93 zone) |
#73 | #58 | #81 | #37 | #68 | #52 | #62 |
Targets | Target Share | Target Rate | Snap Share | Slot Snaps | Routes Run | Route Participation Route % |
---|---|---|---|---|---|---|
50 (3.6 p/g) | 11.1% (10.8% rz) | 12.6% | 66.1% | 326 (50.2% rate) | 396 (28.3 p/g) | 85.7% |
#87 | #92 | #107 | #74 | #22 | #57 | - |
Air Yards | Air Yards Share | Average Target Distance (ADOT) Target Depth (ADOT) | Deep Targets | Red Zone Targets Red Zone Tgts | Target Quality Rating | Catchable Target Rate |
---|---|---|---|---|---|---|
446 (31.9 p/g) | 16.4% | 8.9 | 3 (0.2 p/g) | 8 (4 rec) | 5.54 | 80.0% (40 tgts) |
#92 | #78 | #74 | #117 | #60 | #57 | #38 |
Receptions Recs | Receiving Yards Rec Yards | Yards After Catch YAC | Unrealized Air Yards | Total TDs | Fantasy Points Per Game Fantasy Pts/Game | Expected Fantasy Points Per Game Expected Fantasy Pts/Game |
---|---|---|---|---|---|---|
34 (2.4 p/g) | 448 (32.0 p/g) | 139 (2.8 p/tgt) | 137 (2.7 p/tgt) | 4 (11.4% rate) | 7.4 | 7.1 (+0.86 diff) |
#80 | #79 | #89 | #118 | #47 | #78 | #79 |
Target Accuracy | Yards Per Route Run | Formation Adjusted Yards Per Route Run Formation Adjusted YPRR | Yards Per Target YPT | Yards Per Reception YPR | Yards Per Team Pass Attempt Yards/Team Pass Attempt | True Catch Rate |
---|---|---|---|---|---|---|
143.0 | 1.13 | 1.00 | 9.0 | 13.2 | 0.97 | 85.0% (68.0% actual) |
#87 | #94 | #85 | #34 | #43 | #77 | #61 |
Target Separation | Average Cushion | Target Premium | Dominator Rating | Juke Rate | Drops | Contested Catch Rate Contested Catch % |
---|---|---|---|---|---|---|
2.14 | 4.31 | +11.2% | 14.6% | - | 4 (8.0% rate) | 16.7% (6 tgts) |
#9 | #8 | #55 | #81 | - | #38 | #102 |
Production Premium | Expected Points Added (EPA) EPA | QB Rating Per Target QB Rating Per Target | Best Ball Points Added Best Ball Pts Added | Fantasy Points Per Route Run Fantasy Points Per Route | Fantasy Points Per Target Fantasy Points Per Target | Total Fantasy Points Total Fantasy Pts |
---|---|---|---|---|---|---|
-0.2 | +40.0 | 122.8 | 20.3 (1.5 p/g) | 0.26 | 2.06 | 103.10 |
#125 | #33 | #13 | #83 | #93 | #23 | #72 |
Targets | Target Share | Target Rate | Snap Share | Slot Snaps | Routes Run | Route Participation Route % |
---|---|---|---|---|---|---|
25 (2.5 p/g) | 7.0% (7.5% rz) | 10.2% | 65.6% | 212 (53.4% rate) | 246 (24.6 p/g) | 66.3% |
#120 | - | - | #86 | #36 | #83 | - |
Air Yards | Air Yards Share | Average Target Distance (ADOT) Target Depth (ADOT) | Deep Targets | Red Zone Targets Red Zone Tgts | Target Quality Rating | Catchable Target Rate |
---|---|---|---|---|---|---|
233 (23.3 p/g) | 8.2% | 9.3 | 2 (0.2 p/g) | 4 (4 rec) | 5.54 | 76.0% (19 tgts) |
- | - | - | #143 | #102 | - | - |
Receptions Recs | Receiving Yards Rec Yards | Yards After Catch YAC | Unrealized Air Yards | Total TDs | Fantasy Points Per Game Fantasy Pts/Game | Expected Fantasy Points Per Game Expected Fantasy Pts/Game |
---|---|---|---|---|---|---|
18 (1.8 p/g) | 234 (23.4 p/g) | 108 (4.3 p/tgt) | 107 (4.3 p/tgt) | 5 (27.8% rate) | 7.1 | - |
#112 | #108 | #86 | - | #38 | #74 | - |
Target Accuracy | Yards Per Route Run | Formation Adjusted Yards Per Route Run Formation Adjusted YPRR | Yards Per Target YPT | Yards Per Reception YPR | Yards Per Team Pass Attempt Yards/Team Pass Attempt | True Catch Rate |
---|---|---|---|---|---|---|
7.8 | 0.95 | - | 9.4 | 13.0 | 0.63 | 94.7% (72.0% actual) |
- | - | - | - | - | - | - |
Target Separation | Average Cushion | Target Premium | Dominator Rating | Juke Rate | Drops | Contested Catch Rate Contested Catch % |
---|---|---|---|---|---|---|
1.76 | 3.85 | +34.1% | 14.6% | - | 1 (4.0% rate) | 25.0% (4 tgts) |
- | - | - | #79 | - | #112 | - |
Production Premium | Expected Points Added (EPA) EPA | QB Rating Per Target QB Rating Per Target | Best Ball Points Added Best Ball Pts Added | Fantasy Points Per Route Run Fantasy Points Per Route | Fantasy Points Per Target Fantasy Points Per Target | Total Fantasy Points Total Fantasy Pts |
---|---|---|---|---|---|---|
+65.3 | +21.5 | 124.0 | 10.8 (1.1 p/g) | 0.29 | 2.86 | 71.40 |
- | #228 | - | #94 | - | - | #93 |
Targets | Target Share | Target Rate | Snap Share | Slot Snaps | Routes Run | Route Participation Route % |
---|---|---|---|---|---|---|
44 (3.4 p/g) | 10.7% (14.3% rz) | 17.4% | 59.3% | 95 (20.3% rate) | 253 (19.5 p/g) | 60.1% |
#95 | #98 | #100 | #100 | #86 | #81 | #85 |
Air Yards | Air Yards Share | Average Target Distance (ADOT) Target Depth (ADOT) | Deep Targets | Red Zone Targets Red Zone Tgts | Target Quality Rating | Catchable Target Rate |
---|---|---|---|---|---|---|
566 (43.5 p/g) | 15.3% | 12.9 | - (0.0 p/g) | 10 (4 rec) | 5.59 | 70.5% (31 tgts) |
#82 | #90 | #33 | - | #45 | #58 | #85 |
Receptions Recs | Receiving Yards Rec Yards | Yards After Catch YAC | Unrealized Air Yards | Total TDs | Fantasy Points Per Game Fantasy Pts/Game | Expected Fantasy Points Per Game Expected Fantasy Pts/Game |
---|---|---|---|---|---|---|
28 (2.2 p/g) | 427 (32.8 p/g) | 95 (2.2 p/tgt) | 234 (5.3 p/tgt) | 5 | 7.7 | - |
#88 | #78 | #95 | #101 | #33 | #74 | - |
Target Accuracy | Yards Per Route Run | Formation Adjusted Yards Per Route Run Formation Adjusted YPRR | Yards Per Target YPT | Yards Per Reception YPR | Yards Per Team Pass Attempt Yards/Team Pass Attempt | True Catch Rate |
---|---|---|---|---|---|---|
7.4 | 1.69 | - | 9.7 | 15.2 | 1.01 | 90.3% (63.6% actual) |
#25 | #61 | - | #18 | #19 | #80 | #8 |
Target Separation | Average Cushion | Target Premium | Dominator Rating | Juke Rate | Drops | Contested Catch Rate Contested Catch % |
---|---|---|---|---|---|---|
1.00 | 4.58 | +12.4% | 17.3% | - | 2 (4.5% rate) | 55.6% (9 tgts) |
#102 | #10 | #29 | #62 | - | #80 | #24 |
Production Premium | Expected Points Added (EPA) EPA | QB Rating Per Target QB Rating Per Target | Best Ball Points Added Best Ball Pts Added | Fantasy Points Per Route Run Fantasy Points Per Route | Fantasy Points Per Target Fantasy Points Per Target | Total Fantasy Points Total Fantasy Pts |
---|---|---|---|---|---|---|
+21.0 | - | 133.4 | 37.7 (2.9 p/g) | 0.40 | 2.29 | 100.70 |
- | - | #3 | #93 | #57 | #8 | #74 |
Week Wk | Opponent Opp | Primary Corner Primary Corner | Snap Share Snap Share | Routes Routes | Targets Targets | Receptions Receptions | Receiving Yards Receiving Yards | Fantasy Points Fantasy Points |
---|---|---|---|---|---|---|---|---|
7 | SEA | Ugo Amadi | 55.4% | 24 | 3 | 1 | 11 (44 air) | 2.1 (#78) |
8 | TB | Pierre Desir | 62.0% | 22 | 3 (2 rz) | 3 (1 tds) | 33 (24 air) | 12.3 (#31) |
9 | ATL | Erik Harris | 66.7% | 38 | 4 | 3 | 53 (50 air) | 8.3 (#43) |
10 | TEN | Janoris Jenkins | 76.6% | 39 | 7 (3 rz) | 4 (1 tds) | 44 (46 air) | 14.4 (#19) |
11 | PHI | Avonte Maddox | 91.9% | 38 | 8 | 5 | 64 (92 air) | 11.4 (#32) |
12 | BUF | Taron Johnson | 75.9% | 26 | 5 | 4 | 31 (49 air) | 7.1 (#52) |
13 | DAL | Anthony Brown | 72.5% | 33 | 7 | 2 | 15 (68 air) | 3.5 (#69) |
14 | NYJ | Javelin Guidry | 67.6% | 18 | 3 | 3 | 33 (23 air) | 6.3 (#63) |
15 | TB | Pierre Desir | 68.3% | 19 | 3 (1 rz) | 2 | 17 (22 air) | 3.7 (#76) |
16 | MIA | Xavien Howard | 32.7% | 9 | 0 | 0 | 0 | 0.0 (#116) |
18 | ATL | A.J. Terrell | 70.4% | 19 | 7 (2 rz) | 5 (1 tds) | 76 (66 air) | 18.6 (#22) |
Week Wk | Opponent Opp | Primary Corner Primary Corner | Snap Share Snap Share | Routes Routes | Targets Targets | Receptions Receptions | Receiving Yards Receiving Yards | Fantasy Points Fantasy Points |
---|---|---|---|---|---|---|---|---|
1 | TB | Sean Murphy-Bunting | 66.7% | 24 | 1 | 1 | 4 (4 air) | 1.4 (#114) |
2 | LV | Damon Arnette | 72.5% | 34 | 7 (1 rz) | 5 | 86 (66 air) | 13.6 (#29) |
3 | GB | Kevin King | 103.6% | 37 | 6 (1 rz) | 4 | 42 (40 air) | 8.2 (#57) |
4 | DET | Desmond Trufant | 72.0% | 25 | 4 (2 rz) | 4 (2 tds) | 54 (50 air) | 21.4 (#11) |
5 | LAC | Desmond King | 65.6% | 42 | 3 | 2 | 8 (15 air) | 2.8 (#87) |
7 | CAR | Troy Pride | 85.9% | 36 | 4 | 4 | 54 (37 air) | 9.4 (#50) |
8 | CHI | Buster Skrine | 70.0% | 42 | 7 | 5 | 43 (82 air) | 9.3 (#44) |
9 | TB | Jamel Dean | 53.4% | 25 | 2 (2 rz) | 1 (1 tds) | 14 (21 air) | 8.4 (#58) |
10 | SF | Jamar Taylor | 21.7% | 11 | 1 (1 rz) | 0 | 0 (5 air) | 0.0 (#99) |
11 | ATL | Isaiah Oliver | 67.7% | 20 | 0 | 0 | 0 | 0.0 (#112) |
12 | DEN | - | 47.6% | 13 | 1 | 1 | 16 (-3 air) | 2.6 (#90) |
13 | ATL | Darqueze Dennard | 78.1% | 31 | 6 (1 rz) | 3 (1 tds) | 42 (41 air) | 13.5 (#39) |
14 | PHI | Nickell Robey-Coleman | 87.3% | 40 | 6 | 3 | 60 (62 air) | 9.0 (#52) |
15 | KC | L'Jarius Sneed | 40.0% | 16 | 2 | 1 | 25 (26 air) | 3.5 (#88) |
Week Wk | Opponent Opp | Primary Corner Primary Corner | Snap Share Snap Share | Routes Routes | Targets Targets | Receptions Receptions | Receiving Yards Receiving Yards | Fantasy Points Fantasy Points |
---|---|---|---|---|---|---|---|---|
1 | HOU | Aaron Colvin | 60.9% | 24 | 2 (1 rz) | 2 (1 tds) | 26 | 10.6 (##50) |
2 | LA | Nickell Robey-Coleman | 56.4% | 17 | 3 | 3 | 49 | 7.9 (##62) |
10 | ATL | Kendall Sheffield | 89.5% | 38 | 2 | 1 | 13 | 2.3 (##77) |
11 | TB | Mike Edwards | 57.1% | 20 | 1 | 0 | 0 | 0.0 (##107) |
12 | CAR | Donte Jackson | 70.2% | 26 | 3 (1 rz) | 1 (1 tds) | 13 | 8.3 (##44) |
13 | ATL | Desmond Trufant | 73.5% | 23 | 2 | 2 | 14 | 3.4 (##85) |
14 | SF | K'Waun Williams | 79.4% | 33 | 4 (1 rz) | 2 (1 tds) | 29 | 10.9 (##43) |
15 | IND | Quincy Wilson | 54.0% | 19 | 1 | 1 (1 tds) | 21 | 9.1 (##47) |
16 | TEN | LeShaun Sims | 55.6% | 24 | 2 | 1 | 13 | 2.3 (##92) |
17 | CAR | Javien Elliott | 62.1% | 22 | 5 (1 rz) | 5 (1 tds) | 56 | 16.6 (##21) |
Week Wk | Opponent Opp | Primary Corner Primary Corner | Snap Share Snap Share | Routes Routes | Targets Targets | Receptions Receptions | Receiving Yards Receiving Yards | Fantasy Points Fantasy Points |
---|---|---|---|---|---|---|---|---|
1 | TB | M.J. Stewart | 6.9% | 2 | 1 | 0 | 0 | 0.0 (##106) |
2 | CLE | Terrance Mitchell | 41.4% | 15 | 1 | 1 | 18 | 2.8 (##100) |
4 | NYG | B.W. Webb | 34.8% | 9 | 2 (2 rz) | 0 | 0 | 0.0 (##116) |
5 | WAS | Josh Norman | 70.5% | 25 | 3 | 3 (2 tds) | 111 | 26.1 (##5) |
7 | BAL | Brandon Carr | 72.5% | 20 | 6 (1 rz) | 3 | 44 | 7.4 (##54) |
8 | MIN | Trae Waynes | 77.4% | 21 | 4 | 3 | 18 | 4.8 (##72) |
9 | LA | Troy Hill | 64.3% | 26 | 3 (1 rz) | 2 (1 tds) | 23 | 10.3 (##33) |
11 | PHI | Rasul Douglas | 71.0% | 30 | 13 (2 rz) | 10 (1 tds) | 157 | 31.7 (##3) |
13 | DAL | Byron Jones | 89.4% | 27 | 1 (1 rz) | 0 | 0 | 0.0 (##114) |
14 | TB | Ryan Smith | 63.9% | 21 | 1 | 0 | 0 | 0.0 (##112) |
15 | CAR | Donte Jackson | 62.7% | 25 | 4 (1 rz) | 2 | 15 | 3.5 (##82) |
16 | PIT | Coty Sensabaugh | 42.4% | 15 | 1 | 1 | 11 | 2.1 (##100) |
17 | CAR | Donte Jackson | 81.6% | 17 | 4 (2 rz) | 3 (1 tds) | 30 | 12.0 (##40) |
Value Over Stream: Valuation scheme calculates a player’s fantasy pts/game over the average waiver wire replacement in standard fantasy league formats during either the current season (or previous year during the offseason) and adjusts for positional bust rates. VOS rank in parenthesis spans all positions, enabling player comparisons across QB's, RB's, WR's, and TE's.
The New Orleans Saints are re-signing wide receiver Tre'Quan...
Former New Orleans Saints wide receiver Tre'Quan Smith, who ...
New Orleans Saints wide receiver Tre'Quan Smith (chest) ...
Year Year | Games Games | Receptions Recs | Receiving Yards Rec Yds | Target Share Tgt Share | Catch Rate Catch Rate | Special Teams Yards Special Teams | Age Age | School School |
---|---|---|---|---|---|---|---|---|
2014 | 0 (WR) | 0 | 0 | - | - | 0 | 18 | UCF |
2015 | 12 (WR) | 52 (95 tgts) | 724 (13.9 ypr) | 22.4% | 54.7% | 0 | 19 | UCF |
2016 | 13 (WR) | 57 (106 tgts) | 853 (15.0 ypr) | 23.6% | 53.8% | 0 | 20 | UCF |
2017 | 13 (WR) | 59 (86 tgts) | 1,171 (19.8 ypr) | 20.3% | 68.6% | 0 | 21 | UCF |