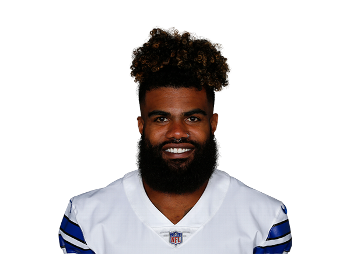
Ezekiel Elliott Not Going Anywhere
Dallas Cowboys executive vice president Stephen Jones gave a...
Year Year | Games Played Games | Rush Attempts Atts | Rush Yards Rush Yds | Yards Per Carry YPC | Receptions Rec | Receiving Yards Rec Yds | Total Touchdowns TD | Fantasy Points Per Game Fantasy Pts/Game |
---|---|---|---|---|---|---|---|---|
2021 | 17 | 237 | 1002 | 4.2 | 47 | 287 | 12 | 14.8 (#15) |
2020 | 15 | 244 | 979 | 4.0 | 52 | 338 | 8 | 14.9 (#14) |
2019 | 16 | 301 | 1357 | 4.5 | 54 | 419 | 14 | 19.5 (#5) |
2018 | 15 | 304 | 1434 | 4.7 | 77 | 567 | 9 | 21.8 (#6) |
2017 | 10 | 242 | 983 | 4.1 | 26 | 269 | 9 | 20.3 (#3) |
2016 | 15 | 322 | 1631 | 5.1 | 32 | 363 | 16 | 21.7 (#3) |
Snap Share | Opportunity Share | Weighted Opportunities | Team Run Plays Per Game Team Run Plays/Gm | Carries | Targets | Red Zone Touches |
---|---|---|---|---|---|---|
65.9% | 57.7% | 244.3 (14.4 p/g) | 27.6 (2.21 pace) | 237 (13.9 p/g) | 65 (3.8 p/g) | 50 (12 gl) |
#10 | #20 | #6 | #8 | #7 | #7 | #5 |
Rushing Yards | Receiving Yards | Receptions | Total TDs | Fantasy Points Per Opportunity Fantasy Pts/Opportunity | Fantasy Points Per Game | Expected Fantasy Points Per Game Expected Fantasy Pts/Gm |
---|---|---|---|---|---|---|
1002 (58.9 p/g) | 287 (16.9 p/g) | 47 (2.8 p/g) | 12 (4.2% rate) | 0.83 | 14.8 (-0.27) | 15.1 (-0.27diff) |
#7 | #27 | #9 | #6 | #31 | #15 | #15 |
Target Share | Routes Run | Route Participation Route % | Yards Per Reception | Yards Per Route Run | Catch Rate Catch Rate | Drops |
---|---|---|---|---|---|---|
10.2% | 332 (19.5 p/g) | 51.3% | 6.1 (4.4 ypt) | 0.86 | 72.3% | 3 (4.6% rate) |
#22 | #3 | #11 | #28 | #30 | #22 | #17 |
True Yards Per Carry | Yards Per Touch | Juke Rate | Evaded Tackles | Breakaway Run Rate | Breakaway Runs | Best Ball Points Added |
---|---|---|---|---|---|---|
4.1 (4.2 ypc) | 4.5 | 26.1% | 74 (4.4 p/g) | 2.5% | 6 (0.4 p/g) | 122.8 (7.22 p/g) |
#39 | #35 | #25 | #10 | #45 | #32 | #9 |
Yards Created | Yards Created Per Touch Yards Created/Touch | Production Premium | Expected Points Added (EPA) Expected Pts Added | Dominator Rating | Game Script | Run Blocking Rating |
---|---|---|---|---|---|---|
647 (38.1 p/g) | 2.28 | -6.0 | -10.8 | 20.2% | +3.61 | 62.4 |
#14 | #37 | #39 | #127 | #25 | #2 | #30 |
Average Defenders In The Box Defenders In The Box | Stacked Front Carry Rate Stacked Front Carry % | Base Front Carry Rate Base Front Carry % | Light Front Carry Rate Light Front Carry % | Shotgun Carry Rate Shotgun Carry % | Under Center Carry Rate Under Center Carry % | Stuffed Runs |
---|---|---|---|---|---|---|
6.8 | 24.1% (4.0 ypc) | 35.9% (4.1 ypc) | 38.8% (4.5 ypc) | 28.7% (1.0 ypc) | 71.3% (1.0 ypc) | 34 (14.3% rate) |
#11 | #5 | #18 | #43 | #34 | #25 | #10 |
Snap Share | Opportunity Share | Weighted Opportunities | Team Run Plays Per Game Team Run Plays/Gm | Carries | Targets | Red Zone Touches |
---|---|---|---|---|---|---|
72.4% | 71.9% | 257.9 (17.2 p/g) | - (2.36 pace) | 244 (16.3 p/g) | 71 (4.7 p/g) | 51 (16 gl) |
#4 | #9 | #4 | - | #5 | #4 | #9 |
Rushing Yards | Receiving Yards | Receptions | Total TDs | Fantasy Points Per Opportunity Fantasy Pts/Opportunity | Fantasy Points Per Game | Expected Fantasy Points Per Game Expected Fantasy Pts/Gm |
---|---|---|---|---|---|---|
979 (65.3 p/g) | 338 (22.5 p/g) | 52 (3.5 p/g) | 8 (2.7% rate) | 0.71 | 14.9 | - |
#10 | #15 | #8 | #19 | #63 | #14 | - |
Target Share | Routes Run | Route Participation Route % | Yards Per Reception | Yards Per Route Run | Catch Rate Catch Rate | Drops |
---|---|---|---|---|---|---|
12.2% | 362 (24.1 p/g) | 59.9% | 6.5 (4.8 ypt) | 0.93 | 73.2% | 6 (8.5% rate) |
#13 | #2 | - | #28 | #30 | #25 | #4 |
True Yards Per Carry | Yards Per Touch | Juke Rate | Evaded Tackles | Breakaway Run Rate | Breakaway Runs | Best Ball Points Added |
---|---|---|---|---|---|---|
3.9 (4.0 ypc) | 4.4 | 23.3% | 69 (4.6 p/g) | 1.6% | 4 (0.3 p/g) | 114.6 (7.64 p/g) |
#56 | #51 | #23 | #9 | - | #38 | #10 |
Yards Created | Yards Created Per Touch Yards Created/Touch | Production Premium | Expected Points Added (EPA) Expected Pts Added | Dominator Rating | Game Script | Run Blocking Rating |
---|---|---|---|---|---|---|
680 (45.3 p/g) | 2.30 | -5.3 | - | 22.4% | -4.70 | - |
#10 | #41 | #93 | - | #16 | #132 | - |
Average Defenders In The Box Defenders In The Box | Stacked Front Carry Rate Stacked Front Carry % | Base Front Carry Rate Base Front Carry % | Light Front Carry Rate Light Front Carry % | Shotgun Carry Rate Shotgun Carry % | Under Center Carry Rate Under Center Carry % | Stuffed Runs |
---|---|---|---|---|---|---|
6.5 | 12.7% (2.9 ypc) | 40.2% (3.3 ypc) | 46.3% (5.0 ypc) | 34.0% (3.9 ypc) | 66.0% (4.0 ypc) | 41 (16.8% rate) |
#62 | #56 | #30 | #18 | #41 | #28 | #7 |
Snap Share | Opportunity Share | Weighted Opportunities | Team Run Plays Per Game Team Run Plays/Gm | Carries | Targets | Red Zone Touches |
---|---|---|---|---|---|---|
84.3% | 77.5% | 293.6 (18.4 p/g) | - (2.35 pace) | 301 (18.8 p/g) | 72 (4.5 p/g) | 68 (12 gl) |
#5 | #5 | #3 | - | #2 | #9 | #1 |
Rushing Yards | Receiving Yards | Receptions | Total TDs | Fantasy Points Per Opportunity Fantasy Pts/Opportunity | Fantasy Points Per Game | Expected Fantasy Points Per Game Expected Fantasy Pts/Gm |
---|---|---|---|---|---|---|
1357 (84.8 p/g) | 419 (26.2 p/g) | 54 (3.4 p/g) | 14 (3.9% rate) | 0.84 | 19.5 | - |
#4 | #12 | #9 | #5 | #61 | #5 | - |
Target Share | Routes Run | Route Participation Route % | Yards Per Reception | Yards Per Route Run | Catch Rate Catch Rate | Drops |
---|---|---|---|---|---|---|
12.5% | 344 (21.5 p/g) | 57.6% | 7.8 (5.8 ypt) | 1.22 | 75.0% | 7 (9.7% rate) |
#16 | #2 | #3 | #17 | #37 | #27 | #3 |
True Yards Per Carry | Yards Per Touch | Juke Rate | Evaded Tackles | Breakaway Run Rate | Breakaway Runs | Best Ball Points Added |
---|---|---|---|---|---|---|
4.4 (4.5 ypc) | 5.0 | 22.3% | 79 (4.9 p/g) | 3.0% | 9 (0.6 p/g) | 178.8 (11.20 p/g) |
#17 | #23 | #27 | #10 | #39 | #14 | #3 |
Yards Created | Yards Created Per Touch Yards Created/Touch | Production Premium | Expected Points Added (EPA) Expected Pts Added | Dominator Rating | Game Script | Run Blocking Rating |
---|---|---|---|---|---|---|
425 (26.6 p/g) | 1.20 | -0.2 | - | 27.2% | +0.84 | - |
#11 | #32 | #38 | - | #10 | #9 | - |
Average Defenders In The Box Defenders In The Box | Stacked Front Carry Rate Stacked Front Carry % | Base Front Carry Rate Base Front Carry % | Light Front Carry Rate Light Front Carry % | Shotgun Carry Rate Shotgun Carry % | Under Center Carry Rate Under Center Carry % | Stuffed Runs |
---|---|---|---|---|---|---|
6.7 | 15.6% (2.9 ypc) | 41.5% (4.2 ypc) | 42.9% (5.2 ypc) | 33.2% (4.3 ypc) | 66.8% (4.5 ypc) | 34 (11.3% rate) |
#28 | #35 | #40 | #28 | #32 | #26 | #23 |
Snap Share | Opportunity Share | Weighted Opportunities | Team Run Plays Per Game Team Run Plays/Gm | Carries | Targets | Red Zone Touches |
---|---|---|---|---|---|---|
93.8% | 90.1% | 331.6 (22.1 p/g) | - (2.14 pace) | 304 (20.3 p/g) | 95 (6.3 p/g) | 51 (7 gl) |
#2 | #1 | #2 | - | #1 | #5 | #5 |
Rushing Yards | Receiving Yards | Receptions | Total TDs | Fantasy Points Per Opportunity Fantasy Pts/Opportunity | Fantasy Points Per Game | Expected Fantasy Points Per Game Expected Fantasy Pts/Gm |
---|---|---|---|---|---|---|
1434 (95.6 p/g) | 567 (37.8 p/g) | 77 (5.1 p/g) | 9 (2.4% rate) | 0.82 | 21.8 | - |
#1 | #8 | #5 | #14 | #68 | #6 | - |
Target Share | Routes Run | Route Participation Route % | Yards Per Reception | Yards Per Route Run | Catch Rate Catch Rate | Drops |
---|---|---|---|---|---|---|
20.0% | 266 (17.7 p/g) | 55.1% | 7.4 (6.0 ypt) | 2.13 | 81.1% | 3 (3.2% rate) |
#5 | #6 | #5 | #24 | #12 | #8 | #15 |
True Yards Per Carry | Yards Per Touch | Juke Rate | Evaded Tackles | Breakaway Run Rate | Breakaway Runs | Best Ball Points Added |
---|---|---|---|---|---|---|
4.5 (4.7 ypc) | 5.3 | 24.9% | 95 (6.3 p/g) | 7.6% | 23 (1.5 p/g) | 187.9 (12.50 p/g) |
#19 | #21 | #28 | #2 | #8 | #1 | #5 |
Yards Created | Yards Created Per Touch Yards Created/Touch | Production Premium | Expected Points Added (EPA) Expected Pts Added | Dominator Rating | Game Script | Run Blocking Rating |
---|---|---|---|---|---|---|
540 (36.0 p/g) | 1.42 | -2.7 | - | 33.5% | +1.20 | - |
#3 | #26 | #45 | - | #6 | #11 | - |
Average Defenders In The Box Defenders In The Box | Stacked Front Carry Rate Stacked Front Carry % | Base Front Carry Rate Base Front Carry % | Light Front Carry Rate Light Front Carry % | Shotgun Carry Rate Shotgun Carry % | Under Center Carry Rate Under Center Carry % | Stuffed Runs |
---|---|---|---|---|---|---|
7.1 | 28.3% (4.2 ypc) | 45.4% (4.8 ypc) | 26.3% (5.2 ypc) | 28.3% (4.7 ypc) | 71.7% (4.7 ypc) | 51 (16.8% rate) |
#14 | #12 | #37 | #50 | #36 | #25 | #4 |
Snap Share | Opportunity Share | Weighted Opportunities | Team Run Plays Per Game Team Run Plays/Gm | Carries | Targets | Red Zone Touches |
---|---|---|---|---|---|---|
88.8% | 88.1% | 204.9 (20.5 p/g) | - (2.20 pace) | 242 (24.2 p/g) | 38 (3.8 p/g) | 43 (7 gl) |
#2 | #2 | #15 | - | #10 | #34 | #7 |
Rushing Yards | Receiving Yards | Receptions | Total TDs | Fantasy Points Per Opportunity Fantasy Pts/Opportunity | Fantasy Points Per Game | Expected Fantasy Points Per Game Expected Fantasy Pts/Gm |
---|---|---|---|---|---|---|
983 (98.3 p/g) | 269 (26.9 p/g) | 26 (2.6 p/g) | 9 (3.4% rate) | 0.73 | 20.3 | - |
#10 | #26 | #42 | #8 | #74 | #3 | - |
Target Share | Routes Run | Route Participation Route % | Yards Per Reception | Yards Per Route Run | Catch Rate Catch Rate | Drops |
---|---|---|---|---|---|---|
11.9% | 153 (15.3 p/g) | 47.1% | 10.3 (7.1 ypt) | 1.76 | 68.4% | 4 (10.5% rate) |
#18 | #26 | #8 | #4 | #29 | #37 | #17 |
True Yards Per Carry | Yards Per Touch | Juke Rate | Evaded Tackles | Breakaway Run Rate | Breakaway Runs | Best Ball Points Added |
---|---|---|---|---|---|---|
4.0 (4.1 ypc) | 4.7 | 21.3% | 57 (5.7 p/g) | 2.9% | 7 (0.7 p/g) | 120.5 (12.10 p/g) |
#25 | #25 | #35 | #17 | #36 | #24 | #9 |
Yards Created | Yards Created Per Touch Yards Created/Touch | Production Premium | Expected Points Added (EPA) Expected Pts Added | Dominator Rating | Game Script | Run Blocking Rating |
---|---|---|---|---|---|---|
356 (35.6 p/g) | 1.33 | -6.5 | - | 33.4% | +0.72 | - |
#14 | #25 | #47 | - | #2 | #11 | - |
Average Defenders In The Box Defenders In The Box | Stacked Front Carry Rate Stacked Front Carry % | Base Front Carry Rate Base Front Carry % | Light Front Carry Rate Light Front Carry % | Shotgun Carry Rate Shotgun Carry % | Under Center Carry Rate Under Center Carry % | Stuffed Runs |
---|---|---|---|---|---|---|
0.0 | 5.8% (3.7 ypc) | 57.4% (3.7 ypc) | 35.1% (4.8 ypc) | 0.0% (0.0 ypc) | 0.0% (0.0 ypc) | 33 (13.6% rate) |
- | #21 | #58 | #38 | - | - | #29 |
Snap Share | Opportunity Share | Weighted Opportunities | Team Run Plays Per Game Team Run Plays/Gm | Carries | Targets | Red Zone Touches |
---|---|---|---|---|---|---|
0.0% | 76.1% | 256.0 (17.1 p/g) | - (2.10 pace) | 322 (21.5 p/g) | 40 (2.7 p/g) | 41 (8 gl) |
- | #5 | #5 | - | #1 | #30 | #11 |
Rushing Yards | Receiving Yards | Receptions | Total TDs | Fantasy Points Per Opportunity Fantasy Pts/Opportunity | Fantasy Points Per Game | Expected Fantasy Points Per Game Expected Fantasy Pts/Gm |
---|---|---|---|---|---|---|
1631 (108.7 p/g) | 363 (24.2 p/g) | 32 (2.1 p/g) | 16 (4.5% rate) | 0.90 | 21.7 | - |
#1 | #12 | #26 | #3 | #46 | #3 | - |
Target Share | Routes Run | Route Participation Route % | Yards Per Reception | Yards Per Route Run | Catch Rate Catch Rate | Drops |
---|---|---|---|---|---|---|
8.9% | - (0.0 p/g) | 0.0% | 11.3 (9.1 ypt) | 0.00 | 80.0% | 1 (2.5% rate) |
#22 | - | - | #3 | - | #7 | #49 |
True Yards Per Carry | Yards Per Touch | Juke Rate | Evaded Tackles | Breakaway Run Rate | Breakaway Runs | Best Ball Points Added |
---|---|---|---|---|---|---|
4.7 (5.1 ypc) | 5.6 | 25.1% | 89 (5.9 p/g) | 5.3% | 17 (1.1 p/g) | 197.9 (13.20 p/g) |
#11 | #13 | #21 | #3 | #17 | #2 | #4 |
Yards Created | Yards Created Per Touch Yards Created/Touch | Production Premium | Expected Points Added (EPA) Expected Pts Added | Dominator Rating | Game Script | Run Blocking Rating |
---|---|---|---|---|---|---|
464 (30.9 p/g) | 1.31 | +21.1 | - | 33.4% | +3.35 | - |
#4 | #17 | #12 | - | #3 | #3 | - |
Average Defenders In The Box Defenders In The Box | Stacked Front Carry Rate Stacked Front Carry % | Base Front Carry Rate Base Front Carry % | Light Front Carry Rate Light Front Carry % | Shotgun Carry Rate Shotgun Carry % | Under Center Carry Rate Under Center Carry % | Stuffed Runs |
---|---|---|---|---|---|---|
0.0 | 22.7% (3.5 ypc) | 46.6% (5.3 ypc) | 30.7% (5.7 ypc) | 0.0% (0.0 ypc) | 0.0% (0.0 ypc) | 48 (15.0% rate) |
- | #3 | #73 | #47 | - | - | #10 |
Week Wk | Opponent Opp | Snap Share Snap Share | Carries Carries | Routes Routes | Targets Targets | Receptions Receptions | Total Yards Total Yards | Total TDs Total TDs | Fantasy Points Fantasy Points |
---|---|---|---|---|---|---|---|---|---|
1 | TB | 83.1% | 11 (1 rz) | 27 | 2 | 2 | 39 | 0 | 5.9 (#45) |
2 | LAC | 73.3% | 16 (3 rz) | 17 | 2 | 2 | 97 | 1 | 17.7 (#10) |
3 | PHI | 71.4% | 17 (6 rz) | 20 | 3 | 3 | 116 | 2 | 26.6 (#3) |
4 | CAR | 69.0% | 20 (3 rz) | 10 | 1 | 0 | 143 | 1 | 20.3 (#11) |
5 | NYG | 60.8% | 21 (6 rz) | 18 | 3 | 2 | 112 | 2 | 25.2 (#8) |
6 | NE | 71.1% | 17 (3 rz) | 27 | 9 | 7 | 119 | 0 | 18.9 (#14) |
8 | MIN | 77.6% | 16 (0 rz) | 26 | 6 | 4 | 73 | 0 | 11.3 (#27) |
9 | DEN | 48.3% | 10 (0 rz) | 18 | 3 | 3 | 76 | 0 | 12.6 (#21) |
10 | ATL | 51.4% | 14 (6 rz) | 12 | 3 | 3 | 56 | 2 | 20.8 (#10) |
11 | KC | 68.8% | 9 (1 rz) | 29 | 6 | 6 | 68 | 0 | 12.8 (#17) |
12 | LV | 64.3% | 9 (1 rz) | 32 | 8 | 6 | 49 | 1 | 16.9 (#15) |
13 | NO | 61.3% | 13 (0 rz) | 18 | 3 | 2 | 47 | 0 | 6.7 (#35) |
14 | WAS | 66.7% | 12 (1 rz) | 22 | 6 | 1 | 60 | 0 | 9.0 (#31) |
15 | NYG | 62.0% | 16 (4 rz) | 18 | 4 | 3 | 72 | 1 | 16.2 (#10) |
16 | WAS | 58.3% | 9 (2 rz) | 18 | 1 | 1 | 42 | 2 | 17.2 (#11) |
17 | ARI | 71.4% | 9 (0 rz) | 10 | 2 | 1 | 30 | 0 | 4.0 (#52) |
18 | PHI | 58.6% | 18 (1 rz) | 10 | 3 | 1 | 90 | 0 | 10.0 (#26) |
19 | SF | 61.8% | 12 (1 rz) | 22 | 4 | 1 | 31 | 0 | 4.1 (#20) |
Week Wk | Opponent Opp | Snap Share Snap Share | Carries Carries | Routes Routes | Targets Targets | Receptions Receptions | Total Yards Total Yards | Total TDs Total TDs | Fantasy Points Fantasy Points |
---|---|---|---|---|---|---|---|---|---|
1 | LAR | 87.0% | 22 (4 rz) | 28 | 4 | 3 | 127 | 2 | 27.7 (#3) |
2 | ATL | 92.2% | 22 (8 rz) | 36 | 7 | 6 | 122 | 1 | 22.2 (#7) |
3 | SEA | 96.3% | 14 (3 rz) | 41 | 11 | 6 | 58 | 1 | 17.8 (#13) |
4 | CLE | 78.0% | 12 (2 rz) | 35 | 8 | 8 | 125 | 0 | 20.5 (#11) |
5 | NYG | 81.3% | 19 (5 rz) | 27 | 2 | 1 | 105 | 2 | 23.5 (#4) |
6 | ARI | 58.0% | 12 (1 rz) | 27 | 10 | 8 | 80 | 0 | 12.0 (#18) |
7 | WAS | 64.2% | 12 (0 rz) | 12 | 2 | 1 | 51 | 0 | 6.1 (#38) |
8 | PHI | 76.9% | 19 (2 rz) | 31 | 2 | 1 | 73 | 0 | 8.3 (#35) |
9 | PIT | 64.8% | 18 (2 rz) | 16 | 3 | 2 | 69 | 0 | 8.9 (#30) |
11 | MIN | 70.3% | 21 (2 rz) | 16 | 2 | 2 | 114 | 1 | 19.4 (#4) |
12 | WAS | 69.1% | 10 (1 rz) | 22 | 3 | 1 | 39 | 0 | 2.9 (#56) |
13 | BAL | 67.5% | 18 (4 rz) | 24 | 6 | 4 | 95 | 0 | 13.5 (#18) |
14 | CIN | 62.0% | 12 (4 rz) | 14 | 3 | 2 | 59 | 0 | 7.9 (#32) |
16 | PHI | 54.5% | 19 (4 rz) | 12 | 4 | 4 | 139 | 0 | 17.9 (#12) |
17 | NYG | 56.3% | 14 (3 rz) | 21 | 4 | 3 | 61 | 1 | 15.1 (#19) |
Week Wk | Opponent Opp | Snap Share Snap Share | Carries Carries | Routes Routes | Targets Targets | Receptions Receptions | Total Yards Total Yards | Total TDs Total TDs | Fantasy Points Fantasy Points |
---|---|---|---|---|---|---|---|---|---|
1 | NYG | 53.2% | 13 (3 rz) | 9 | 2 | 1 | 63 | 1 | 13.3 (##18) |
2 | WAS | 70.3% | 23 (5 rz) | 10 | 2 | 2 | 120 | 1 | 20.0 (##7) |
3 | MIA | 65.2% | 19 (5 rz) | 15 | 3 | 2 | 139 | 0 | 15.9 (##14) |
4 | NO | 100.0% | 18 (3 rz) | 21 | 7 | 6 | 65 | 1 | 16.5 (##17) |
5 | GB | 96.9% | 12 (2 rz) | 33 | 4 | 2 | 91 | 1 | 17.1 (##16) |
6 | NYJ | 95.9% | 28 (10 rz) | 30 | 6 | 5 | 152 | 1 | 26.2 (##5) |
7 | PHI | 77.8% | 22 (9 rz) | 20 | 7 | 6 | 147 | 1 | 26.7 (##4) |
9 | NYG | 78.5% | 23 (2 rz) | 18 | 0 | 0 | 139 | 0 | 13.9 (##22) |
10 | MIN | 100.0% | 20 (3 rz) | 21 | 3 | 2 | 63 | 0 | 8.3 (##25) |
11 | DET | 92.9% | 16 (3 rz) | 23 | 3 | 2 | 73 | 2 | 19.3 (##6) |
12 | NE | 88.1% | 21 (2 rz) | 13 | 4 | 4 | 126 | 0 | 16.6 (##9) |
13 | BUF | 95.6% | 12 (1 rz) | 34 | 10 | 7 | 137 | 0 | 20.7 (##7) |
14 | CHI | 100.0% | 19 (6 rz) | 33 | 5 | 2 | 93 | 2 | 23.3 (##8) |
15 | LA | 69.1% | 24 (5 rz) | 9 | 4 | 3 | 160 | 2 | 31.0 (##4) |
16 | PHI | 98.3% | 13 (0 rz) | 32 | 7 | 7 | 84 | 0 | 15.4 (##17) |
17 | WAS | 65.2% | 18 (2 rz) | 23 | 5 | 3 | 124 | 2 | 27.4 (##5) |
Week Wk | Opponent Opp | Snap Share Snap Share | Carries Carries | Routes Routes | Targets Targets | Receptions Receptions | Total Yards Total Yards | Total TDs Total TDs | Fantasy Points Fantasy Points |
---|---|---|---|---|---|---|---|---|---|
1 | CAR | 100.0% | 15 (3 rz) | 15 | 4 | 3 | 86 | 1 | 17.6 (##15) |
2 | NYG | 92.0% | 17 (3 rz) | 14 | 6 | 5 | 87 | 1 | 19.7 (##7) |
3 | SEA | 100.0% | 16 (0 rz) | 22 | 8 | 3 | 138 | 0 | 15.8 (##20) |
4 | DET | 77.4% | 25 (3 rz) | 9 | 4 | 4 | 240 | 1 | 34.0 (##2) |
5 | HOU | 82.8% | 20 (3 rz) | 12 | 7 | 7 | 84 | 0 | 15.4 (##19) |
6 | JAC | 89.9% | 24 (2 rz) | 12 | 1 | 1 | 117 | 1 | 18.7 (##10) |
7 | WAS | 100.0% | 15 (0 rz) | 29 | 6 | 2 | 42 | 0 | 6.2 (##37) |
9 | TEN | 98.0% | 17 (4 rz) | 17 | 5 | 4 | 112 | 0 | 15.2 (##14) |
10 | PHI | 93.8% | 19 (5 rz) | 17 | 7 | 6 | 187 | 2 | 36.7 (##3) |
11 | ATL | 90.2% | 23 (2 rz) | 15 | 8 | 7 | 201 | 1 | 33.1 (##2) |
12 | WAS | 96.9% | 26 (3 rz) | 18 | 6 | 5 | 143 | 1 | 25.3 (##7) |
13 | NO | 100.0% | 23 (3 rz) | 13 | 6 | 6 | 136 | 1 | 25.6 (##5) |
14 | PHI | 90.0% | 28 (4 rz) | 36 | 13 | 12 | 192 | 0 | 31.2 (##2) |
15 | IND | 93.4% | 18 (2 rz) | 23 | 8 | 7 | 128 | 0 | 17.8 (##16) |
16 | TB | 95.9% | 18 (2 rz) | 14 | 6 | 5 | 109 | 0 | 15.9 (##15) |
Week Wk | Opponent Opp | Snap Share Snap Share | Carries Carries | Routes Routes | Targets Targets | Receptions Receptions | Total Yards Total Yards | Total TDs Total TDs | Fantasy Points Fantasy Points |
---|---|---|---|---|---|---|---|---|---|
1 | NYG | 81.4% | 24 (2 rz) | 3 | 5 | 5 | 140 | 0 | 19.0 (##8) |
2 | DEN | 96.9% | 9 (1 rz) | 2 | 5 | 4 | 22 | 0 | 6.2 (##41) |
3 | ARI | 97.7% | 22 (2 rz) | 11 | 4 | 3 | 94 | 1 | 18.4 (##12) |
4 | LA | 93.7% | 21 (5 rz) | 2 | 5 | 4 | 139 | 2 | 29.9 (##3) |
5 | GB | 91.5% | 29 (7 rz) | 12 | 2 | 1 | 112 | 0 | 12.2 (##20) |
7 | SF | 61.4% | 26 (8 rz) | 15 | 3 | 1 | 219 | 3 | 40.9 (##1) |
8 | WAS | 90.2% | 33 (4 rz) | 13 | 2 | 1 | 154 | 2 | 27.4 (##2) |
9 | KC | 93.8% | 27 (6 rz) | 8 | 0 | 0 | 93 | 1 | 15.3 (##12) |
16 | SEA | 95.3% | 24 (1 rz) | 27 | 7 | 4 | 118 | 0 | 15.8 (##17) |
17 | PHI | 91.9% | 27 (4 rz) | 14 | 5 | 3 | 141 | 0 | 17.1 (##14) |
Week Wk | Opponent Opp | Snap Share Snap Share | Carries Carries | Routes Routes | Targets Targets | Receptions Receptions | Total Yards Total Yards | Total TDs Total TDs | Fantasy Points Fantasy Points |
---|---|---|---|---|---|---|---|---|---|
1 | NYG | 64.0% | 20 | - | 2 tgts | 1 | 52 | 1 | 12.2 (##24) |
2 | WAS | 71.7% | 21 | - | 2 tgts | 2 | 87 | 1 | 15.7 (##12) |
3 | CHI | 78.5% | 30 | - | 2 tgts | 2 | 160 | 0 | 18.0 (##14) |
4 | SF | 66.2% | 23 | - | 1 tgts | 1 | 157 | 1 | 22.7 (##5) |
5 | CIN | 84.9% | 14 | - | 4 tgts | 3 | 172 | 2 | 32.2 (##2) |
6 | GB | 95.1% | 28 | - | 4 tgts | 2 | 174 | 0 | 19.4 (##11) |
8 | PHI | 86.5% | 22 | - | 4 tgts | 4 | 148 | 0 | 18.8 (##9) |
9 | CLE | 64.3% | 18 | - | 1 tgts | 1 | 97 | 2 | 22.7 (##5) |
10 | PIT | 75.4% | 21 | - | 2 tgts | 2 | 209 | 3 | 40.9 (##1) |
11 | BAL | 75.8% | 25 | - | 5 tgts | 4 | 127 | 0 | 16.7 (##11) |
12 | WAS | 85.2% | 20 | - | 2 tgts | 2 | 120 | 2 | 26.0 (##4) |
13 | MIN | 93.5% | 20 | - | 5 tgts | 4 | 105 | 1 | 20.5 (##10) |
14 | NYG | 71.0% | 24 | - | 2 tgts | 0 | 107 | 0 | 10.7 (##26) |
15 | TB | 85.3% | 23 | - | 3 tgts | 3 | 188 | 1 | 27.8 (##3) |
16 | DET | 56.9% | 12 | - | 1 tgts | 1 | 92 | 2 | 22.2 (##9) |
Value Over Stream: Valuation scheme calculates a player’s fantasy pts/game over the average waiver wire replacement in standard fantasy league formats during either the current season (or previous year during the offseason) and adjusts for positional bust rates. VOS rank in parenthesis spans all positions, enabling player comparisons across QB's, RB's, WR's, and TE's.
Dallas Cowboys executive vice president Stephen Jones gave a...
Dallas Cowboys running back Ezekiel Elliott is expected to ...
Dallas Cowboys running back Ezekiel Elliott (knee) said ...
Player Popularity Index (PPI) ranks PlayerProfiler page views over the last 30 days. For example, the No. 1 PPI player page is the most frequently visited page in recent weeks.
Year Year | Games Games | Rush Attempts Rush Atts | Rushing Yards Rush Yrds | Total Touchdowns TDs | Receptions Rec | Receiving Yards Rec Yrds | Target Share Tgt Share | Age Age | School School |
---|---|---|---|---|---|---|---|---|---|
2013 | 7 (RB) | 30 | 262 (2 tds) | 3 | 3 (4 tgts) | 23 | 1.1% | 18 | Ohio State |
2014 | 15 (RB) | 273 | 1,878 (18 tds) | 18 | 28 (32 tgts) | 220 | 7.8% | 19 | Ohio State |
2015 | 13 (RB) | 289 | 1,821 (23 tds) | 23 | 27 (29 tgts) | 206 | 9.0% | 20 | Ohio State |
After three years of college ball, Ezekiel Elliott declared for the 2016 NFL Draft and blazed an impressive 40 time at the combine of 4.47 seconds. He was then selected by the Dallas Cowboys with the fourth overall pick. It didn’t take long for Elliott to acclimate to the pro game; he ran for 1,631 yards and 15 touchdowns while also hauling in 32 receptions, gaining 363 yards through the air, and scoring an additional touchdown. When on the field, Elliott has been as reliable as they come among running backs. He’s played 88 of a possible 97 games and has never had a season without at least 268 touches. Being able to handle that workload is admirable, but that may be coming back to haunt Ezekiel Elliott now.
Elliott has dealt with nagging injuries, most recently a torn PCL sustained in Week 4 of the 2021 season. That contributed to low efficiency metrics in 2021, such as a 4.1 true yards per carry average (39th among running backs), 2.28 yards created per touch (44th), and a lowly 2.5-percent big run rate. However, Elliott was still effective and held enough juice and trust to fend off talented backup Tony Pollard to a reserve role. His 74 evaded tackles and 65.9-percent snap share ranked 10th at the position. Elliott made the most of his pass-catching opportunities as well. He brought in 47 of 65 receptions with only three of those targets being deemed drops. He ran 332 routes, which ranked third among running backs. His 10.2-percent target share finished 24th at the position. Despite the nagging knee injury and drop in efficiency, Elliott finished the season as the RB6 in fantasy football, living up to his ADP of the RB5 heading into the season. Elliott secured a six-year $90 million contract before the 2019 season after a lengthy holdout that included $50 million guaranteed. The Cowboys have an out on that contract in 2023. Elliott is still one of the top backs in the NFL with a secure workload in 2022, but his future afterward is hazier than expected.