
Run Blocking Efficiency is among the more underrated metrics to consider for fantasy football purposes. We know that context matters, so we should never focus on any single metric or stat on its own when analyzing players. However, we’ll look at the whole picture and how RBE fits within that context. We’ll also consider additional efficiency, opportunity, and productivity metrics as needed. For instance, with Pace of Play three weeks ago, we also considered Team Pass Plays Per Game amongst other metrics in analyzing players, which key for building fantasy football player projections. Given that context, we’ll define how we can use RBE info to our advantage and then dig into last year’s outliers.

Definition
Run Blocking Efficiency, as defined by PlayerProfiler, combines yards blocked per carry and short yards success rate into a single measurement of run blocking effectiveness across a running back’s rush attempts.
Let’s break this down a bit. First off, RBE varies by running back, even those on the same team. Secondly, two stats we’ll note throughout – yards per carry and Yards Created Per Touch.
There are cases where running backs rank highly in this metric, yet don’t create many yards on their own. This typically means that their team’s respective offensive line supports their rushing production. However, that’s not always the case, and we find running backs with a ton of Yards Created Per Touch and Evaded Tackles. For instance, a running back may rank low in Run Blocking Efficiency but create a ton of yards on his own, evading tackles and ranking highly in those metrics.
High Run Blocking Efficiency
J.D. McKissic, RB, Washington Football Team
Interestingly, 2020 RB target leader J.D. McKissic, otherwise known as Mr. Kisses, finished with a 93.7 (No. 3 among qualified running backs) Run Blocking Efficiency rating. This boggled my mind, which led me to reach out to Underworld Director of Analytics Josh Larky for support. Essentially, McKissic should thank his offensive line for his rushing production. Overall, he relied on receiving opportunity and efficiency, evidenced by his league-leading 110 targets. He also recorded 223.7 (No. 8) Weighted Opportunities despite only logging a 38.2-percent (No. 46) Opportunity Share.
JD McKissic finished 2020 with 165 touches – 85 carries, and 80 receptions ?
McKissic had 158 touches from 2016-2019 ❌ pic.twitter.com/PSq7aDmaFk
— RotoUnderworld (@rotounderworld) March 5, 2021
McKissic finished with mediocre averages of 4.3 (tied for No. 36) yards per carry and 4.2 (No. 33) True Yards Per Carry. He also didn’t create many yards on his own, evidenced by his 66 (No. 68) Yards Created, 0.40 (No. 63) Yards Created Per Touch and 16.4-percent (No. 47) Juke Rate. Not surprising, but worth noting that his offensive line boosted his production.
On the flip side, teammate Antonio Gibson finished with a 76.8 (No. 39) Run Blocking Efficiency rating. However, we know he showed explosiveness due to his 122.8 (99th-percentile) Speed Score coming out of college. Speed Score takes into consideration a player’s size-adjusted speed. The table below shows us where he falls amongst active running backs with the highest Speed Scores.
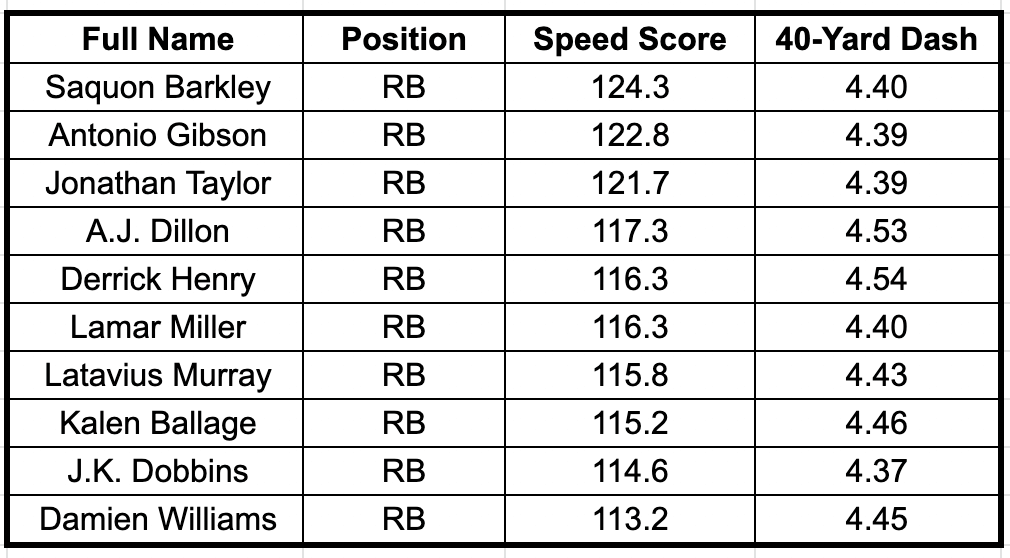
Top-10 Running Back Speed Scores
Contrary to McKissic, Gibson created yards on his own with 309 (No. 16) Yards Created, 1.50 (No. 15) Yards Created Per Touch and a 28.2-percent (No. 8) Juke Rate. Run Blocking Efficiency factors in yards per carry and Yards Created Per Touch, where he stood out compared to McKissic. Though he didn’t rank highly in this metric, it’s worth noting when comparing the two running backs for the Washington Football Team. Expect Gibson to explode in 2021.
J.K. Dobbins & Gus Edwards, RB, Baltimore Ravens
Both Ravens running backs ranked highly in Run Blocking Efficiency, as well as other efficiency metrics. J.K. Dobbins had a 92.2 (No. 5) RBE rating, and Gus Edwards an 88.5 (No. 13) RBE mark. The Baltimore running game as a whole performed efficiently, propelled by a top-ranked offensive line, and we expect that to continue in 2021 with an electric quarterback in Lamar Jackson, who also adds to the running game. Their 34.7 (No. 1) Team Run Plays Per Game average and +5.42 (No. 1) Game Script mark contributed to the running productivity and efficiency.
Will the Ravens be even more dominant with JK Dobbins in a lead back role in 2021? ? pic.twitter.com/A2zVaitnPg
— RotoUnderworld (@rotounderworld) February 18, 2021
Even with shared opportunities, both Dobbins and Edwards provided efficient production on a per touch basis. Dobbins topped the position with averages of 5.4 True Yards Per Carry and 6.0 yards per carry. Meanwhile, Edwards boasted averages of 4.8 (No. 7) True Yards Per Carry and 5.0 (tied for No. 8) yards per carry. Both backs also created yards on their own while benefiting from their offensive line. That showed up in Dobbins’ 331 (No. 11) Yards Created, 2.18 (No. 3) Yards Created Per Touch and 30.9-percent (No. 5) Juke Rate. Although Edwards didn’t create as many yards on his own, he still performed well with 203 (No. 29) Yards Created, 1.33 (No. 23) Yards Created Per Touch and an 18.3-percent (No. 37) Juke Rate.
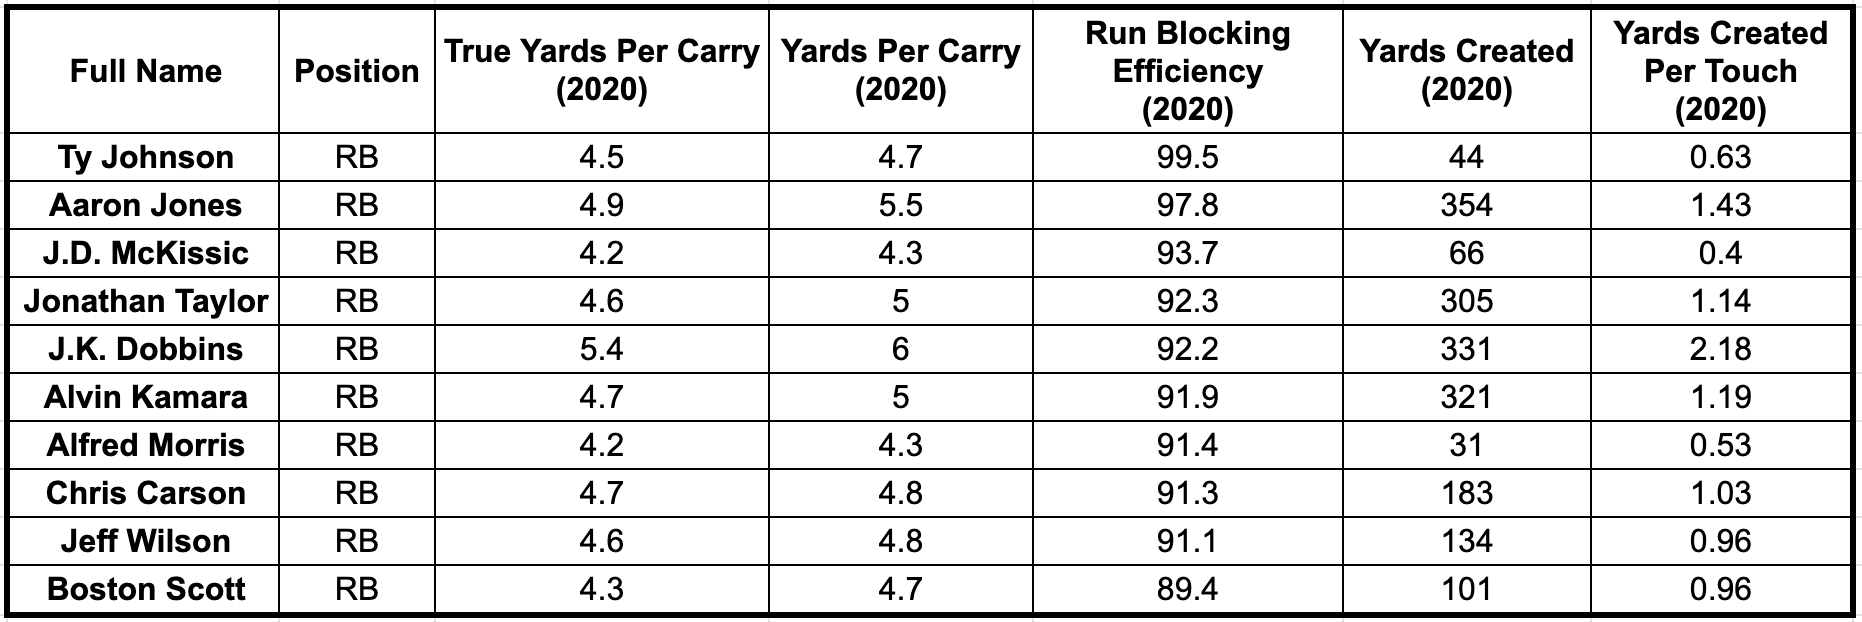
Top-10 Run Blocking Efficiency Ratings 2020
The main takeaways here involve Dobbins’ dominance with his high marks in Run Blocking Efficiency and Yards Created Per Touch, meaning he took advantage of running lanes and created yards on his own. He and Edwards will likely share touches in 2021, and hopefully, Dobbins earns more opportunities in the receiving game to add to his fantasy production. The Ravens running backs, particularly Dobbins, seem like a rare case where a player creates yards while also benefitting from their offensive line.


Low Run Blocking Efficiency
Nick Chubb & Kareem Hunt, RB, Cleveland Browns
Nick Chubb and Kareem Hunt both ranking lowly in Run Blocking Efficiency surprised me. In 2020, Chubb ranked No. 71 with a 56.9 RBE rating and Hunt ranked No. 67 with a 57.4 RBE mark. There’s no denying that the Browns have one of the best running back duos in the league. That said, they each created a ton of yards on their own with strong efficiency metrics.
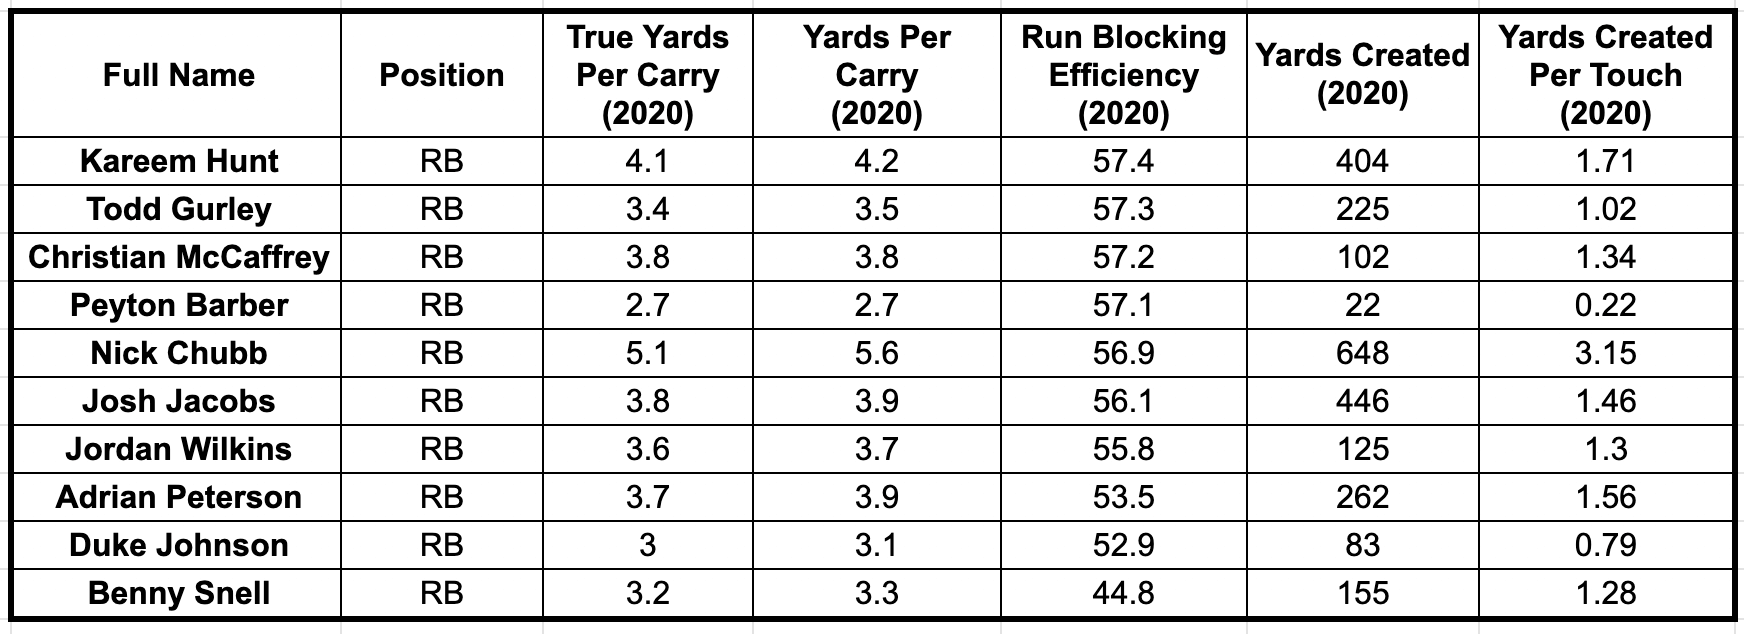
Bottom-10 Run Blocking Efficiency Ratings 2020
Chubb ranked No. 3 at the position with averages of 5.1 (No. 3) True Yards Per Carry and 5.6 (No. 3) yards per carry. Since his offensive line didn’t help much, he created a ton of yards on his own, evidenced by a 37.9-percent (No. 1) Juke Rate, 648 (No. 3) Yards Created, and a 3.15 (No. 1) Yards Created Per Touch average. Impressive efficiency metrics, all with a 51.1-percent (No. 27) Opportunity Share and 142.3 (No. 30) Weighted Opportunities.
Meanwhile, Hunt also created a ton of yards on his own with 404 (No. 7) Yards Created, a 31.4-percent (No. 4) Juke Rate, and 1.71 (No. 6) Yards Created Per Touch. However, he didn’t rank as high as Nick Chubb in terms of his 4.1 (No. 39) True Yards Per Carry and 4.2 (tied for No. 47) yards per carry. Regardless, we know they’re both elite talents with the ability to outperform what their offensive line provides. Even though Chubb’s Run Blocking Efficiency dropped from 77.5 (No. 20) in 2019 to 56.9 (No. 71) in 2020, he’ll still create yards on his own because, well, he’s a beast.
David Montgomery, RB, Chicago Bears
Earlier in the offseason, I wrote up David Montgomery as a sell-high candidate at running back in dynasty leagues, so we won’t dig too deep into him here. However, he finished with a 65.4 (No. 55) Run Blocking Efficiency rating and showed similarities to Nick Chubb and Kareem Hunt in terms of Yards Created and Evaded Tackles. Montgomery averaged 4.0 (No. 47) True Yards Per Carry and 4.3 (tied for No. 36) yards per carry. However, he ranked logged 61 (No. 11) Evaded Tackles, 449 (No. 4) Yards Created, and 1.49 (No. 16) Yards Created Per Touch.
https://www.youtube.com/watch?v=qs6ThqCe8vw
A reminder that Montgomery finished the year with a 25.7 Fantasy Points per Game average from Weeks 12-17, logging fantasy RB1 finishes in every game in that timeframe. However, expect Tarik Cohen to return and eat into the opportunities in 2021. In summary, it’s difficult to imagine Montgomery’s Run Blocking Efficiency improving given his team context.
Myles Gaskin, RB, Miami Dolphins
The Dolphins handed over the reins to Myles Gaskin and he produced well when healthy. He held the No. 10-ranked Opportunity Share at 67.5-percent, with 159.0 (No. 27) Weighted Opportunities. With 41 (No. 15) receptions and 388 (No. 7) receiving yards, his 67.8 (No. 50) Run Blocking Efficiency rating was offset by his receiving production.
gaskin still a value. ? https://t.co/9zxsSvl0hA
— the podfather (@Fantasy_Mansion) May 3, 2021
Surprisingly, Gaskin ranked well in other efficiency metrics, recording 50 (No. 16) Evaded Tackles, 223 (No. 25) Yards Created, and averaging 1.22 (No. 31) Yards Created Per Touch. In PPR leagues, his receiving production boosted him to RB1 status, helping him average 16.4 (No. 10) Fantasy Points per Game. Unless there’s a major improvement in performance across their offensive line, Gaskin and the Miami running backs may need to create yards on their own to remain productive.

