
What is an RB1? What is a WR1? Fantasy analysts have used these amorphous terms to describe tiers of fantasy assets at each position for years.
Conceptually, the terms RB1, RB2, RB3 etc. stem from the team-building ideal that your fantasy football team starts an RB1, an RB2, and an RB3 in each of its starting RB slots, and similarly with wide receivers. Thus, every team in the league can field comparably tiered players at each position.
Unfortunately, reality does not often match this tier fantasy we have created. The real life distribution of fantasy points throughout a position in a given season rarely creates tiers such that each team can have their own elite asset at the position. Instead, tiers of fantasy producers are wildly inconsistent in their makeup from year to year. Identifying the underlying structure of a position is a key skill-set needed to succeed in fantasy football.


Understanding RB and WR Tiers With Unsupervised Machine Learning
In the fantasy football industry, analysis is often predicated on the simplified understanding of tiering outlined above. “Analytic” articles perpetuating draft strategies from Robust-RB to Zero-RB often rely on identifying trends in how either the difference between tiers is compressing or expanding at different positions. The analysis is then built on an arbitrary demarcation of when a tier begins and ends, usually based on a standard size of a league, 10, 12, 16, etc.
The most obvious example of where this fails is in any sort of tight end analysis. For as long as I’ve been playing fantasy football, the tight end position has been dominated by two to three tight ends, and past that, the position flattens out. I would be wary of any analysis that goes anything like this: “Logan Thomas finished 2020 as a true TE1 as he scored the fourth-most points at the position.”
Similarly, we should not use the size of a fantasy league, or an arbitrary number of players that falls into each tier bucket, to organize player tiers at other positions. Truly understanding where our tiers begin and end is a prerequisite to doing longer-term historical analysis on how positional value has changed throughout the years.

K-Means Clustering, Data, and Results
I investigated position tiers with the K-Means Clustering algorithm, using historical running back and wide receiver data in R. To keep things brief, clustering is a mathematical technique that groups data into distinct clusters. The centroid of a cluster is more or less the average data point within that group, which can serve as a representation of the other associated points within that same cluster.
As a quick sanity check, before we dive into the more difficult running back and wide receiver positions, let’s take a look at how our clustering algorithm works with the tight end producers from 2020. Hopefully, clustering identifies an elite top tier of tight ends, and then a drop off.
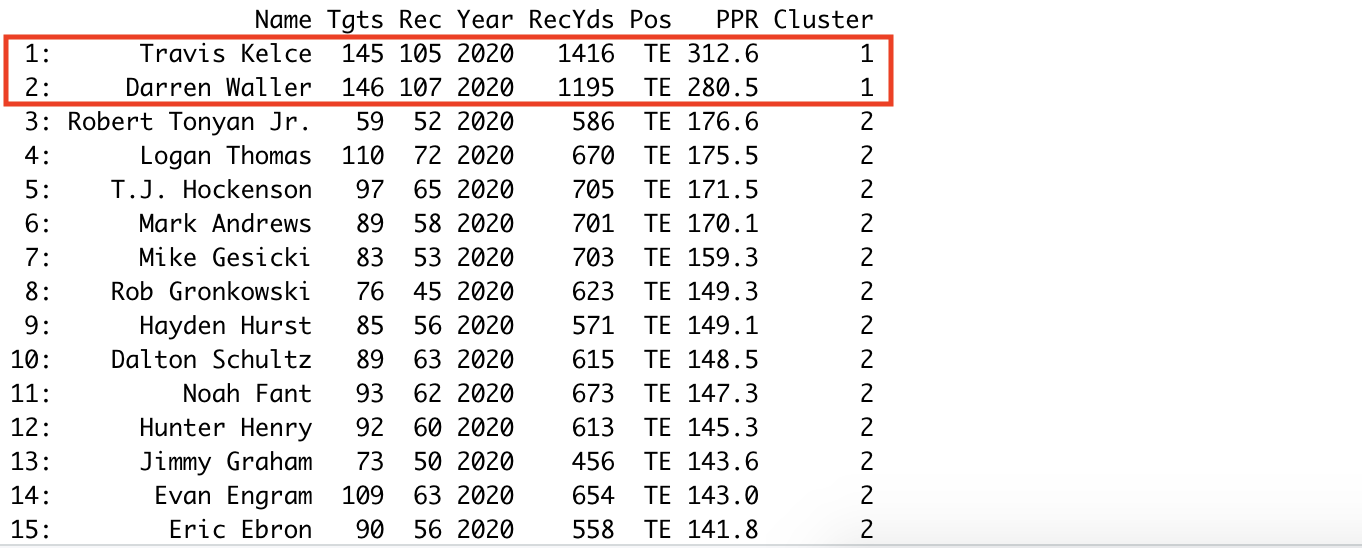
Tight End Clusters in 2020
Wow, look at how Darren Waller and Travis Kelce separated themselves from the rest of the tight ends last year. The third finishing tight end, Robert Tonyan, was more similar from a fantasy points perspective to Eric Ebron, the 15th tight end, than he was to Waller who was ranked only one spot above him. Tonyan outscored Ebron by a mere 34 points, but he was outscored by Waller by over 100. Thus, clustering places Tonyan into the same tier as Ebron, despite their large difference in rank, instead of grouping Tonyan with the elite TEs above him.
Clustering is dynamically creating vastly different sized tiers that more appropriately identify the underlying distribution of fantasy points in a given season, rather than assuming a tier system based purely on ranked finishes.
I ran the K-Means Algorithm on the top-36 RB and WR season long Fantasy Points Per Game in each year from 2010-2020, and attempted to identify what the RB1, RB2, RB3, WR1, WR2, and WR3 tiers looked like for each year. I excluded players who scored under 100 fantasy points in order to make sure I wasn’t grabbing any players who competed in only a few games but produced at an absurdly high level in the small, unreliable sample size. We don’t want to penalize players who missed a few games, but we want to restrict the sample to those who played a majority of the season.
I found points per game to be a more useful metric than season long fantasy points because it eliminated a lot of noise when it came to injuries, and accounting for injuries reduces the predictive power of an exercise like this. I used full PPR scoring for my dataset.
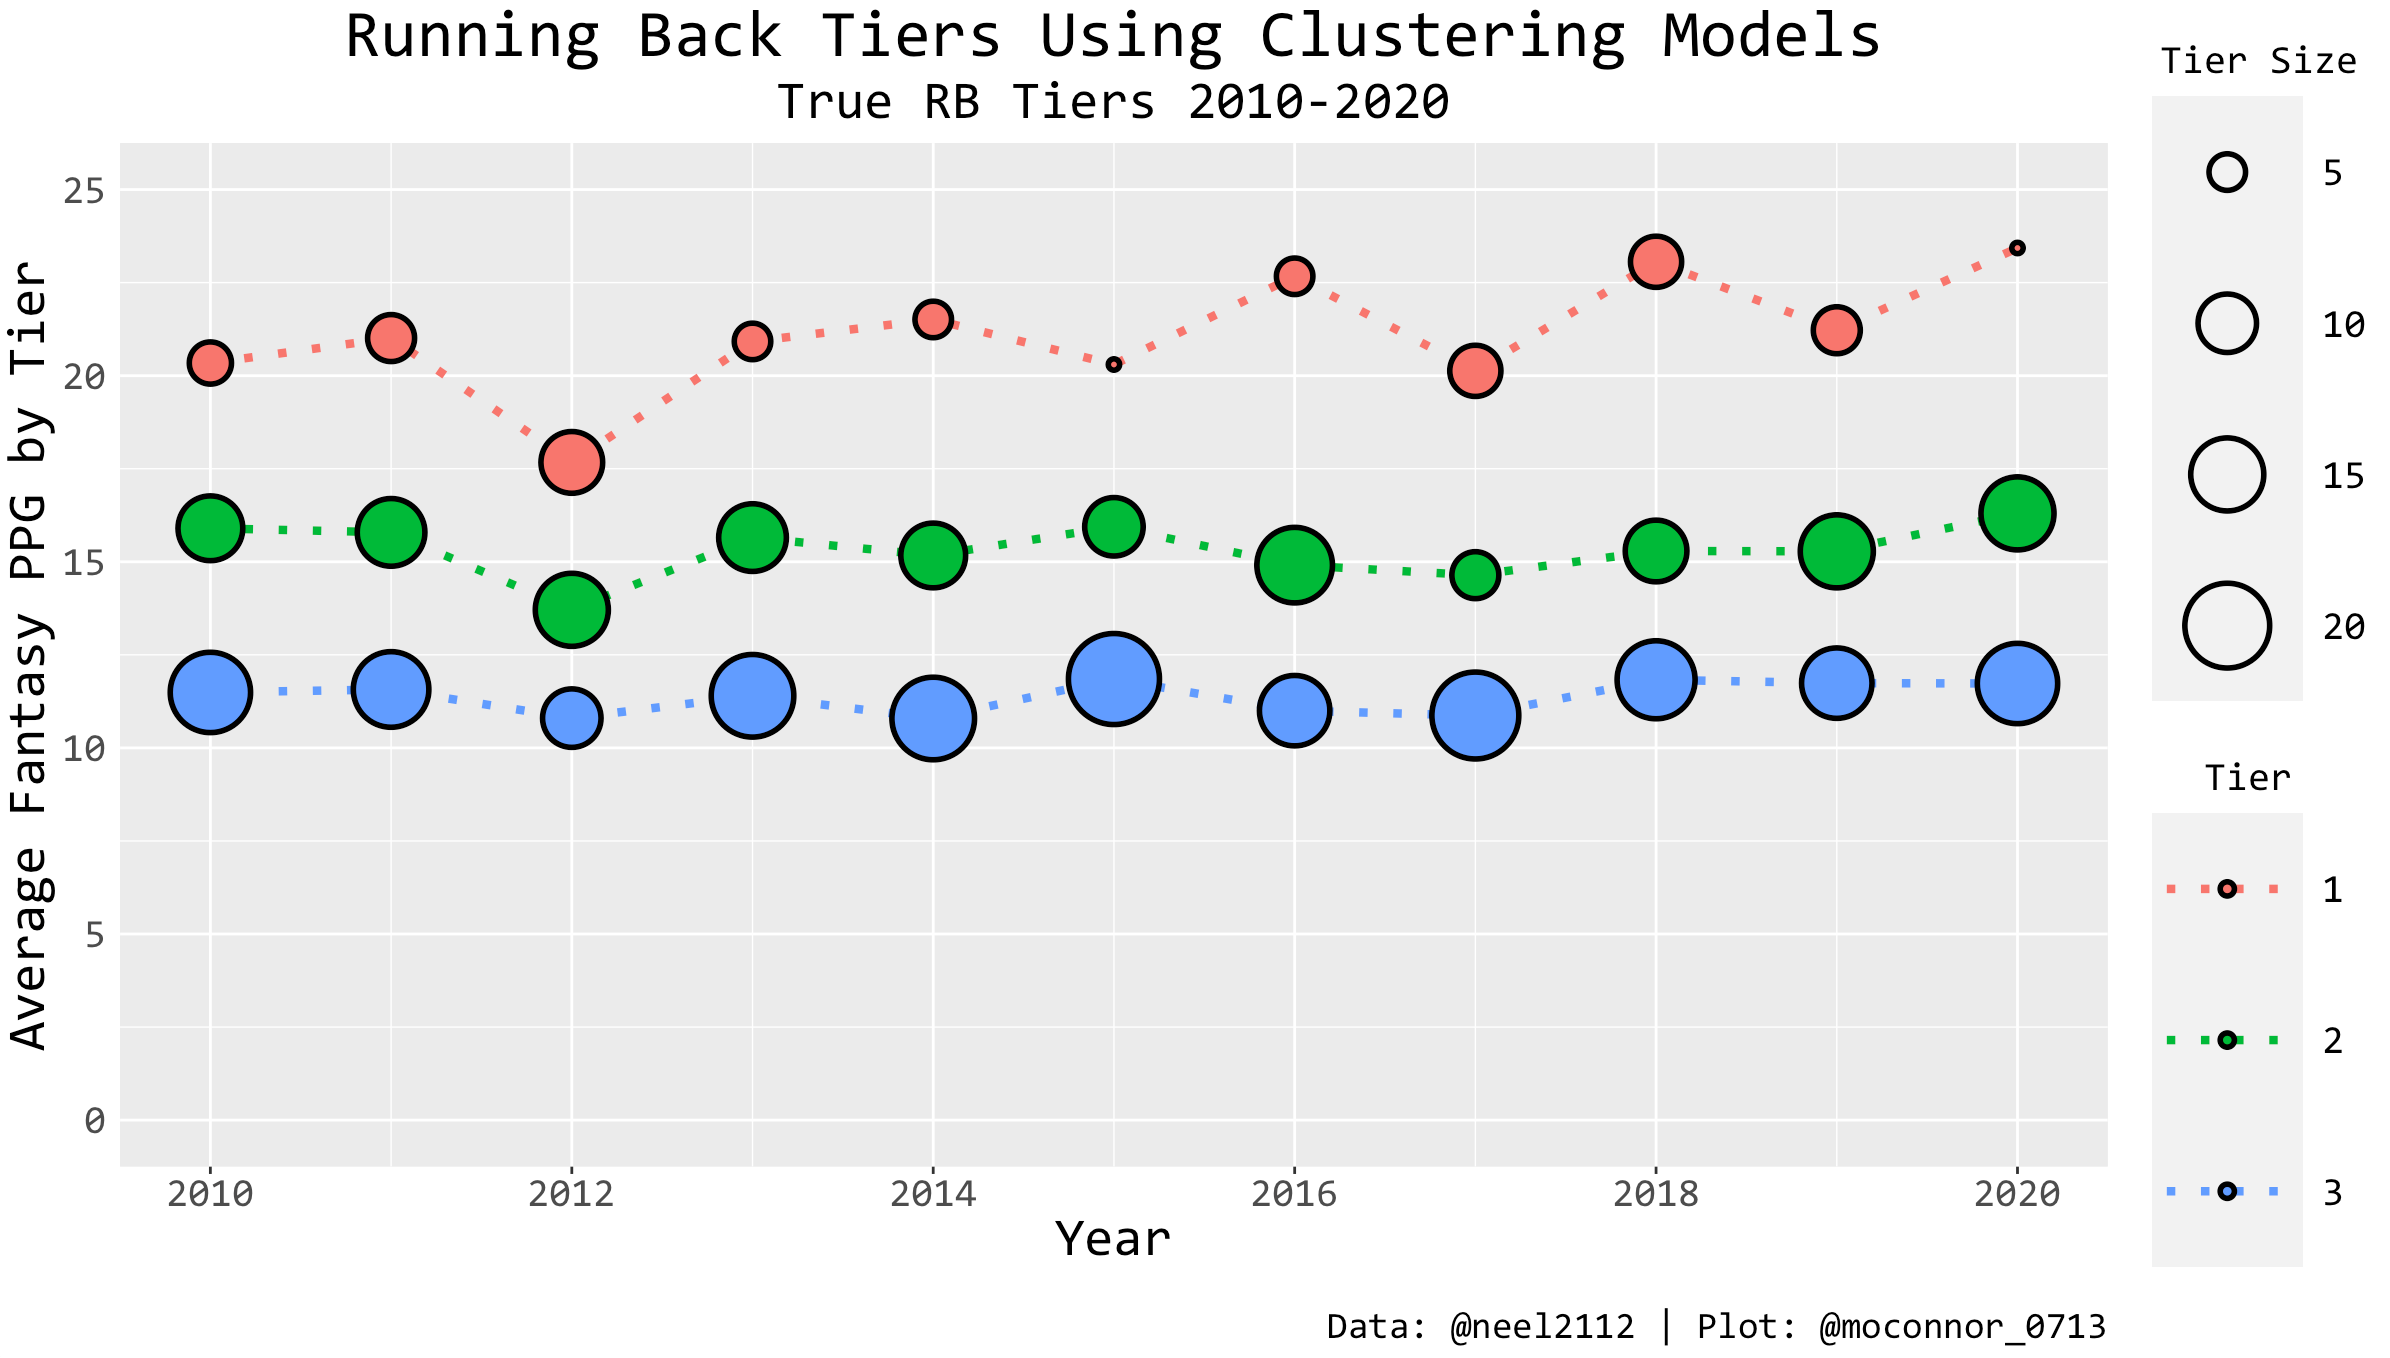
The number of RB1s have contracted over time, culminating in a brutally small RB1 tier in 2020 with only three RB1s, Alvin Kamara, Dalvin Cook, and Derrick Henry. Similarly, the difference in the centroids between the RB1 centroid and the RB2 centroid remains incredibly large, usually at above five Fantasy Points Per Game.
In other words, the RB1 tier is getting narrower and further away from the rest of the pack. The league-winning RBs are hitting harder now than in years past, but they are more scarce than ever before.
The 2015, 2016, and 2017 NFL Drafts were responsible for a large influx of RB talent into the NFL player pool, with players like Derrick Henry, Ezekiel Elliott, Melvin Gordon, Christian McCaffrey, and Alvin Kamara emerging as the new elite class of running backs in fantasy football. Many of these running backs have hit the age apex however, leaving a hole at the position. Luckily, the 2020 draft was extraordinarily deep at the RB position, and players like Jonathan Taylor, Antonio Gibson, and D’Andre Swift are poised to fill the void and potentially expand the RB1 tier heading into next season.
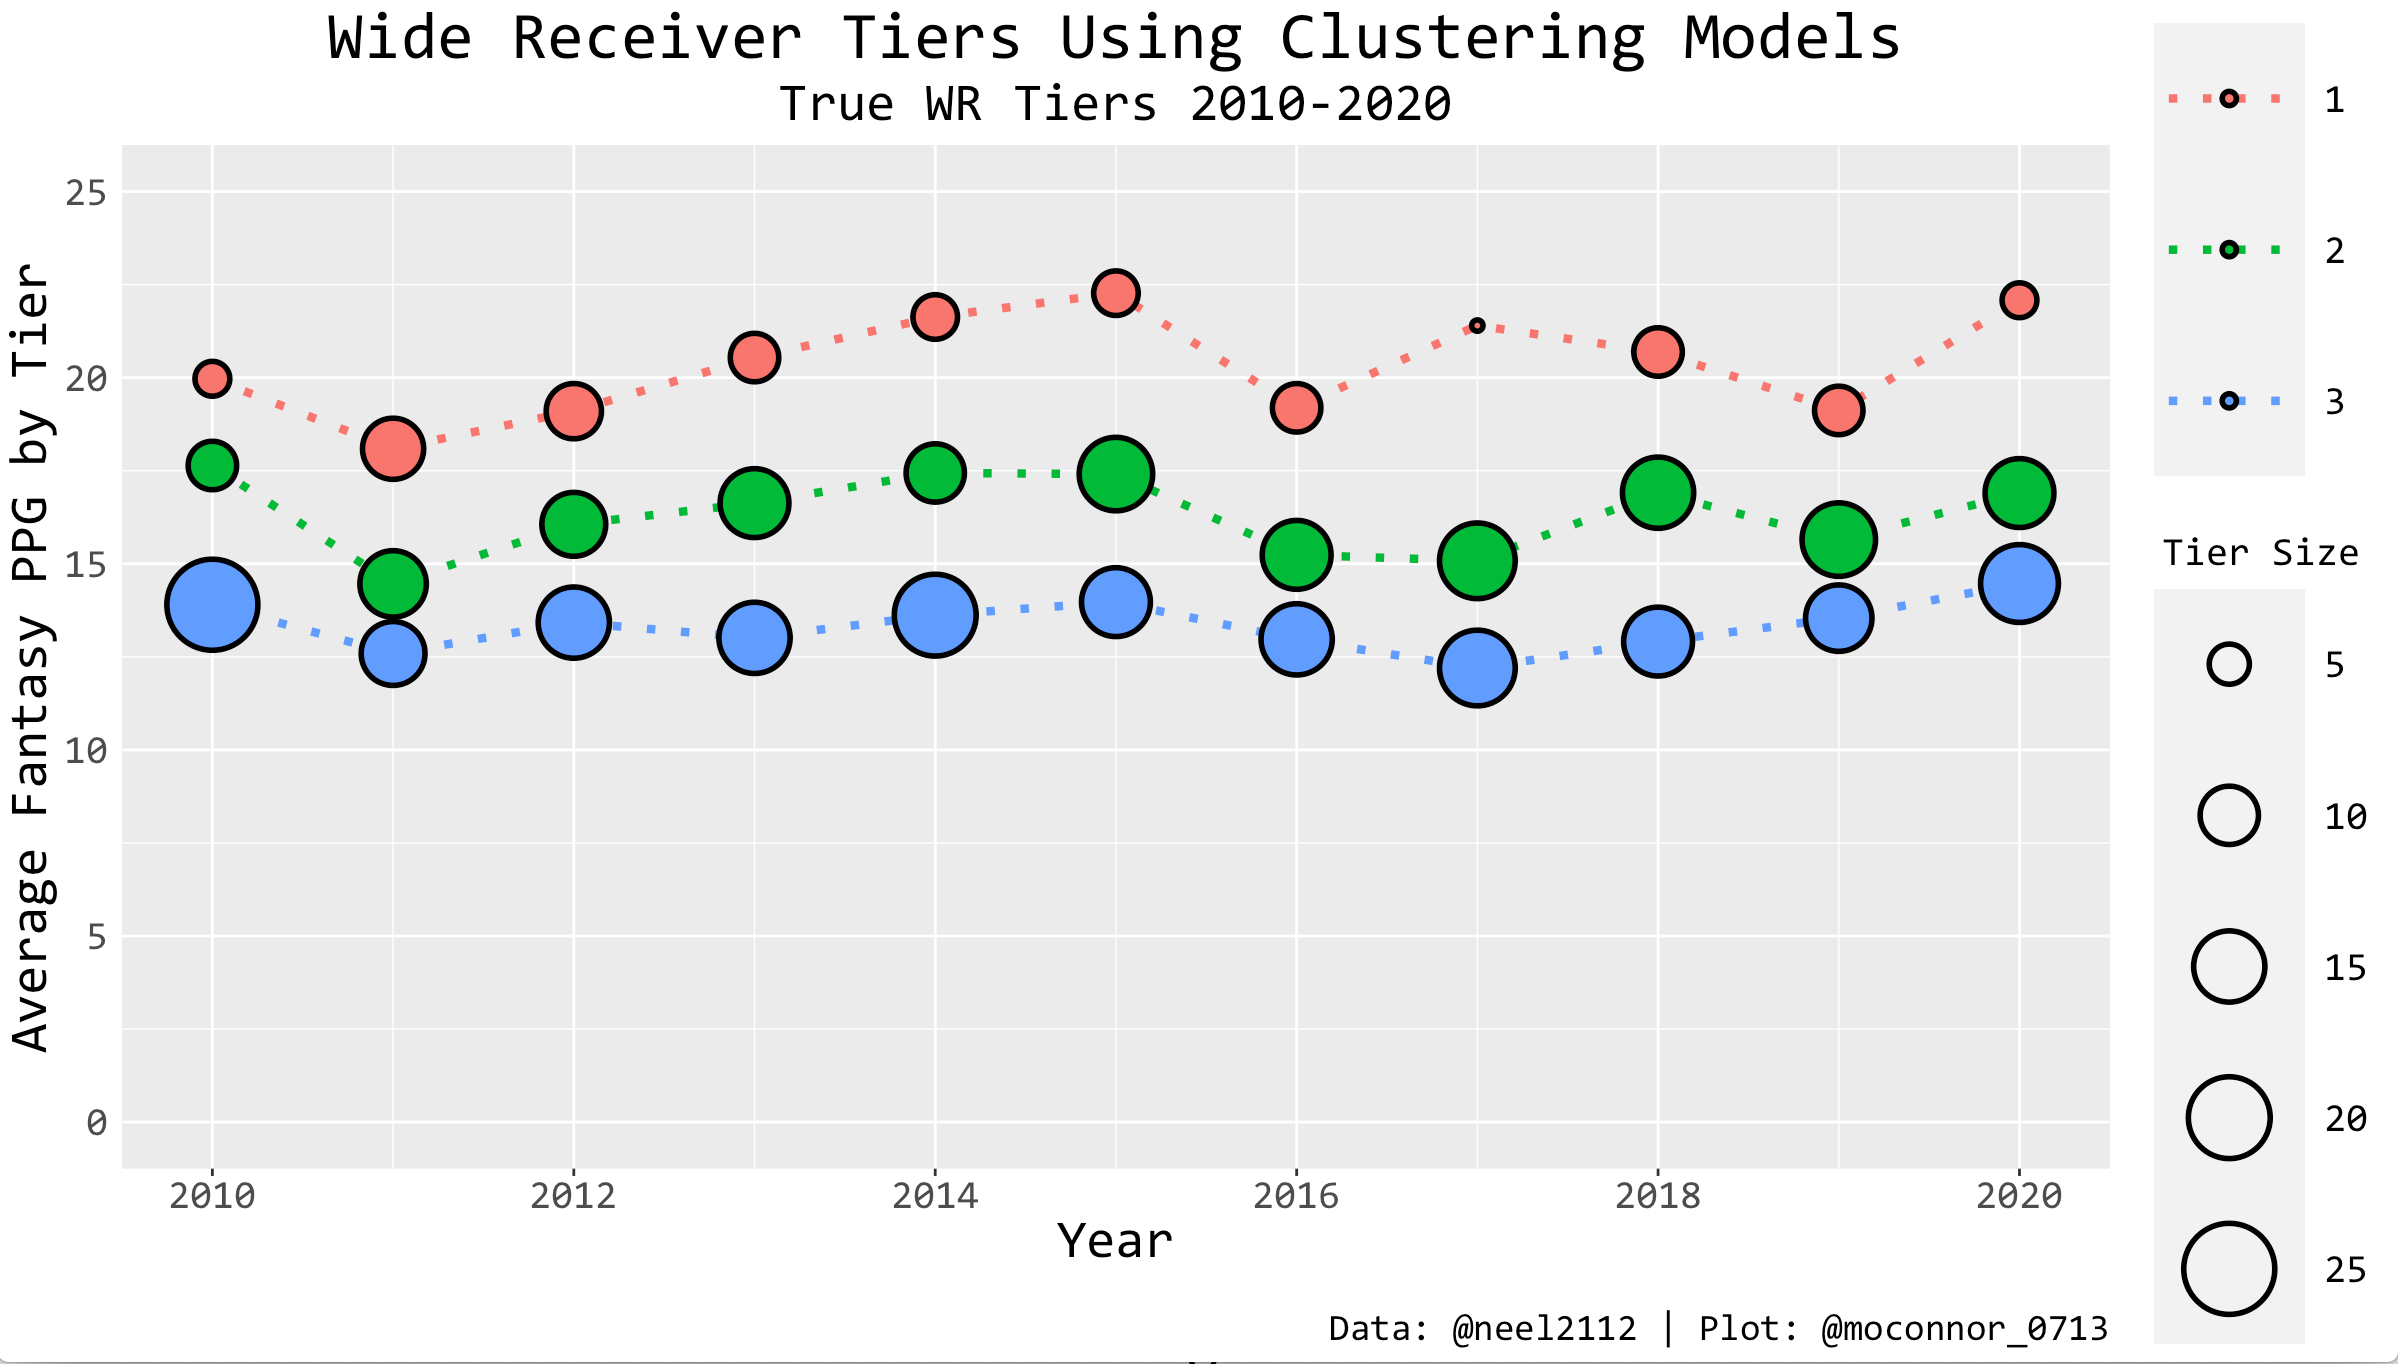
On the wide receiver side, there seems to be a similar contraction in the number of true alpha wide receivers in fantasy football. However, the gap between the WR1 centroids and the WR2 centroids is consistently smaller than the gap between the RB1 centroids and the RB2 centroids in almost every year. In other words, the delta between the 2020 versions of a Dalvin Cook and a Nick Chubb is wider than the delta between a Stefon Diggs and a Keenan Allen.
Another recent trend seems to be the increase in points of the WR3 centroid. 2020 had the WR3 centroid at 14.47 points per game, which is actually higher than the WR2 centroid of 14.46 points per game back in 2011. Part of that is due to the large WR1 tier in 2011 that necessarily squeezed the WR2 tier of some of its high end talent.
The difference between WR3s and WR2s is relatively smaller than the difference between RB2s and RB3s, furthering the hypothesis that the top-36 wide receivers are a tighter and deeper group than their counterparts in the RB position.
Both running backs and wide receivers have small groups of elite top-end talent that only a portion of a fantasy football league will be able to snag. There are fewer RB1s and WR1s than there are spots in a 12 team fantasy league. Our tier distributions suggest that you should grab top end talent if you can; don’t lobby for an end of the first round pick in a snake draft, grab your Christian McCaffrey or Tyreek Hill at the start of the draft and feel confident that barring injury, you will own a TRUE RB1 or WR1. When your pick comes back around, there will still be players in the RB2 and WR2 tiers you can grab. Both the RB2 and WR2 tiers are deep, and there is not a scarcity in the amount of mid-tier talents you can grab, round after round in your fantasy draft.
Top-end talent is the most limited resource in fantasy football, and the trend indicates that 2021 will be no different.
Moving Forward
It’s important to note that my methodology is not perfect. More robust analyses of positional tier distributions are possible and needed. I arbitrarily told the K-Means Clustering Algorithm to create three clusters instead of a different number in order to “fit” the established RB1, RB2, and RB3 hierarchy that the fantasy industry has standardized. In reality, in any given year, running backs and wide receivers can divide into a totally different amount of natural tiers that fit that year’s point distribution. In 2019 for example, perhaps a true RB tiering system would have Christian McCaffrey in his own RB1 tier, with an astounding 29.3 Fantasy Points Per Game, rather than grouped with the No. 2 back Dalvin Cook with 21.2 points per game and five others.
Fantasy Points Per Game is also not necessarily the best metric to use, as it treats point differences linearly. Differences in top-end talent is often more impactful in real fantasy leagues than the differences between the WR25 and the WR35, because the top few players at each position are started in each and every week, and have a proportionally larger impact on whether a team wins or loses than lower ranked players. Other metrics like Best Ball Points Added and Value Over Replacement are potentially more useful metrics for identifying fantasy football tiers, rather than just raw fantasy points.
While clustering on PPR points per game into three tiers is not a perfect system by any means, it’s important we move past the lazy analysis that comes with labelling the top x amount of players at a position as in the same tier. Let’s use the mathematical tools at our disposal in order to improve our understanding of positional value. We can do better.

