
PlayerProfiler is home to award winning dynasty rankings and tools. Our Dynasty Deluxe package includes complete Dynasty Rankings, Rookie Rankings, Trade Analyzer, Draft Planner, Mock Drafts, and more. Check it out. Below, Griffin McShane dives into the PlayerProfiler Injury Finder and highlights its ability to predict the likelihood of injured players in the NFL in coming seasons.
Are injuries truly unpredictable or can we predict injury risk before drafting? PlayerProfiler’s Injury Finder uses Injury Risk Rating, defined as the probability a player will miss two or more games to a new injury using that player’s projected workload and Fragility Rating. Fragility Rating is how likely they are to get injured on a per-touch basis.
This article will explore the predictive power of the Injury Risk Rating – the likelihood of a player missing more than two games and the average games missed. The injury risk percentiles given will indicate the percentage of players across all skill positions with lower injury risk ratings. The analysis will be grouped by skill positions starting with quarterbacks. As you can see in the graphs below, the Injury Risk percentiles are shown on the x-axis.
Percentiles identify the percentage of players whose injury risk rating is less than a given value. For example, if a quarterback’s injury risk percentile is in the 40th-percentile, then 40-percent of the skill players in the model have an Injury Risk Rating lower than the given QB.
Quarterbacks
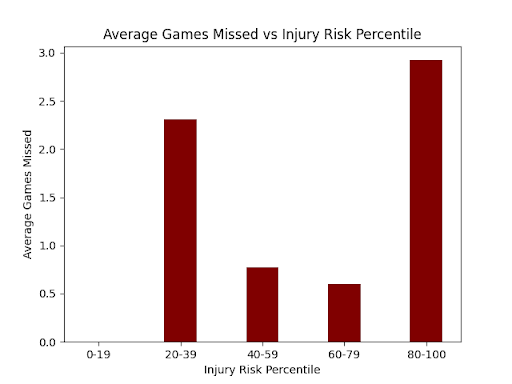
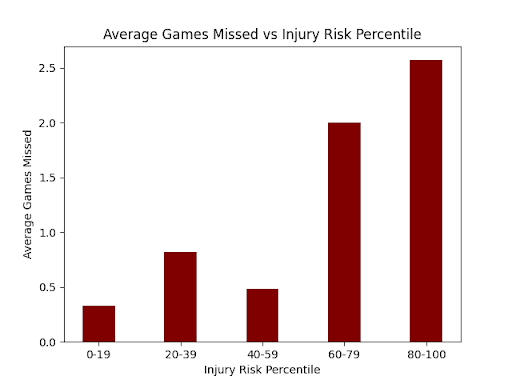
Across the different percentile ranges, there is a noticeable pattern: higher Injury Risk Percentiles correspond to increased average games missed due to injury. Quarterbacks falling within the 40th- to 59th-percentile range missed an average of 0.7 games, while those in the 80th- to 100th-percentile range missed 2.9 games on average.
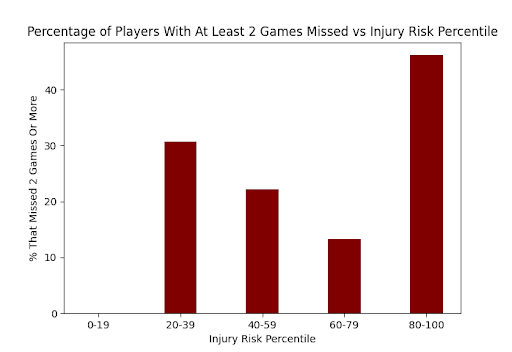
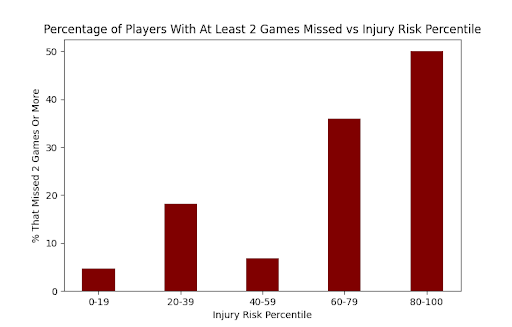
Moreover, the percentage of injuries resulting in quarterbacks missing more than two games follows a similar trend, suggesting a positive correlation between Injury Risk percentiles and the severity of injuries sustained by quarterbacks. Notably, Daniel Jones, who carried a high Injury Risk Rating entering the 2023 season, further exemplified this trend, missing 11 games due to injury.
Let’s address the elephant in the room: the 20th- to 39th-percentile Injury Risk range, headlined by Kirk Cousins and Aaron Rodgers. This deviation from the trend warrants careful consideration for quarterback injuries in the 2023 NFL season and beyond. Let’s compare these results to the graphs from the 2022 season:
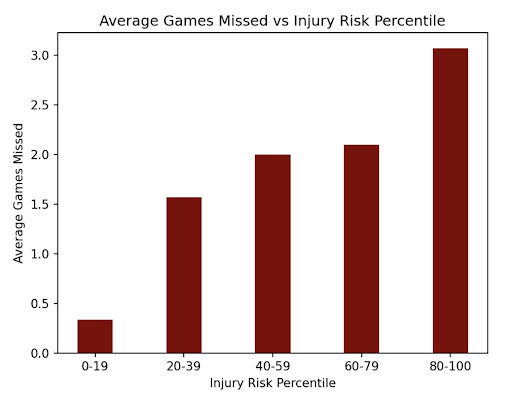
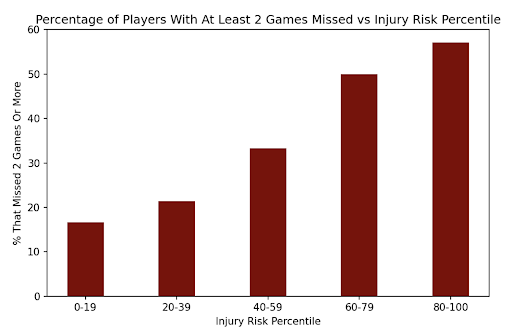
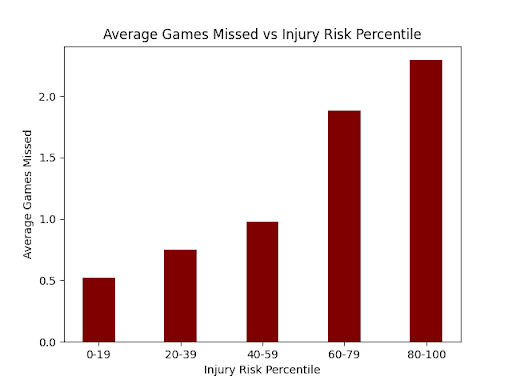
While quarterbacks falling within this percentile range typically exhibit a lower Injury Risk Rating compared to higher percentile ranges, this group missed nearly 2.5 games on average and 30-percent of them missed more than two games. To the Injury Finder’s defense, outliers will be easy to spot in a sample size of six quarterbacks – how many more times will a quarterback suffer a devastating Achilles injury during their first drive of the season? We can see that in 2022 there were no such outliers and a clearer trend appeared.
Despite the outlier, the overall trend of higher Injury Risk percentiles corresponds to an increased number of games missed, highlighting the importance of considering Injury Risk percentiles as a predictive tool for assessing quarterbacks in fantasy football analysis.
Running Backs
After the madness of the quarterbacks, we see that running backs with higher Injury Risk scores also tend to miss more games. For example, those in the 60th- to 79th-percentile and 80th- to 100th-percentile ranges missed almost three times as many games, on average, as those below the 60th-percentile.
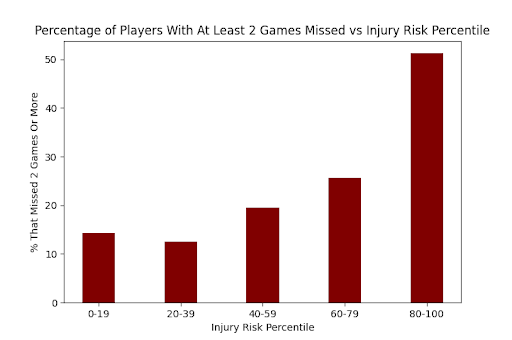
When it comes to the severity of those injuries, again, the trend is clearer for running backs with higher Injury Risk scores. In the 60th- to 79th-percentile and 80th- to 100th-percentile ranges, a higher percentage of players missed more than two games compared to other ranges.
But there’s an interesting twist in the data with the 20th- to 39th-percentile range. Comparing this range to the 0th- to 19th-percentile and 40th- to 59th-percentile intervals, these running backs ended up missing more games, on average, and had a much higher percentage of injuries leading to extended absences. In Week 8, Kansas City running back Jerick McKinnon suffered a groin strain causing him to miss six games, making him the only RB in the 40th- to 59th-percentiles to miss more than two games.
Overall, despite some outliers and surprises, the general pattern holds true: higher Injury Risk scores correlate with more missed games and more severe injuries for running backs.
Wide Receivers
For wide receivers, we once again see that as the Injury Risk percentile range increases, so does the average number of games missed. For instance, receivers in the 0th to 59th-percentile range missed an average of 0.7 games, while those in the 60th to 99th-percentile range missed 2.0 games on average.
Examining the severity of these injuries further reinforces the trend. In the 80th- to 100th-percentile ranges, a higher percentage of injuries resulted in wide receivers missing at least two games compared to other percentile ranges. Specifically, approximately 50-percent of receivers in the 80th- to 100th-percentile range missed at least two games due to injury compared to 22-percent in the 0th to 79th-percentile range. This shows the injury rating as an effective metric.
Tight Ends
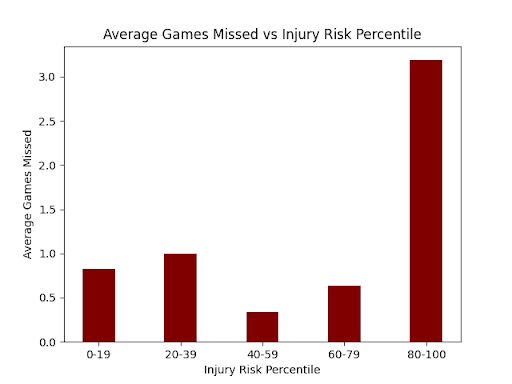
Shifting our focus to the tight end position, we see that the average games missed for all percentile groups from 0th- to 79th remained lower than two games. Conversely, tight ends in the 80th to 100th-percentile range missed 3.6 games, highlighting a higher susceptibility to injuries among this group.
Delving deeper into the severity of the injuries, the data shows a compelling trend, particularly among tight ends in the highest Injury Risk percentile range. As the Injury Risk percentile increases from 0 to 79, the proportion of injuries sidelining players for more than two games decreases. Shockingly, in the 60th to 79th-percentile range, no tight ends missed more than two games due to injuries. Congratulations to C.J. Uzomah, Donald Parham, Evan Engram, Gerald Everett, Jake Ferguson, Juwan Johnson, and Taylor Swift!
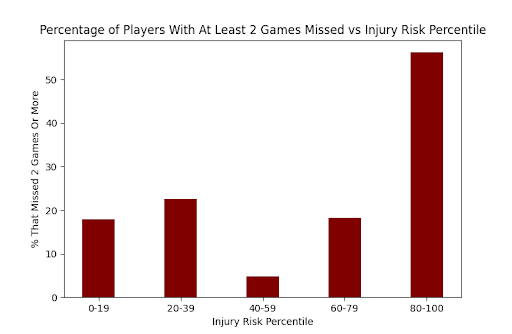
When the percentiles were greater than 80, the injury risk rating performed better. A staggering 56-percent of players in this range missed at least two games due to injuries, signifying a higher likelihood of prolonged absences.
Conclusion
The analysis of Injury Risk rankings across different skill positions in the 2023 NFL season provides valuable insights into the relationship between Injury Risk Rating and player health. Across quarterbacks, running backs, and wide receivers, a consistent pattern emerges. Higher injury risk ratings correspond to increased average games missed and a higher likelihood of injuries leading to prolonged absences. This trend underscores the importance of injury risk assessment in player evaluation and fantasy football analysis.
When you’re in the middle of an intense draft and you’re deciding between two players, do yourself a favor and open the Injury Finder app to check Injury Risk Rating.

