
The 2022 Jets Backfield Breakdown is part of an offseason series in which I take a deep dive into one NFL team’s backfield and examine the respective rushing performances of the players in it. In doing so, I hope to gain insights into key players from a talent evaluation standpoint and use that evaluation as a baseline from a dynasty valuation standpoint. The first installments in the series can be found here.
I’ll start by taking a quick overview of each team’s raw rushing volume and propensity to run the ball. Then, I’ll dive into the player evaluation portion. Before we start, let’s define the metrics I’ll use as part of those evaluations:
Key Metrics
Yards per Carry+ (or YPC+)
The degree to which a player’s raw yard per carry average exceeds or falls short of the collective yard per carry average of all other running backs on his team. Meant to be an overview of a player’s team-relative efficiency.
Box Count+
The degree to which the average amount of defenders in the box that a player faces on his runs exceeds or falls short of the collective average faced by the other running backs on his team. Considering that the outcome of any given rushing attempt is largely dependent on the number of defenders in the box pre-snap, Box Count+ describes the relative degree of difficulty of a running back’s carries.
Breakaway Conversion Rate (BCR)
Quantifies performance in the open field by measuring how often a player turns his chunk runs of at least 10 yards into breakaway gains of at least 20 yards.
Box-Adjusted Efficiency Rating (BAE Rating)
Improves upon YPC+ by accounting for the box counts that a player carried the ball against. Looks at team-relative yards per carry against each individual box count, then uses a weighted average (based on total carries against each box count) to generate an overall score. A score of 100-percent indicates that a player is producing exactly the per carry output of his teammates, a score above 100-percent indicates that he is outdoing their per carry output to whatever degree, and vice versa for a score below 100-percent.
Relative Success Rate (RSR)
Measures player consistency using Success Rate, but relative to his teammates and adjusted for the box counts that he faced in the same way that BAE Rating is. “Success” on a given carry is defined by gaining 40-percent of yards needed on first down, 70-percent of yards needed on second down, and 100-percent of yards needed on third or fourth down. A score of 0.0-percent indicates that a player is succeeding on exactly the same percentage of his carries as are the other backs on his team, a positive score indicates that he is succeeding more often than his teammates are, and vice versa for a negative score.
Volatility Rating
Measures the disparity between a running back’s percentile ranks in BAE Rating and RSR in order to indicate how volatile a player’s per-carry performance is. High overall efficiency paired with low rate of success indicates boom/bust output, while low overall efficiency paired with high rate of success indicates steady, low-ceiling output. Measures degree of volatility, not quality of performance.
Composite Efficiency Score (CES)
Presents a single-metric overview of the quality of team-relative performance a player produced on his carries in a single season. Calculated using the average of a player’s percentile ranks in Box-Adjusted Efficiency Rating and Relative Success Rate, represents player performance on a 0-100 scale.
Check out Breece Hals’s 2022 Projection on PlayerProfiler’s “World Famous” Draft Kit:
Team Rushing Volume
The New York Jets finished at the stone-bottom of the league in rushing volume last season. Their 380 total carries, in the first year of the Robert Saleh era, were more than 70 fewer than league average.
According to rbsdm.com, New York seems to have wanted much more offensive balance than they were able to maintain a year ago. On early downs in neutral game script situations, the Jets were No. 17 in the NFL in run rate in 2021. They opted to pound the rock 48.7-percent of the time. Given the down-and-distance situations they found themselves in, they did opt to throw the ball one percent more often than expected (given league-wide play-by-play data) on aggregate.
With a slight propensity for passing the ball under offensive coordinator Mike LaFleur, the Jets’ running game’s best opportunity for increased volume in 2022 will likely come from improvement in offensive efficiency in general. Playing in more competitive games will allow the Jets to stick to their gameplan. The development of Zach Wilson, along with the addition of playmakers Garrett Wilson and Breece Hall, should make that easier next season.
Efficiency Numbers
Rookie Michael Carter was the lead man in the backfield pecking order a season ago. Tevin Coleman and Ty Johnson rounded out the core of the committee. Behind them, Austin Walter and La’Mical Perine got light work in just four games of activity each. Here are the full rushing efficiency profiles for those five backs:
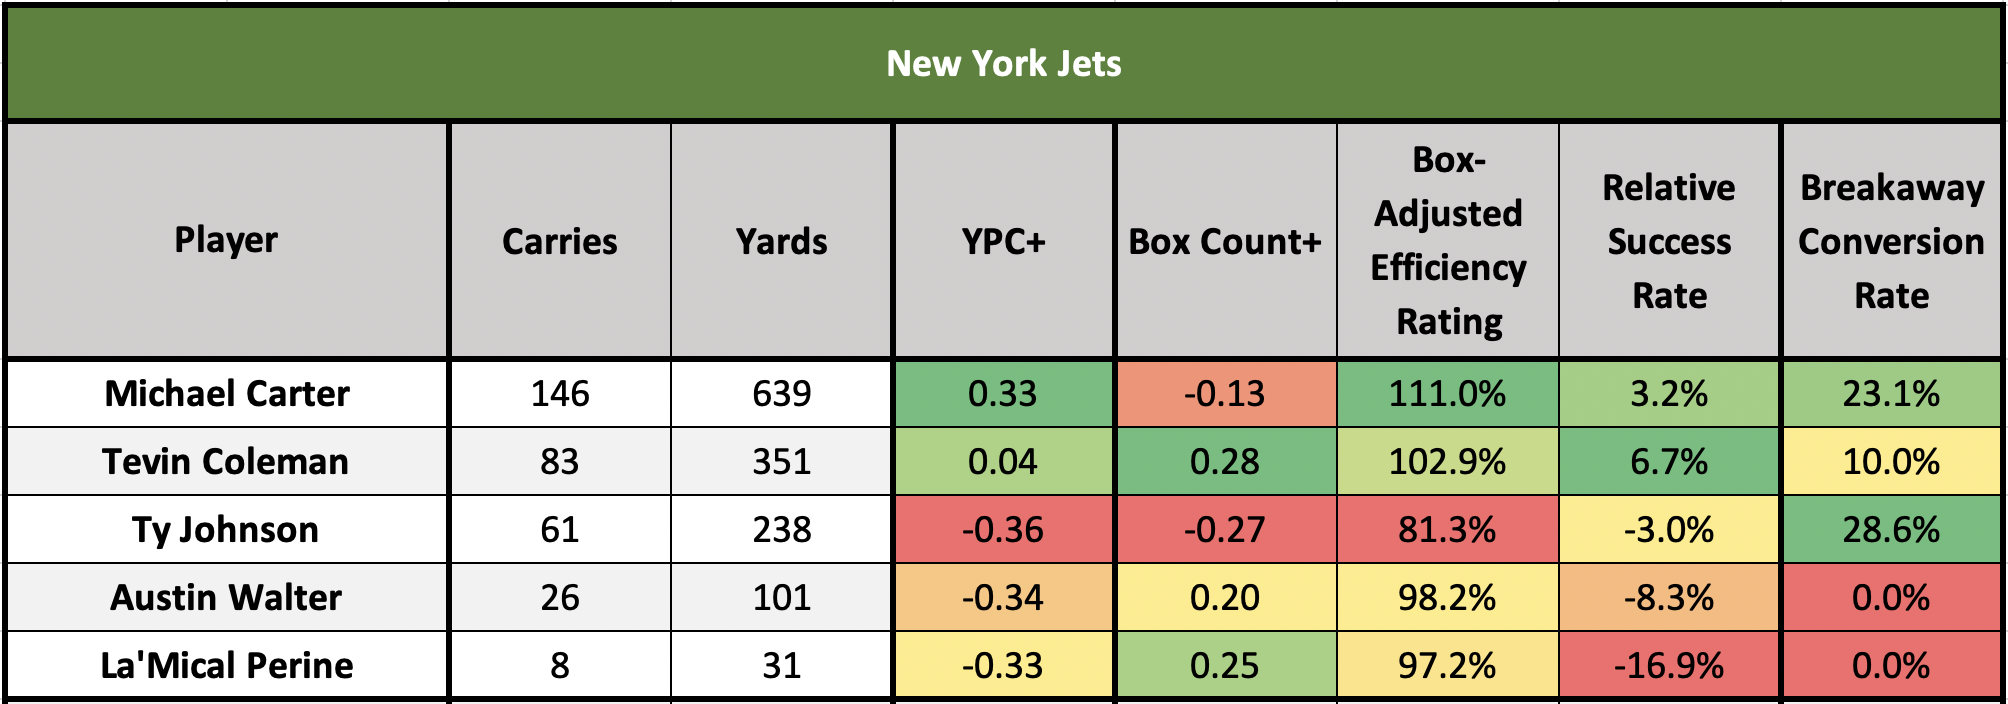
Carter was very solid as a first-year runner. He proved more efficient and more consistent on a per-carry basis than the collective other backs on the team. His Composite Efficiency Score of 65.7 was No. 11 in the league among lead backs, and was third among all rookies, behind only Khalil Herbert and Jermar Jefferson (who carried the ball just 15 times).
That performance follows up a nice college career for Carter. During college he posted Box-Adjusted Efficiency Rating marks consistently above 100-percent while sharing carries with Javonte Williams for three seasons.
Coleman was also a solid contributor a year ago, especially according to Relative Success Rate. His 6.7-percent mark there comes in at the 81st percentile. Interestingly, 2021 was just the second time in Coleman’s career in which he posted a positive mark in that category. It was also the first season since 2018 that Coleman was above the 100-percent threshold in BAE Rating.
After a solid contribution as a rookie, and a tremendous per-carry campaign as a second-year guy in 2020, Johnson fell off hard last season. He provided neither efficiency nor consistency on his opportunities.
Walter and Perine were similarly ineffective on subdued volume. However, they at least have the excuse of having run into heavier boxes than the other backs on the team.
So Now What?
Obviously, the big “now what” is the Jets added Hall in the second round of the NFL Draft. Presumably, he’ll step into the number one spot on the depth chart and be spelled by Carter. Hall’s collegiate efficiency profile paints the picture of an explosive athlete who is still learning how to consistently churn out positive yardage. In three seasons at Iowa State, Hall posted a 71st-percentile BAE Rating but just a 43rd-percentile Relative Success Rate. That volatile overall efficiency was fueled by an 80th-percentile Breakaway Conversion Rate.
In addition to Hall and Carter, the undrafted Zonovan Knight joins Coleman, Johnson, and Perine as runners currently under contract in New York. Knight was an excellent runner at NC State. He posited BAE Ratings above the 120-percent mark and positive RSR numbers in all three of his seasons. This included a 142-carry 2020 campaign in which his numbers in those metrics were 140.8-percent and 12.8-percent, respectively. It wouldn’t shock me to see Knight make this team.
Final Word
Carter was a quality caretaker of this backfield in 2021. However, Hall should be the undisputed lead runner going forward. His upside is very much dependent on Wilson taking steps forward, but Hall’s mix of ability, youth, and opportunity is nearly unparalleled in dynasty. He’s my RB4 in that format. I also wouldn’t rule out immediate RB1-level production for redraft purposes.

