
Last week we examined the running backs with the highest Yards Per Carry against base fronts using our new formation-specific efficiency metrics. This week, we examine the running backs with the highest Yards Per Carry Against Stacked Defensive Fronts, or formations with at least eight defensive linemen and/or linebackers in the tackle box. The backs listed received at least 10-percent of their carries against stacked fronts (min. 50 carries).
12. Jonathan Stewart, Panthers: 2.0 YPC
At No. 12, Jonathan Stewart was inefficient with a -19.8 (No. 68) Production Premium, but was able to plod his way to 824 Rushing Yards and 9 Total Touchdowns. Stewart also averaged 16.2 Fantasy Points Per Game in games where he received at least 18 carries. At this point you know what you’re getting with Stewart, as he needs volume to produce at this point in his career. Carolina is also expected to seek an upgrade to the running back position in 2017.
10a. Melvin Gordon, Chargers: 2.2 YPC
Melvin Gordon had little room to run in 2016 regardless of the defensive fronts he faced, as the Chargers’ inefficient run blocking led to a 3.9 YPC overall. However, Gordon was able to produce anyway due to volume and solid quarterback play. With a 77.4-percent (No. 4) Opportunity Share, Gordon managed to post 15 (No. 4) Breakaway Runs and 63 (No. 12) Evaded Tackles. He also registered 328 (No. 13) Yards After Contact, displaying the ability to create yardage on his own.
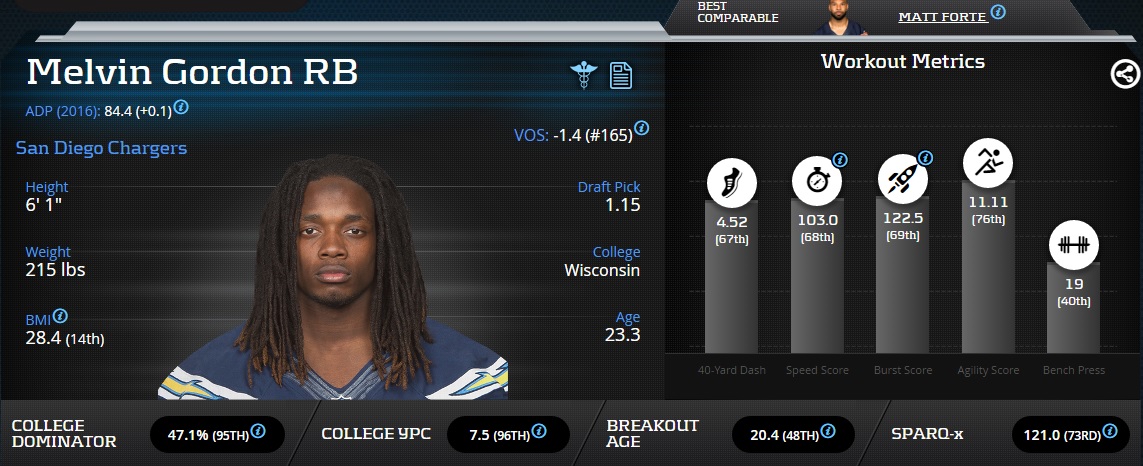
Melvin Gordon Advanced Stats & Metrics Profile
If it weren’t for all those darn red-zone carries, Melvin Gordon‘s YPC could have been higher, but his owners weren’t complaining in 2016. Expect Gordon to continue to receive the majority of opportunities in the running game in 2017, even with Danny Woodhead returning.
10b. Chris Ivory, Jaguars: 2.2 YPC
Chris Ivory was a relatively disappointing player in 2016, as his -11.4 (No. 57) Production Premium suggests he requires significant volume to produce fantasy points. Jacksonville’s offensive line did Ivory no favors, ranking 25th in the league in run-blocking efficiency. The fact that Ivory was able to average 2.2 YPC against stacked fronts is a testament to his aggressive running style, as defenses regularly dared Blake Bortles to beat them. Despite his inefficiency, Ivory averaged close to 112 yards from scrimmage in games where he touched the ball at least 18 times in 2016. Like Stewart, Ivory’s value depends on volume and situation, but don’t expect him to become a bell-cow back any time soon.
https://www.youtube.com/watch?v=RFe35MRLyhA
9. DeMarco Murray, Titans: 2.5 YPC
It’s hard to find a more desirable situation for a running back than Tennessee right now, as DeMarco Murray was able to take full advantage of his 73.9-percent (No. 6) Opportunity Share in 2016. With 74 (No. 5) Evaded Tackles and 404 (No. 8) Yards After Contact, Murray enjoyed success behind an offensive line that ranked 8th in run blocking efficiency.
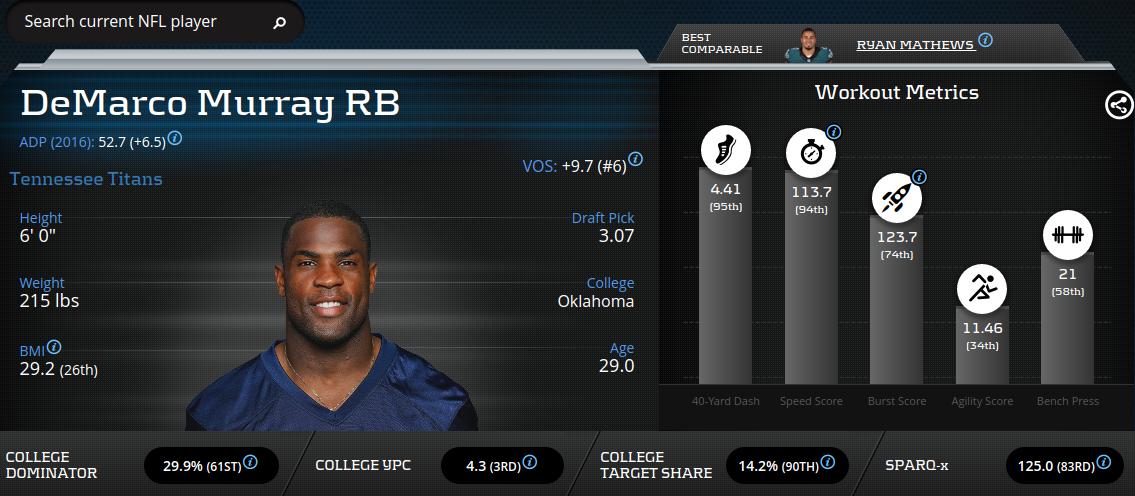
DeMarco Murray Advanced Stats & Metrics Profile
Tennessee should only get better on offense in 2017, but don’t be surprised if Derrick Henry cuts into a greater percentage of DeMarco Murray’s touches than he did last year.
8. Devonta Freeman: 2.5 YPC
Devonta Freeman improved his efficiency in 2016, registering a +15.1 (No. 19) Production Premium, as the offensive line received a boost with the addition of Alex Mack. However, Freeman’s Opportunity Share decreased from 73.4-percent (No. 4) in 2015 to 58.9-percent (No. 20) in 2016 due to the emergence of Tevin Coleman. Luckily, Freeman made up for it by registering 404 (No. 8) Yards After Contact and an 83.1-percent (No. 7) Catch Rate, demonstrating that he can be a consistent and reliable fantasy option even with a decreased workload.
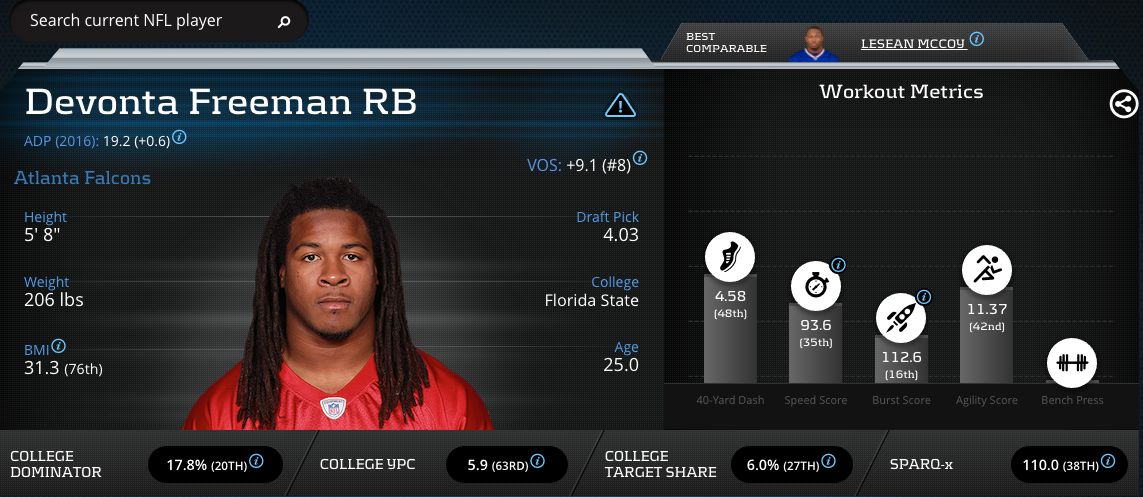
Devonta Freeman Advanced Stats & Metrics Profile
Please do not let Kyle Shanahan’s departure affect your opinion of Devonta Freeman. That narrative will be pushed when we get to training camp in August. While Kyle Shanahan did a great job in 2016, the Atlanta offensive isn’t going to collectively forget how to play football with him gone.
6a. Ezekiel Elliott, Cowboys: 3.5 YPC
6b. Alfred Morris, Cowboys: 3.5 YPC
Ezekiel Elliott and Alfred Morris each averaged 3.5 YPC Against Stacked Fronts with a 22.7-percent and 33.3-percent Stacked Front Carry Rate. It helps when you can run behind the Cowboys’ offensive line, which posted a 135.8 (No. 2) run-blocking efficiency score in 2016. Everyone knew Elliot was getting the ball and they still couldn’t stop him.
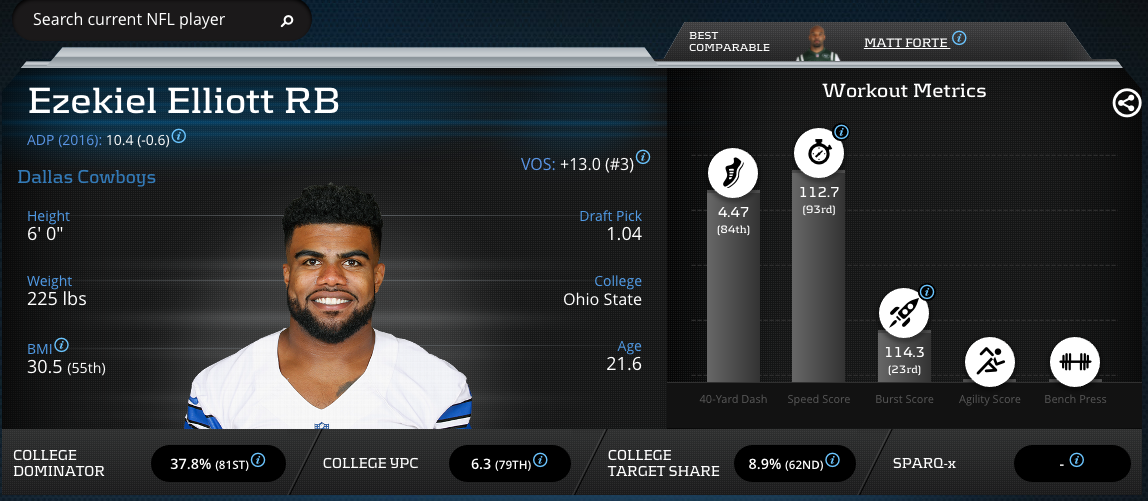
Ezekiel Elliot Advanced Stats & Metrics Profile
The fact that the Cowboys saw so many stacked defensive fronts in 2016 led to increased fantasy production from the passing game as well, and there’s no reason that shouldn’t continue in 2017. Barring an off-the-field incident or injury, Ezekiel Elliott is about as safe as it gets, and Alfred Morris would be a Top-10 option at running back if Elliott were to go down.
5. Christine Michael, Free Agent: 3.8 YPC
Christine Michael remains an enigma, and is easily the most surprising player on this list. Michael posted a +0.9 (No. 34) Production Premium despite an offensive line that ranked 29th in run blocking efficiency. Michael also posted a 30.6-percent (No. 10) Juke Rate, as he displayed flashes of his exceptional athleticism. Unfortunately, Michael has struggled to grasp the finer points of the game, and is simply unable to get on the same page as the coaching staff. He also averaged 2.5 Yards Per Carry Against Base Fronts, which is quite puzzling. Looking at his 14-percent (12th-percentile) College Dominator Rating, Michael was never able to put it together in college, and there is little evidence that would suggest he’d be able to do it in the NFL.
https://www.youtube.com/watch?v=RrIVt1ApCTI
4. Latavius Murray, Free Agent: 4.2 YPC
Latavius Murray boasts an impressive athletic profile, but has never been able to earn the trust of his coaching staff at any level, as evidenced by his 27.3-percent (52nd-percentile) College Dominator and 61.1-percent Snap Share over the past two seasons. Also, you would think his 115.8 (96th-percentile) Speed Score would lead to more breakaway runs, but his Breakaway Run Rate checked in at 3.6-percent (No. 39).
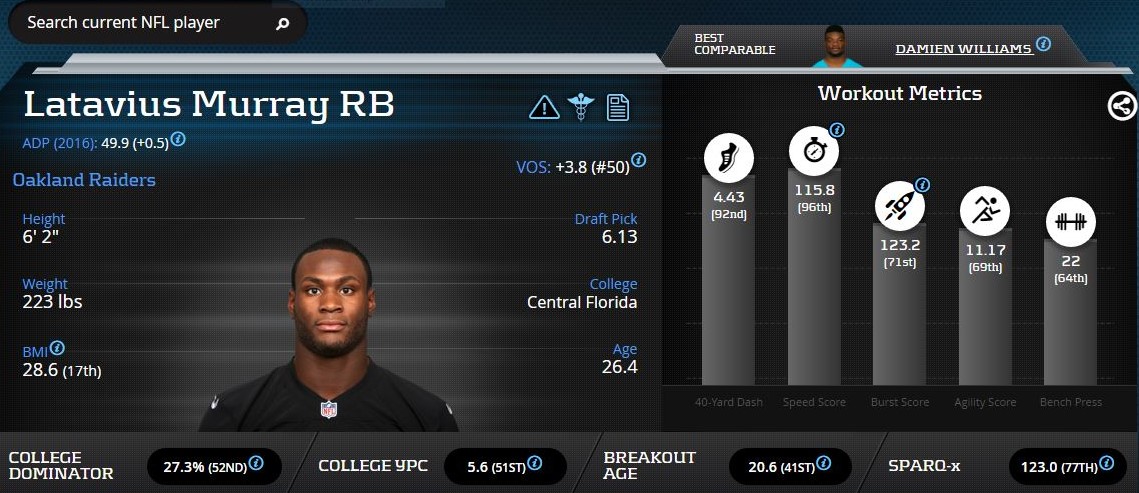
Latavius Murray Advanced Stats & Metrics Profile
Expected to test the open market this offseason, if Latavius Murray couldn’t average more than 4.6 (No. 45) Yards Per Touch in Oakland high-octane offense, we don’t see him having too much success anywhere else. Don’t be fooled by his 12 touchdowns either, as that is destined to regress if he lands elsewhere.
3. Mike Gillislee, Bills: 4.7 YPC
Mike Gillislee is an interesting player, as he has been one of the most efficient running backs in football over the past two seasons despite a mediocre athletic profile. Gillislee posted a +29.2 (No. 9) Production Premium in 2016 and a +36.5 (No. 7) Production Premium in 2015, while averaging 5.7 Yards Per Touch and 1.12 (No. 9) Fantasy Points Per Opportunity.
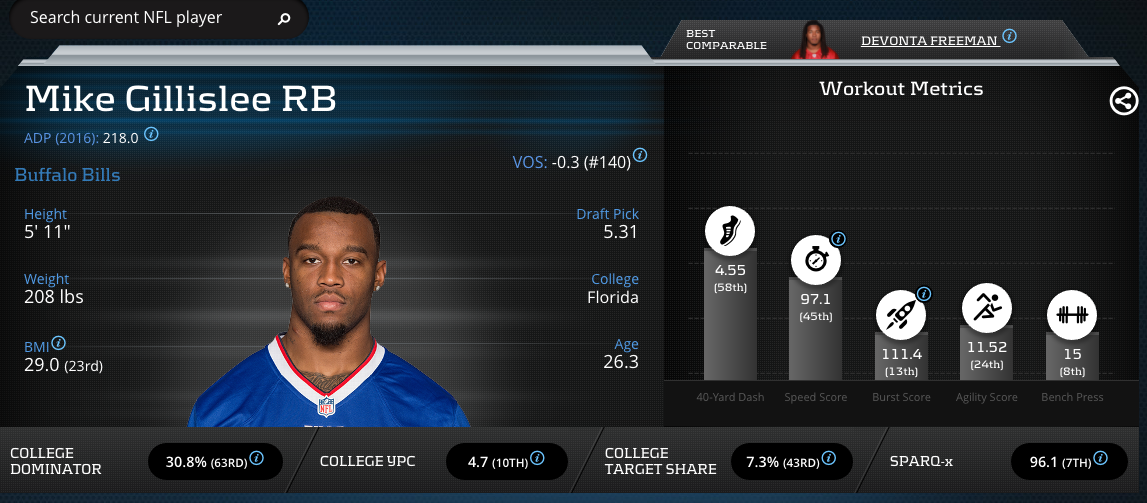
Mike Gillislee Advanced Stats & Metrics Profile
Although Buffalo’s offensive line ranked 22nd in run-blocking efficiency in 2016, Tyrod Taylor’s mobility was able to open up running lanes for both Mike Gillislee and LeSean McCoy. With 10 (No. 12) Breakaway Runs and a 9.9-percent (No. 1) Breakaway Run Rate in 2016, Gillislee would be an interesting pickup should McCoy go down.
2. Jalen Richard, Raiders: 6.0 YPC
1. DeAndre Washington, Raiders: 6.3 YPC
Lastly, we have Jalen Richard and DeAndre Washington of the Oakland Raiders, who were able to accrue 5.9 (No. 9) and 5.7 (No. 15) Yards Per Touch, respectively, in 2016 behind Oakland’s powerful offensive line. With Latavius Murray not expected to return, both backs stand to see an increased Opportunity Share next season. If that happens, expect DeAndre Washington to break out.
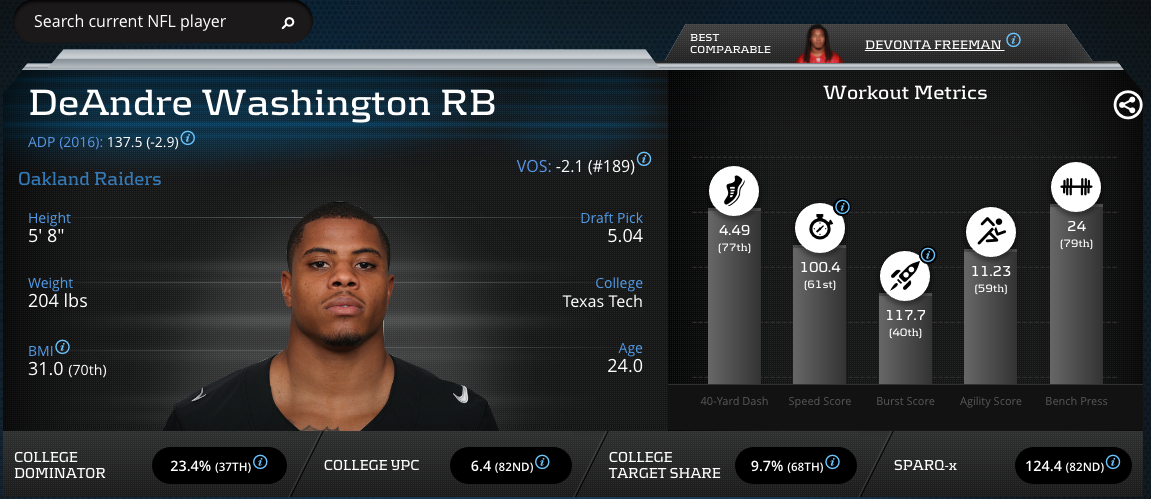
DeAndre Washington Advanced Stats & Metrics Profile
DeAndre Washington, with a 124.4 (82nd-percentile) SPARQ-x Score, is the superior athlete, and posted an 8.1-percent (No. 5) Breakaway Run Rate in 2016. Washington also averaged 6.4 (82nd-percentile) College YPC and received a 9.7-percent (68th) College Target Share, showing that he could at the very least develop into the primary 3rd down back for the Raiders. The Oakland offense is only going to get better, and luckily Washington is along for the ride.
https://www.youtube.com/watch?v=ciQX_YYpUgg&t=18s

