
The #NeverZeroRB fortress has grown strong. Forged from the bowels of recency bias and built on the supple back of variance, the #NeverZeroRB armies gorge themselves on the fruits of randomness.
All the while, taunting the Zero RB knights on their quest:
“I don’t use any draft strategy, I just pick the right players.”
“Running backs are just safer options in the first round, there are only so many true bellcows.”
“I won without using Zero RB, so Zero RB is dead.”
#NeverZeroRB stands defiant like the fabled black knight. Overconfident despite losing limbs left and right. What are you gonna do? Bleed on me?
Now I consider myself a Zero RB proponent, but going into the off-season I became determined to keep an open mind and investigate the merits of the strategy for myself. One of my greatest teams ever had a RBx3 draft start of Jamaal Charles, DeMarco Murray and Arian Foster. We can all probably identify with the glorious experience of locking great running backs into your weekly lineup. On the other hand, I have also researched and implemented Shawn Siegele’s Zero RB strategy from RotoViz.com, so I believe I can be somewhat fair in my analysis.
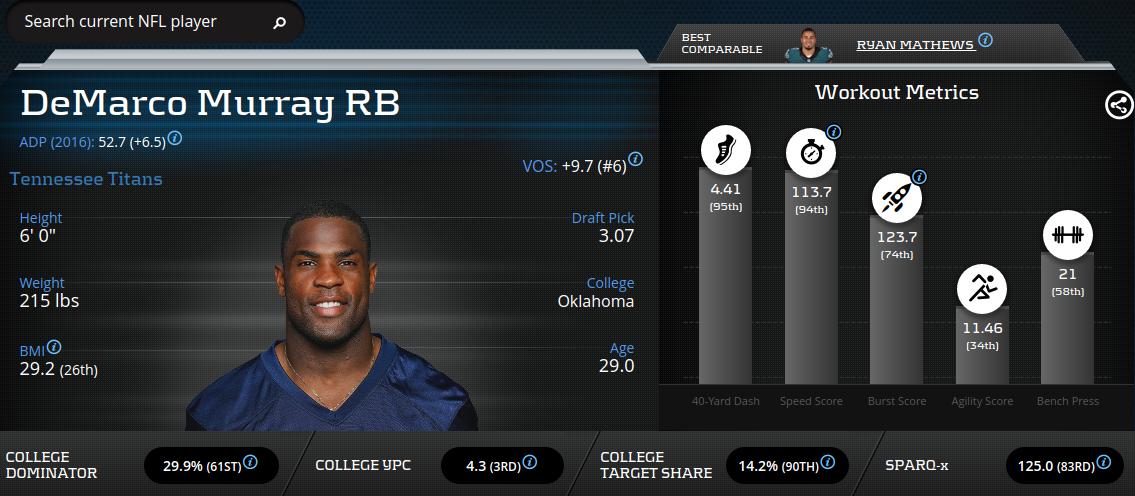
DeMarco Murray Advanced Stats & Metrics Profile
The arguments surrounding the strategy on both sides left me wanting a more complete view. For instance, I understand that positional injury fragility rates are lower for wide receivers than running backs. Therefore, wide receivers should have an expectation for more games played. However, this fact alone is not particularly meaningful. Many factors other than injury rates combine to describe the opportunity, efficiency and ultimately the value for a given player. In order to provide a fair comparison of strategies, we will work through the following questions:
- How can we quantify draft strategies in a balanced way to determine the range of possibilities?
- Do these possibility differences allow a drafter to lean towards any default starting strategy?
- When should draft context allow the nuanced drafter to pivot from a default strategy?
The Random Path
Each football player’s season follows a unique and random path, winding through 16 games. In probabilistic sense, an infinite number of paths are possible. Embracing and quantifying this randomness, should logically inform our approach to fantasy football.
Fantasy football draft strategy and roster construction concepts alike, should take into account the range of expected possible outcomes. If we could accurately predict player opportunity and efficiency, then we would be able to accurately predict fantasy point totals. However, as player opportunity and efficiency are inherently complex factors which are highly sensitive to randomness, we cannot reasonably predict player value.
Using a baseline representative as the “replacement level” (RB49, WR49, TE19, QB19), player value can be compared across positions. The chart below shows the randomness of the first 12 rounds of a 12 team ppr draft in 2016.
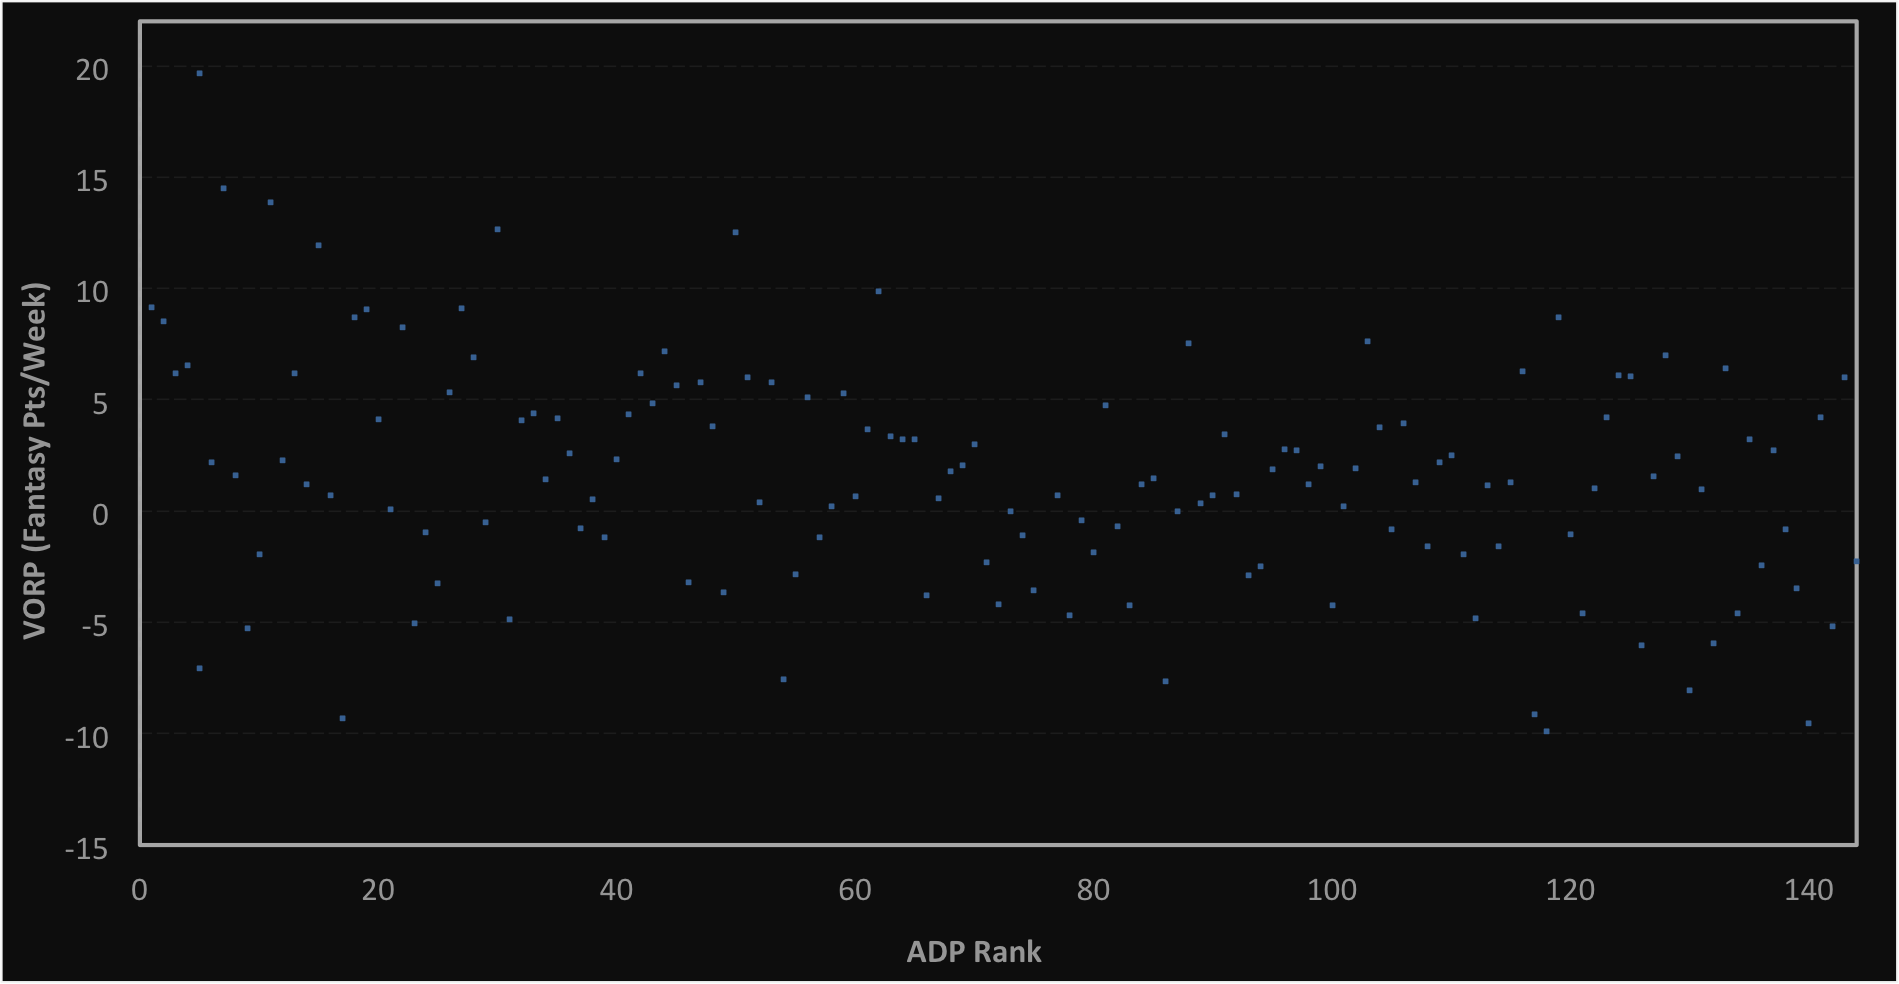
2016 Value Over Replacement Player vs. Average Draft Position Rank
The variance in value is striking. In order to determine the range of possibilities and quantify draft strategies, let’s restrict our focus to only running backs and wide receivers. In addition we will expand the sample size to minimize the impact of randomness in our analysis.
Range of Outcomes
How can we quantify the range of possibilities for running backs and wide receivers? Our approach will be to look to the average draft as a basis to factor out the individual drafter’s skill level. Below is a chart which shows quantity and location for value in the average fantasy football draft over the past four seasons.
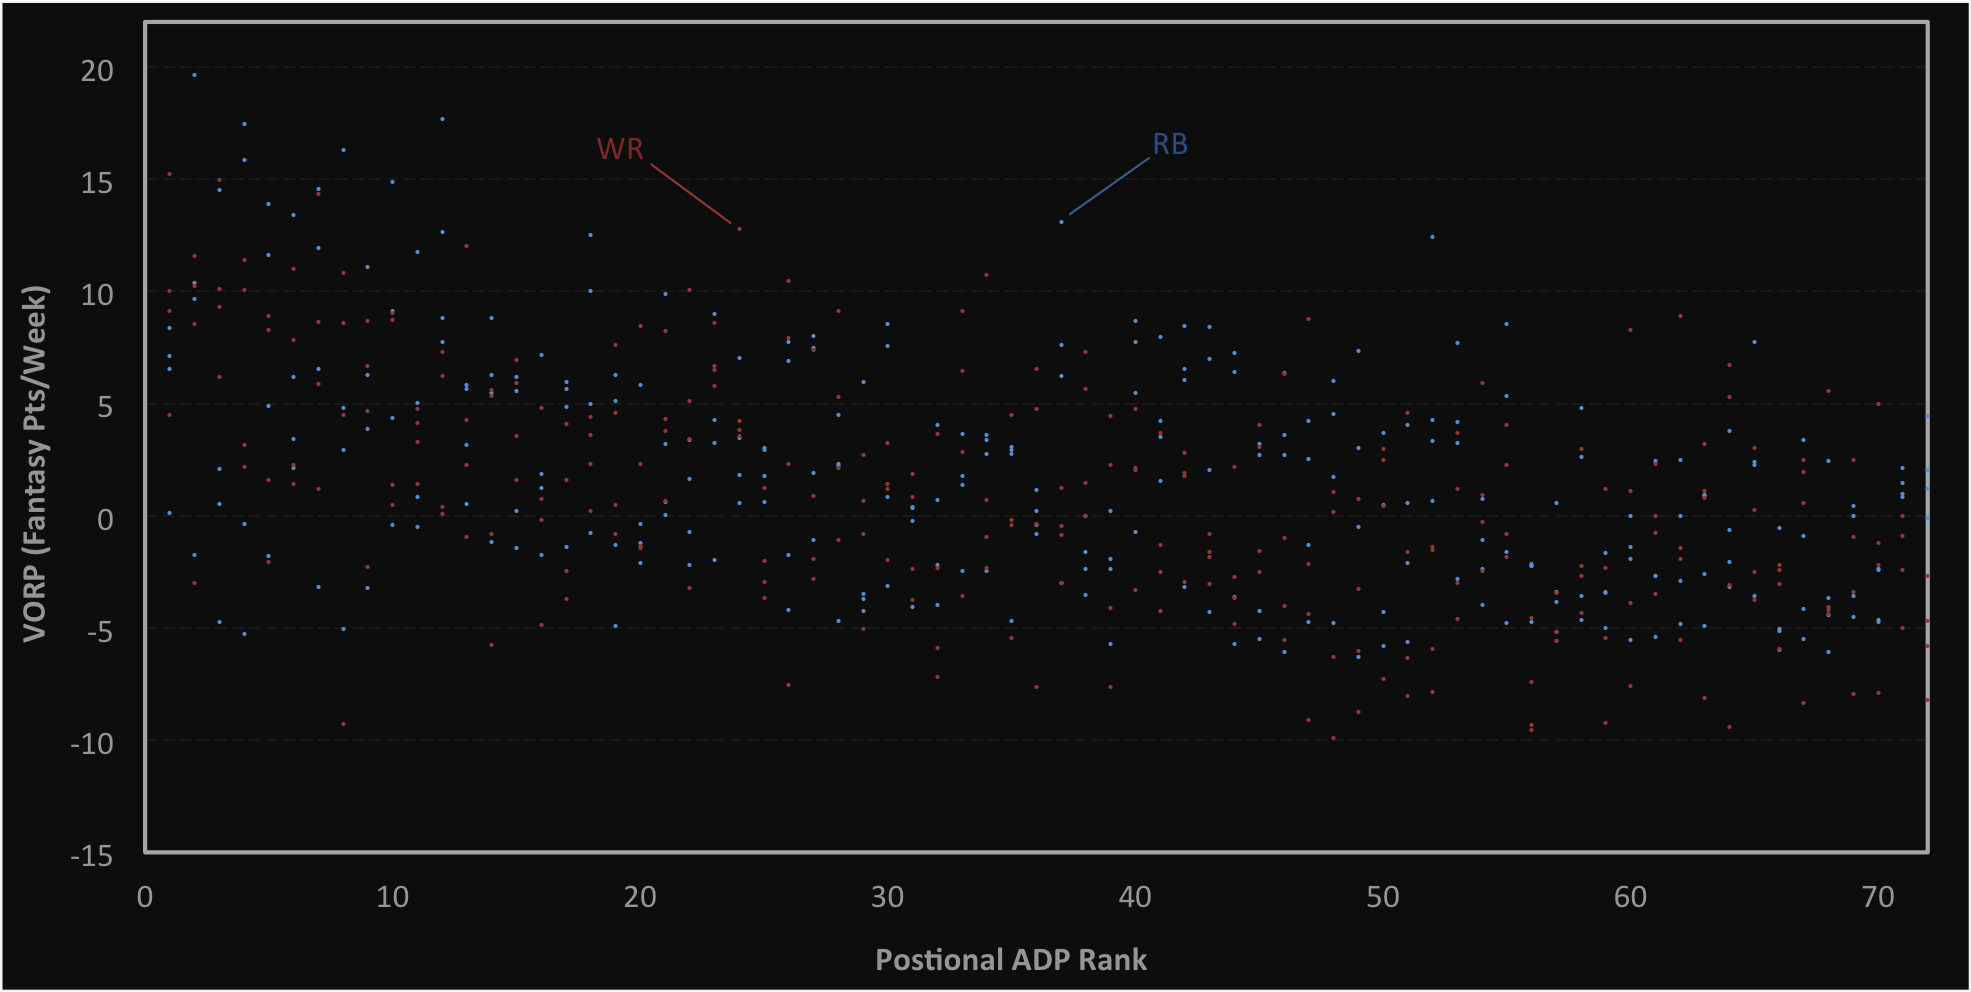
2013-2016 Value Over Replacement Player vs. Positional ADP Rank
Using Positional ADP Rank data from 2013-2016, the average value expectation for each position can be modeled (shown as Mid). The data set variance can then be modeled to represent outer bounds for the average player at a given Positional ADP Rank (shown as Low and High).
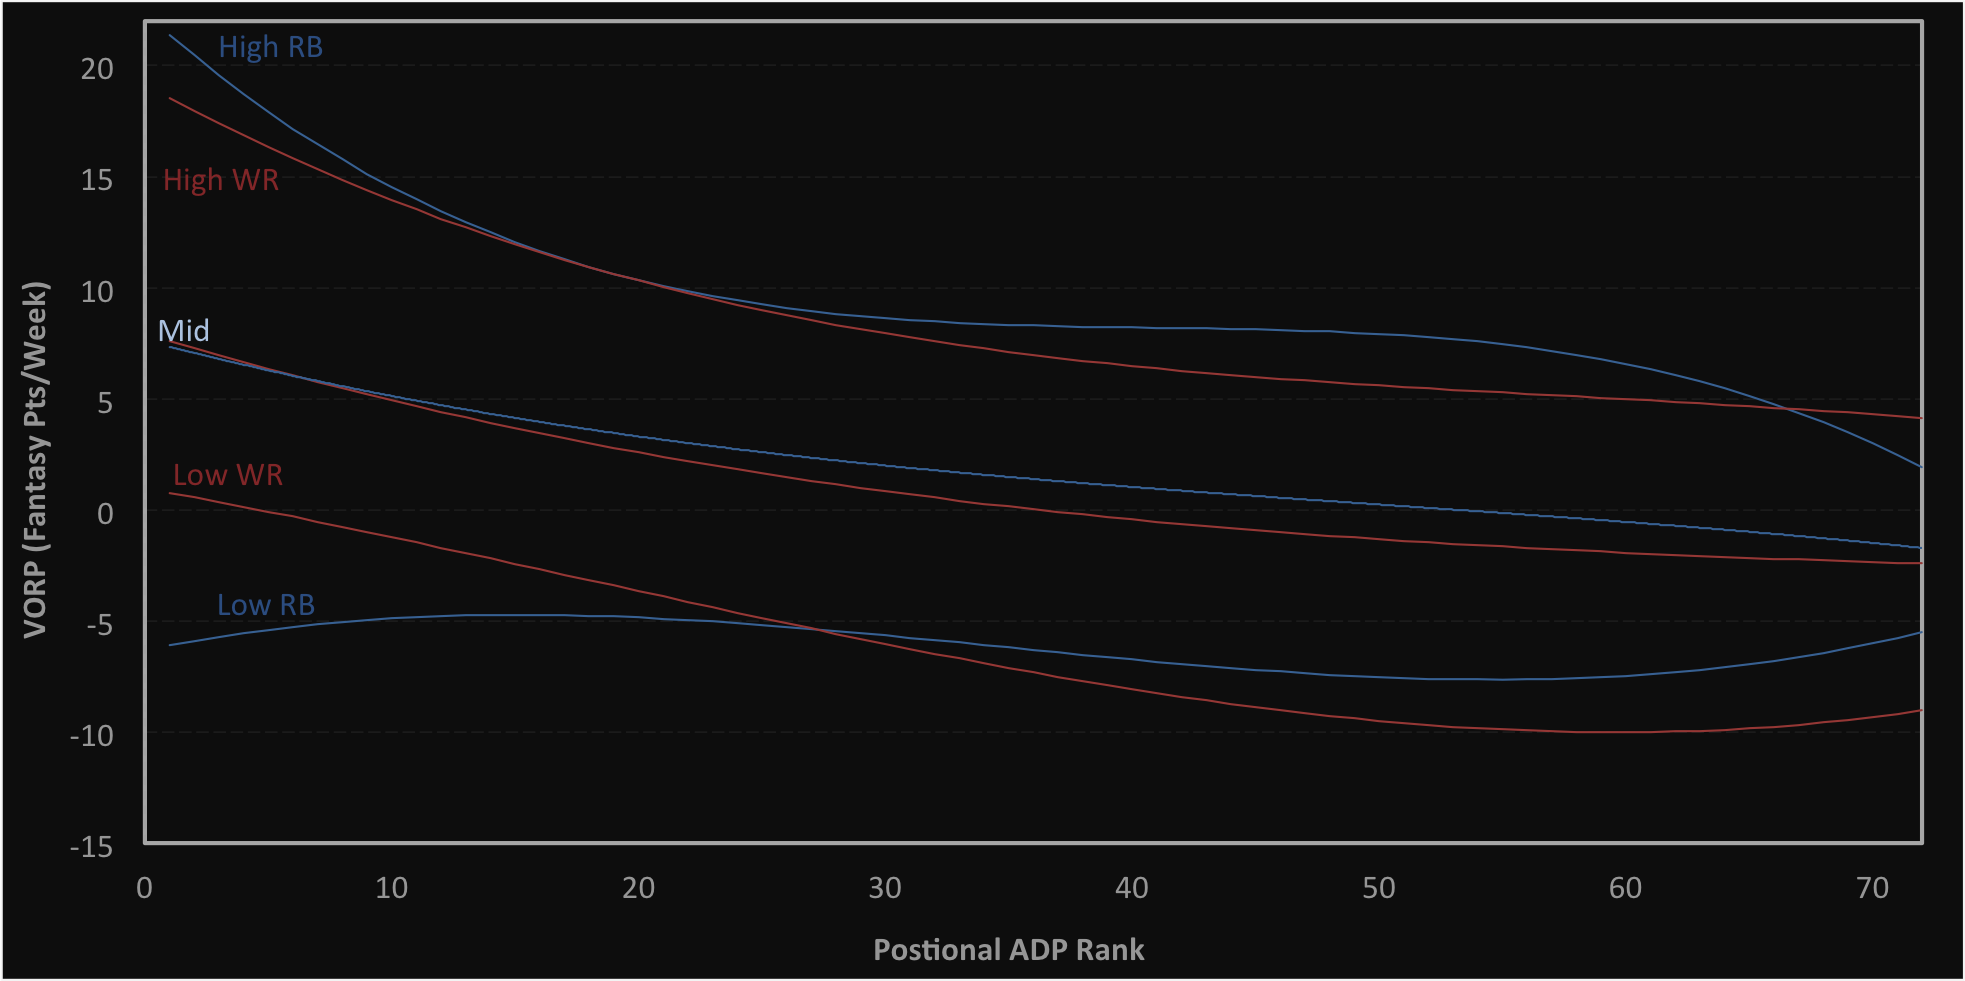
2013-2016 Value Over Replacement Player vs. Positional ADP Rank
This chart allows us to visualize and quantify the differences between the the running back and wide receiver positions as positional ADP changes. In general, running back owns a higher ceiling and lower floor early and wide receiver has a lower ceiling and floor later on in drafts.
Is Zero RB the Way?
Now that we have modeled the average value expectation and variance by position, we can simulate draft strategy concepts to compare outcomes.
The draft concept recipes to compare are: Zero RB, RB+Zero RB, Balanced and Zero WR.
- Blend each of the draft strategies according to the predefined positional selection ingredients listed below.
- For each ingredient, trim and select the top remaining player (by ADP positional rank).
- Simulations assume a predetermined relative RB to WR cost (i.e. at WR to RB +/- = 0, RB5 costs as much as WR5, at WR to RB +/- = -1, RB6 costs as much as WR5).
- QB, TE, DEF, K are not included in simulation (we are only comparing RB/WR selection concepts).
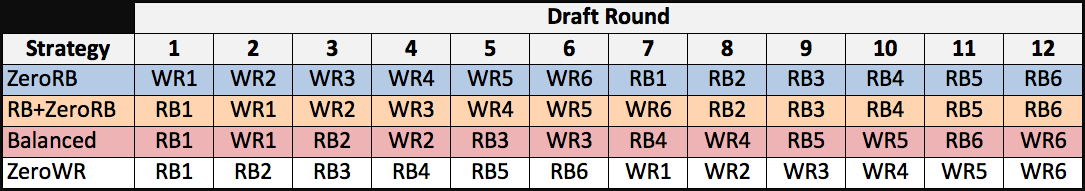
Position allocations by draft concept
The High Expectation Comparison yields the following rankings at WR cost = RB cost:
- Balanced: 112.6
- Zero WR: -0.5
- Zero RB: -2.2
- RB+Zero RB: -3.9
The High Expectation Comparison also shows that the Balanced draft and Zero WR draft actually have a small advantage in upside over Zero RB when compared draft to draft.
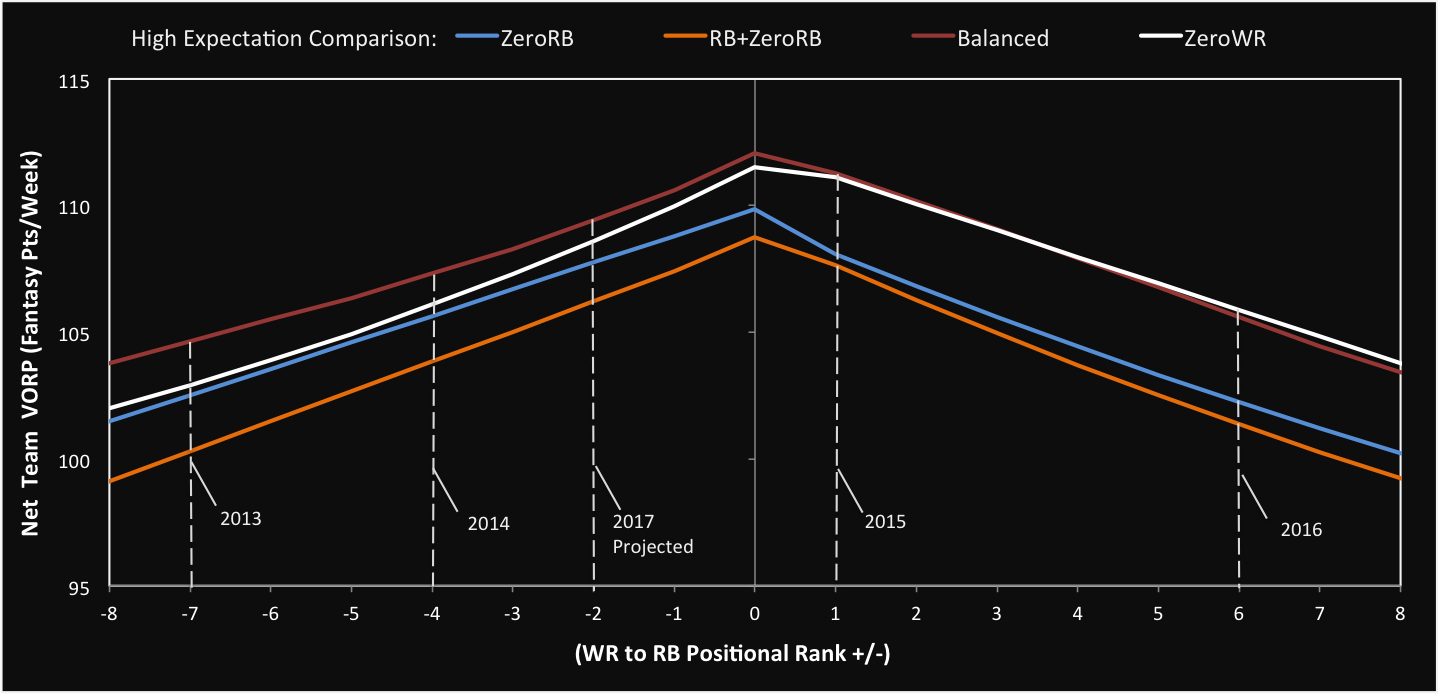
2013-2016 Value Over Replacement Player (High Expectation) vs. WR to RB Positional Rank (+/- )
The Mid Expectation Comparison yields the following rankings at WR cost = RB cost:
- Zero RB: 22.9
- Balanced: -2.2
- Zero WR: -2.5
- RB+Zero RB: -4.2
The Mid Expectation Comparison also shows that Zero RB strategy has the advantage when WR to RB positional rank +/- is less than +2. 2016 ADP had a WR to RB Positional Rank +/- of +6. In hindsight, this could have been a warning sign to pivot off wide receivers. However, the early 2017 projected WR to RB positional rank +/- of -2, is a hint that the pendulum has swung back to making Zero RB a profitable approach.
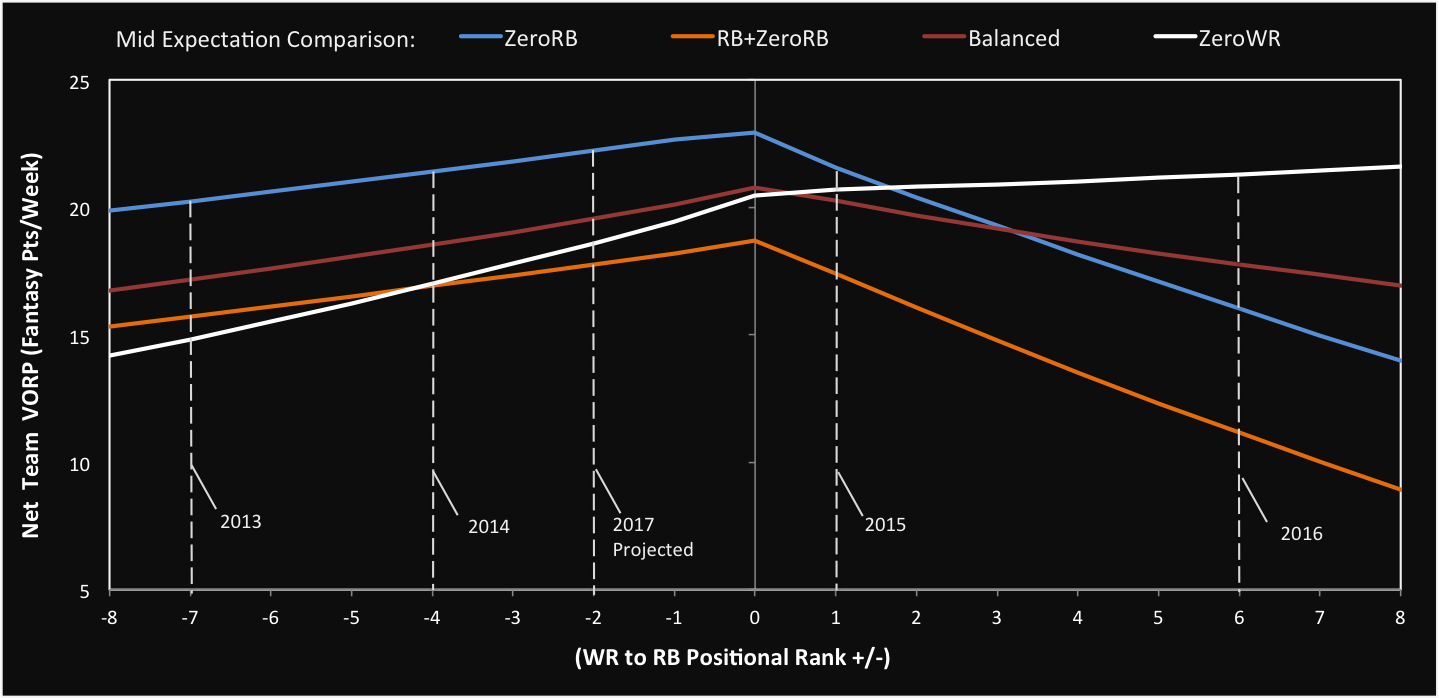
2013-2016 Value Over Replacement Player (Mid Expectation) vs. WR to RB Positional Rank (+/- )
The Low Expectation Comparison yields the following rankings at WR cost=RB cost:
- Zero RB: -62.0
- RB+Zero RB: -7.7
- Balanced: -9.4
- Zero WR: -15.3
The Low Expectation Comparison also shows that Zero RB has a large advantage over the other strategies.
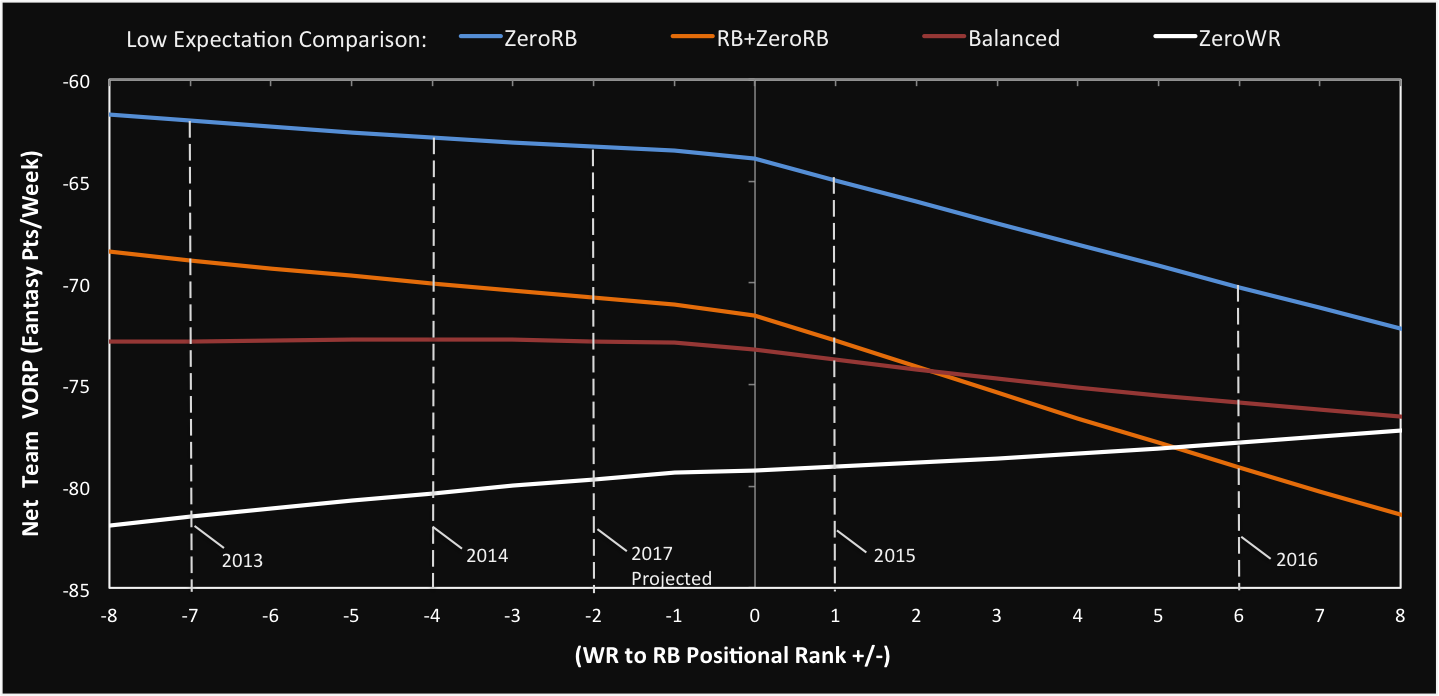
2013-2016 Value Over Replacement Player (Low Expectation) vs. WR to RB Positional Rank (+/- )
Assuming WR cost=RB cost, and using our low, mid and high expectations for each strategy we can compare the edge for Zero RB as a standalone draft strategy. This does not factor in the additional value of Zero RB on the waiver wire which we will address later.
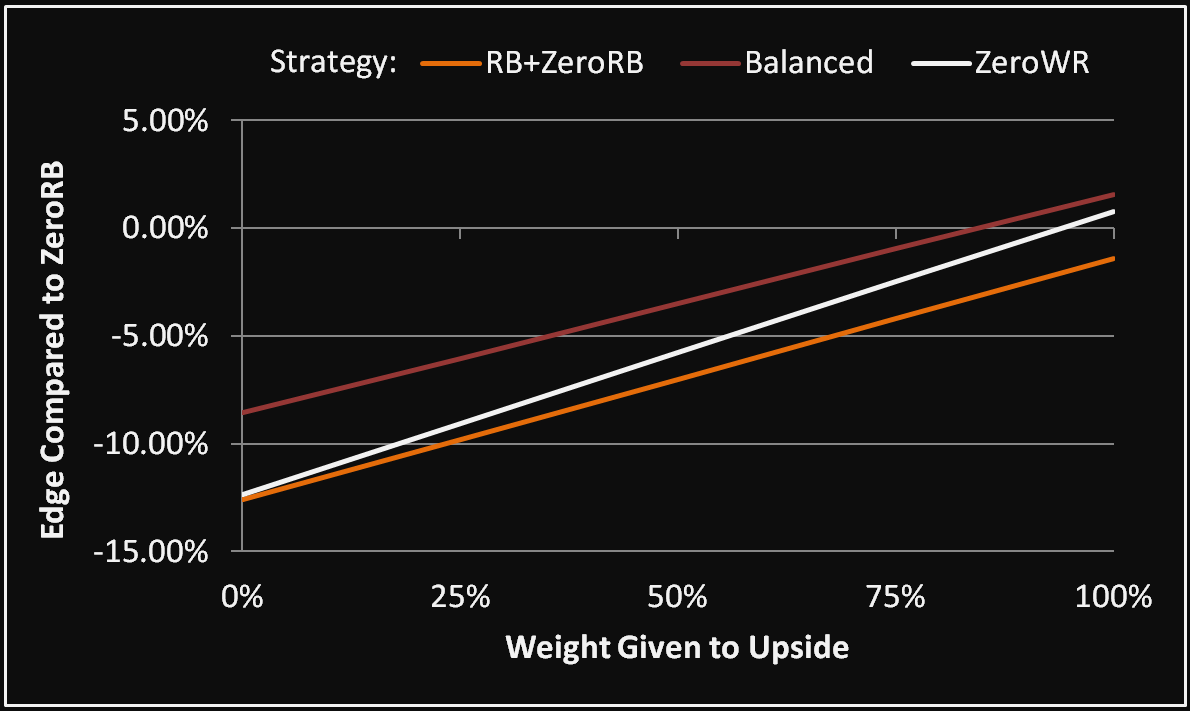
2013-2016 Edge Compared to Zero RB vs. Weight Given to Upside
Unless extreme weight is given to upside, Zero RB is shown to provide an advantage over the other strategies. When high, mid and low projections are weighted evenly, the Zero RB edge results are 6.02-percent (vs. Balanced), 9.06-percent (vs. ZeroWR) and 9.79-percent (vs. RB+Zero RB).
I set out to write this article to prove Zero RB as the optimal strategy to my friend Derek Pierson, who is a top high stakes player. In the end, I just proved to myself that Zero RB is a great tool, given certain draft conditions. I also learned that in the face of poor draft conditions (WR to RB Positional Rank +/- greater than +2), those using Zero RB blindly are no different than the overconfident #NeverZeroRB knight with no limbs.
Pierson put it well when he said, “Usually the way it goes, something hits the masses like Zero RB and the sharps capitalize by then being contrarian.”
The Quest for the Zero RB Holy Grail
Up until now we have been looking at draft strategy as a standalone item. What if we could quantify the Holy Grail of fantasy?…The waiver wire.
Using historical player ownership data, I was able to filter the weekly ownership percentage and ownership percentage change. This allowed me to generate the top week by week waiver pickup list retroactively for the average league. With that list I could attach a rest of season VORP to each player, giving me 960 total waiver data points. Below I have included the results of the top 240 waiver values for both running back and wide receiver, over the past four years.
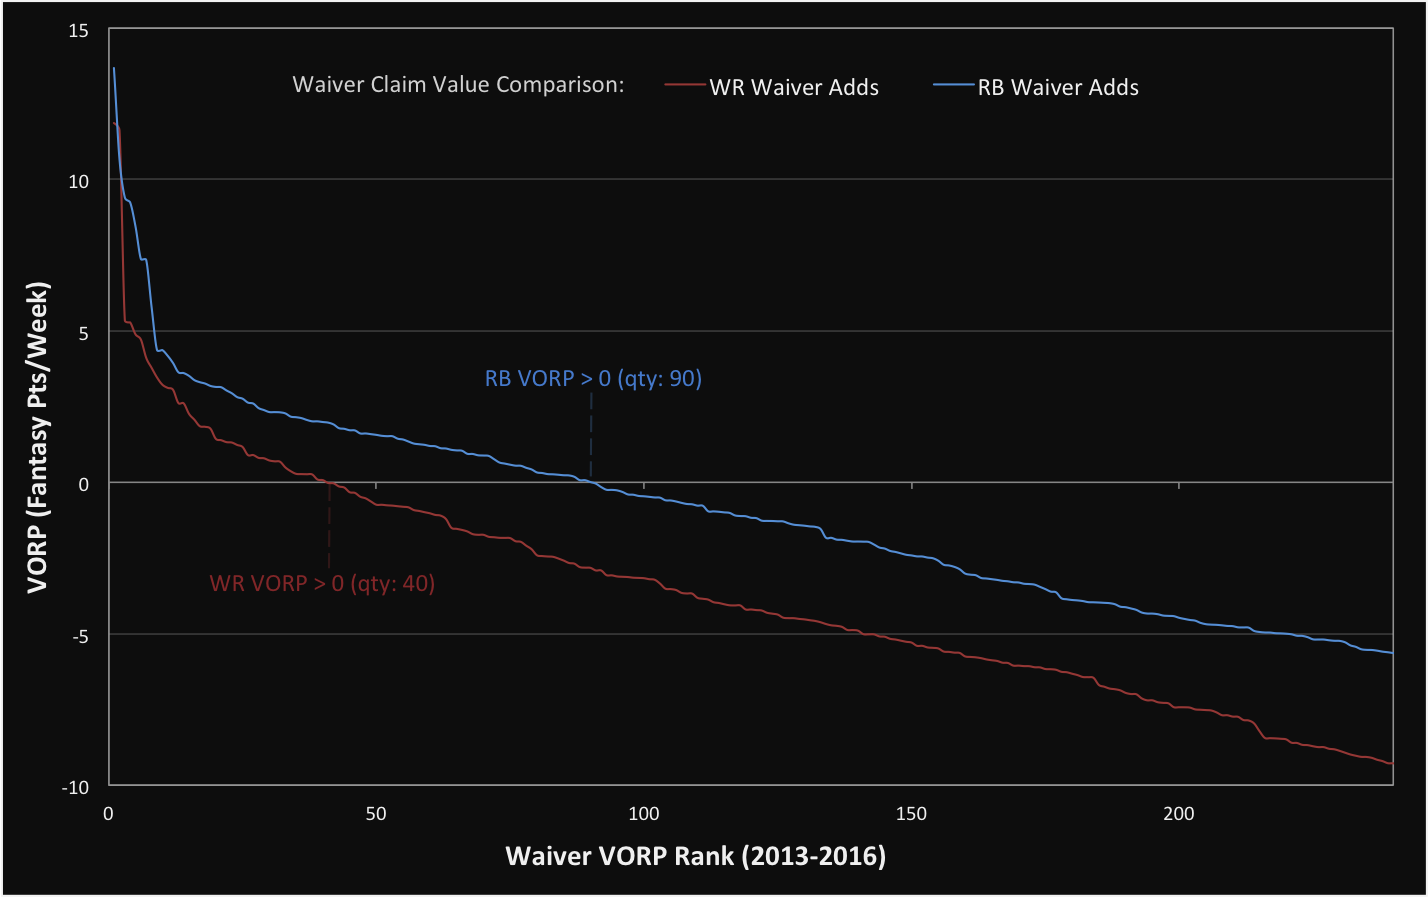
Value Over Replacement Player (Fantasy Pts/Week) vs. Waiver VORP Rank (2013-2016)
In reality, the waiver players that matter are those that impact our fantasy lineups, and weekly scores. To that end, waiver running backs were more than two times more likely than wide receivers to provide a positive VORP. Zero RB capitalizes on this fact, by strengthening the parts of the team that are least likely to have options available on the waiver wire.
Zero RB strategy. Difficult to prove, tricky to tame and should not be ignored.

