
Consistency is highly sought after by many in the fantasy football community. Since it’s human nature to avoid risk, we feel more comfortable putting a player in our lineup if we know he’ll reliably score 12-15 points compared to a player ranging from 5-25 points.
But is consistency a trait we can predict from year to year? Follow along as I use the power of statistics to better analyze the relationship between fantasy points and the consistency with which they’re scored.
How to Best Measure Wide Receiver Consistency
Conversations around consistency usually start with standard deviation, but this can be misleading. If you’re completely unfamiliar with standard deviation, think of it like volatility. A higher standard deviation indicates a wider range of outcomes and a smaller one indicates a narrower range of outcomes.
It may seem like common sense that a lower standard deviation equates to more consistency, which equates to a more desirable fantasy asset. However, this logic misses out on one crucial aspect of fantasy football: we want the players in our lineup to score as many points as possible! Let’s look at an example below.
In 2021, receiver A and receiver B had identical standard deviations of 7.47. Our intuition would tell us that they were equally consistent, right?
Wrong. Receiver A is Cooper Kupp, who lapped the field among receivers this year with 25.9 PPR points per game. Receiver B is Michael Pittman, who was WR24 with 14.0 PPR per game. Just by looking at a simple chart of their weekly scores, it is obvious they weren’t equally consistent for fantasy purposes:
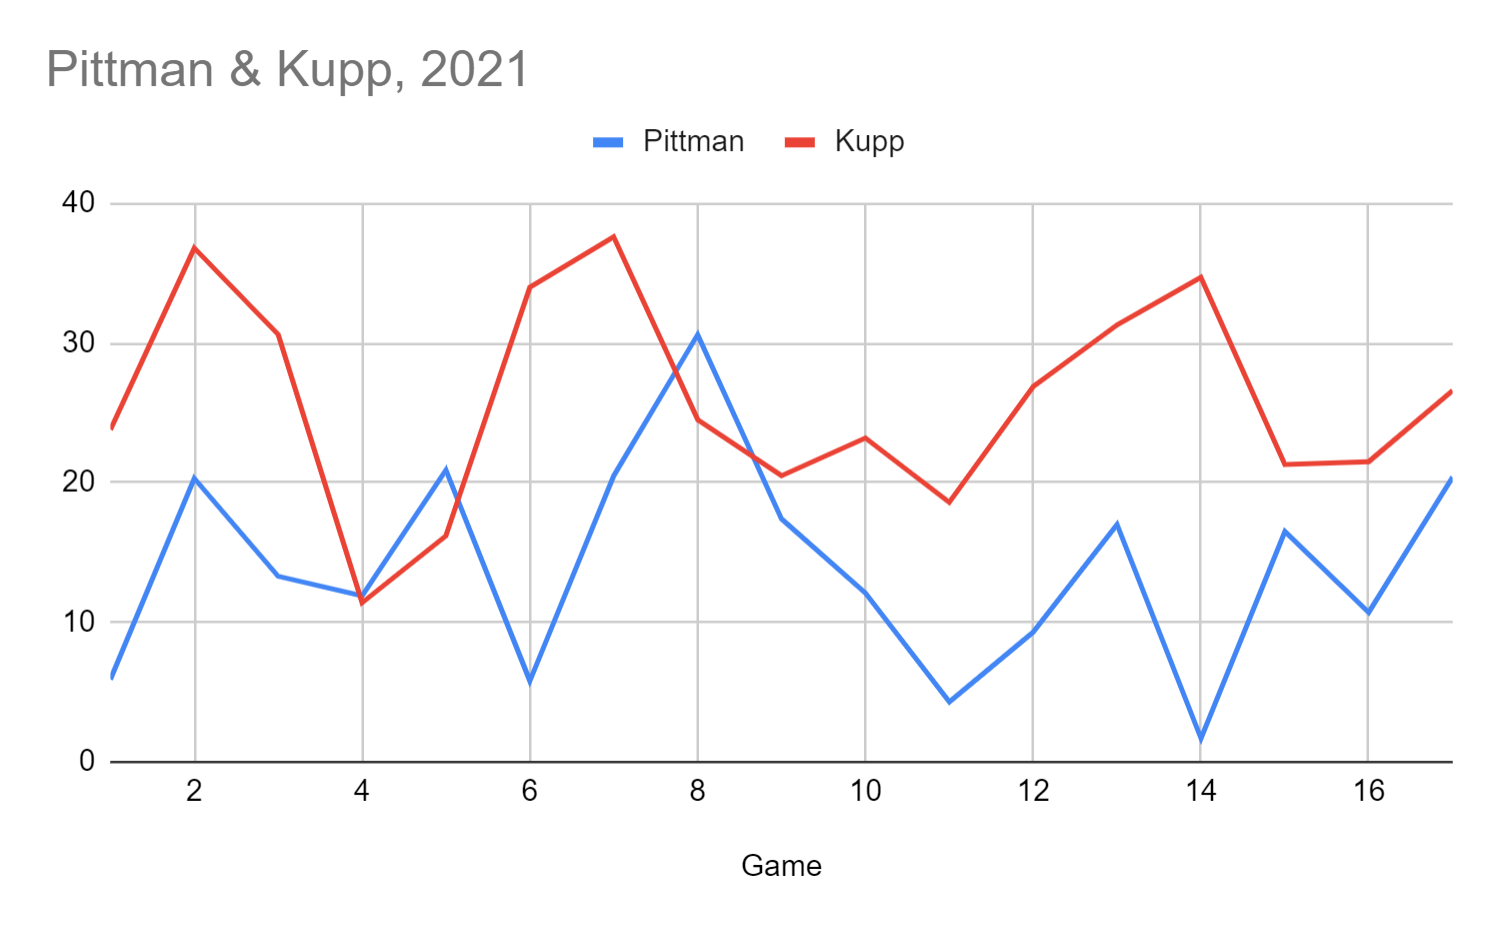
Kupp only had three weeks with less than 20 PPR points. Pittman, on the other hand, had four weeks with less than 10 PPR points. In order to think about consistency in a way that balances out players who have drastically different averages, we need to introduce the coefficient of variation.
Coefficient of Variation (CV)
The coefficient of variation (CV) is a metric used to help contextualize the standard deviation of a series of numbers. To calculate it, we take each player’s standard deviation (7.47) and divide it by their average fantasy points. By applying this to Michael Pittman and Cooper Kupp, we can see that Kupp had a CV of 0.29 (7.47/25.9) in 2021 while Pittman had a CV of 0.53 (7.47/14). Notice that while they have equal standard deviations, Kupp is much more stable week to week. Pittman’s CV is 83-percent higher than Kupp’s.
By looking at WR seasons from 2015-2021 with over 100 PPR points, we can get a general idea for cut-offs we can consider “consistent” or “inconsistent.” I found 507 such seasons, roughly 72 per year. The following histogram shows how common different ranges of CV are amongst the 507 WR seasons. A histogram gives us a clean look at which ranges are more common in a distribution based on the height of each bar.

The y-axis (height) is the number of occurrences, and we can see there have been just about 100 WR seasons between a CV of 0.65 and 0.75, while there have been just over 50 seasons with a CV between 0.75 and 0.85. We can see that the most common bucket is 0.55-0.65 and there are fairly even drop-offs on either side.
What Does It Mean?
Since there is a dense cluster of seasons in the middle, let’s identify those above the 70th-percentile as “consistent” and those below the 30th-percentile as “inconsistent.” For context, any receiver with a CV below 0.539 is considered “consistent” and a CV above 0.71 is considered “inconsistent.” This gives us 152 receiver seasons in the consistent group, 201 receiver seasons in the average group, and 154 receiver seasons in the inconsistent group. I’ll keep using these groups for the analysis in the rest of this article.
How Predictable is Wide Receiver Consistency?
Now it’s time for the good stuff: let’s see if consistency is a repeatable trait among wide receivers. To do this, we’ll find all the seasons in our sample of 507 where that same receiver’s following season also made it into the sample. In other words, we’ll look at all the pairs of seasons where a receiver scored over 100 PPR points both years.
When we do this, each transition between seasons becomes a data point. Amari Cooper, who has hit the cutoff all seven seasons, accounts for six transitions, while Antonio Brown‘s run from 2015-2018 accounts for three transitions (2015-2016, 2016-2017, 2017-2018). With this method, we’re able to identify 207 relevant transitions across the span of these seven seasons.
Furthermore, we can look at whether CV is a predictable trait for receivers by sorting each “year 1” and “year 2” of every transition as consistent, average, or inconsistent. Then we look at the pairs and what percentage of consistent year 1’s lead to consistent year 2’s, and so on. The results are in the following table:
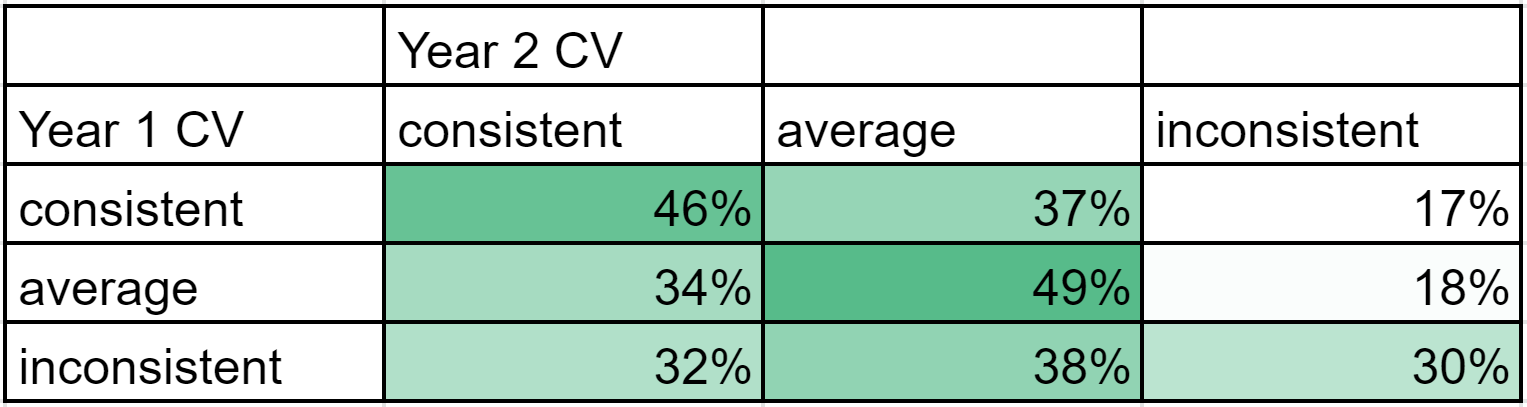
Judging by these results, there appears to be some relationship (albeit a weak one) between consistency from one year to the next. A receiver who makes it into the consistent bucket only falls to the inconsistent one 17-percent of the time in the following season. But we can see that these results are far from conclusive; for example, the inconsistent receivers made the jump to being consistent 32-percent of the time.
PPR Predictability
To get an idea for what we should consider to be a stable statistic, let’s look at the predictability of PPR points per game. For the purpose of this exercise, I labeled an “elite” season as greater than 15 PPR points per game, “starter” as 12.5-15 PPR points per game, “flex” as 10-12.5 PPR points per game, and “bench” as less than 10 PPR points per game. I ran the same exercise on the same sample of 207 seasons and here are the results:
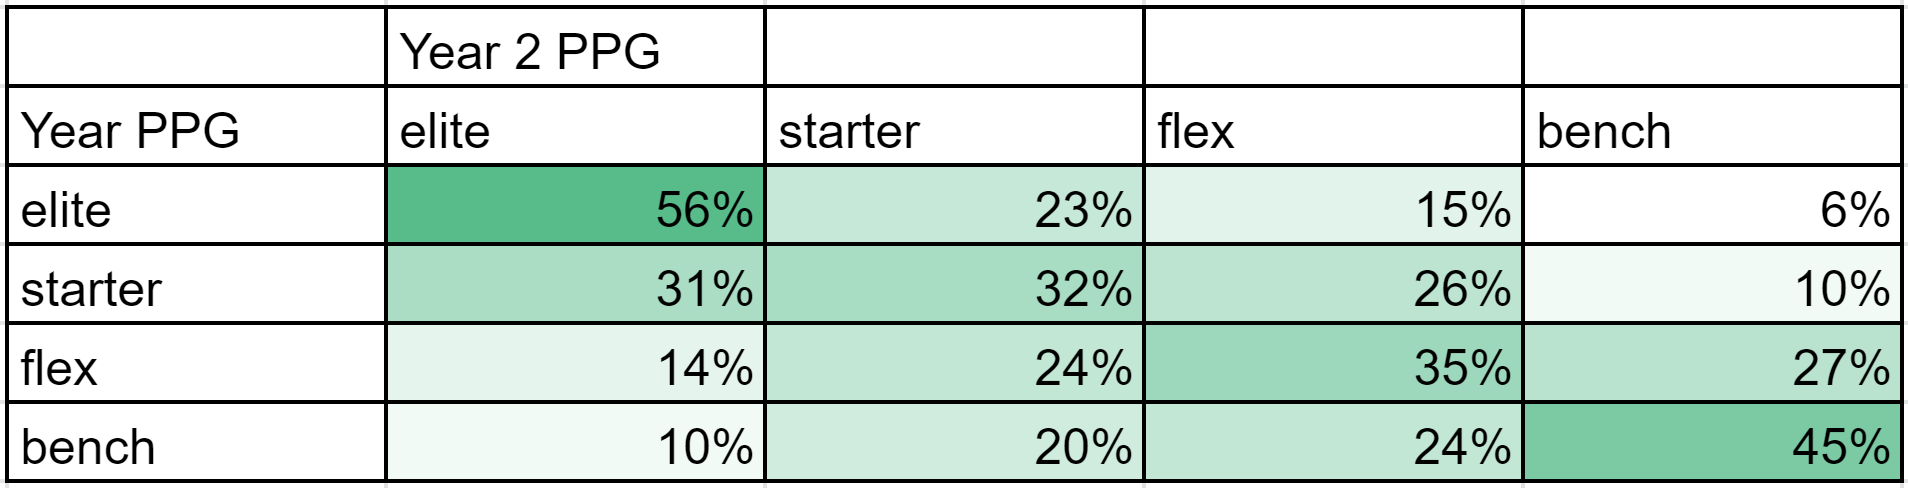
We can clearly see this is a much stronger relationship than CV. A receiver who falls into the elite bucket has a 79-percent chance of starter or better production the following year! A receiver who can’t break 10 PPR points per game has only a 30-percent chance of breaking into the starter or elite buckets. Most visually satisfying of all, there is a clear pattern across the diagonal of this chart, which indicates the most likely outcome for every receiver is staying in the same bucket as last season.
Putting It All Together
The final piece of this puzzle is uncovering the relationship between PPG and CV. Do wide receivers who score more points also score more consistently? Intuitively, we would expect there to be a relationship since you need to be scoring on a consistent basis in order to rack up a high PPG. Let’s see what happens when we plot the 507 seasons of at least 100 PPR points…
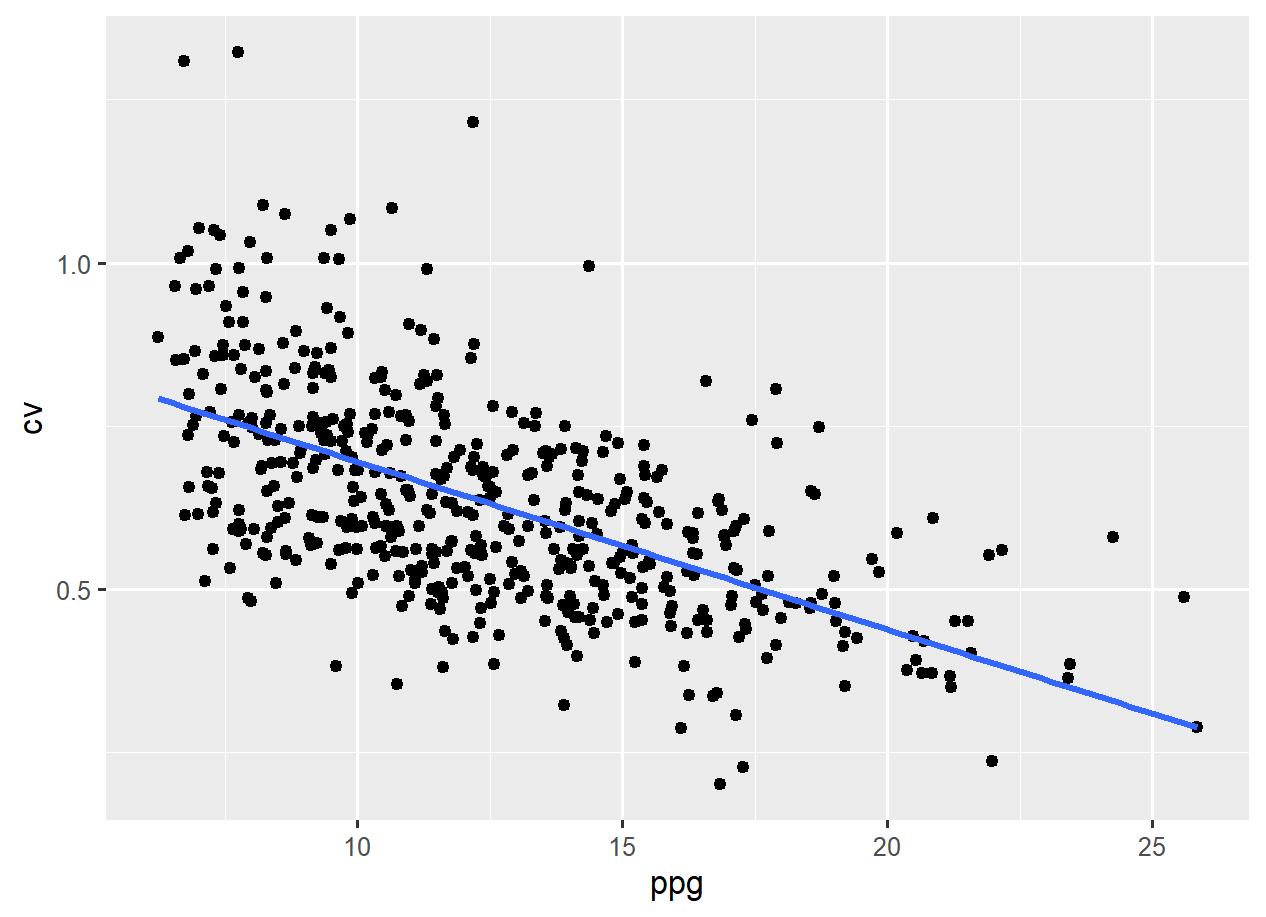
The data clearly shows the relationship between PPG and CV that we expected. We know that a lower CV indicates more consistent scoring, so the strong downward trendline on this chart indicates that higher scoring wide receivers are more consistent fantasy scorers. Therefore, we can assert that a receiver being consistent is not an isolated trait; instead, we should think of consistency as a byproduct of simply scoring points.
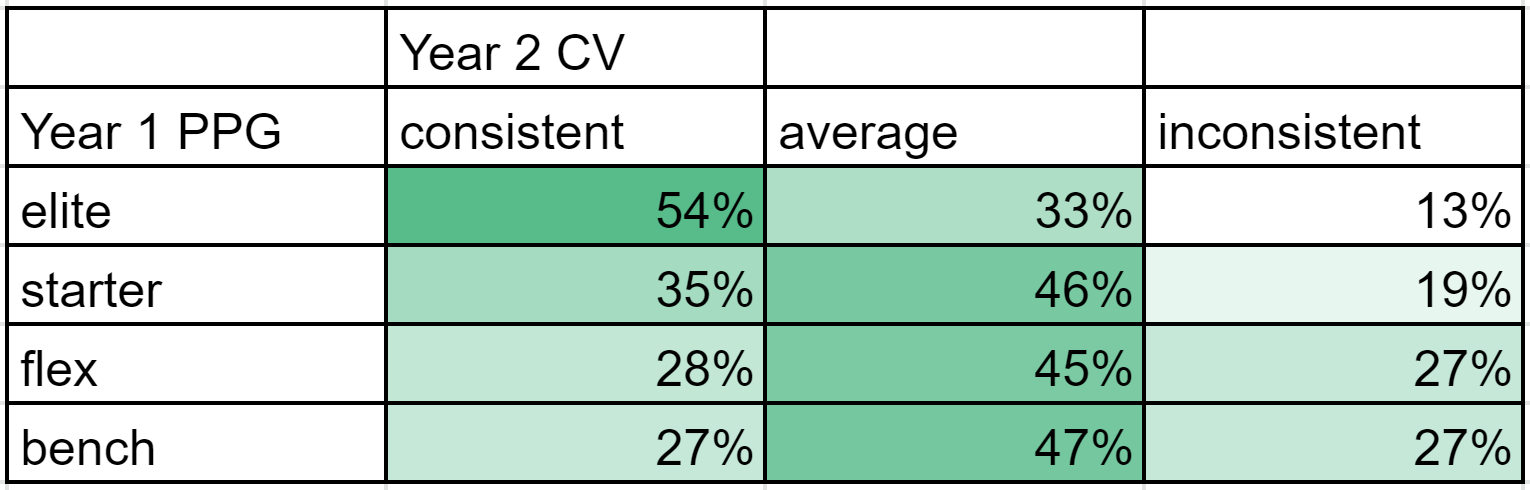
We can take this one step further by looking at the effect of PPG in year 1 on CV in year 2. With the stronger year-to-year correlation of PPG and the strong relationship between PPG and CV within the same season, we find that PPG in year 1 is predictive of CV in year 2. If you’re looking for consistency, you’re better off looking at the past year’s points per game, rather than the past year’s consistency!
Final Thoughts and 2022 Look-Ahead
Mike Williams in 2021 is the perfect player to consider in the context of this analysis. He finished as the WR14 in PPG by averaging 15.4 PPR points per game, but conversations about his outlook in 2022 are centered on his inconsistent production. His six games with more than 20 PPR points and seven games with fewer than 10 PPR points are worrying many drafters, yet his CV only checked in at 0.687, on the slightly inconsistent end of our “average” bucket. History would suggest that Williams’ CV will improve and he is likely to stay productive in fantasy. Then bake in the context of his contract extension, the fact it will be his second year in the Chargers’ new offensive system, and the development of Justin Herbert, and you’ve got a clear buy for 2022 despite the public’s concerns about his consistency.
This research shows that consistency is much less sticky year-to-year than points per game, and the two are strongly related within the same season. As a result, the past year’s PPG is as good (or better) at predicting the next year’s CV as the previous year’s CV. When you’re on the clock in your redraft leagues this year, don’t let your perceptions about a receiver’s consistency affect your decision.

