
The 2022 Colts Backfield Breakdown is part of an offseason series in which I take a deep dive into one NFL team’s backfield and examine the respective rushing performances of the players in it. In doing so, I hope to gain insights into key players from a talent evaluation standpoint, and using that evaluation as a baseline, from a dynasty valuation standpoint. The first installments in the series can be found here.
I’ll start by taking a quick overview of each team’s raw rushing volume and propensity to run the ball in general, and then dive into the player evaluation portion. Before we start, let’s define the metrics I’ll use as part of those evaluations:
Key Metrics
Yards per Carry+ (or YPC+)
The degree to which a player’s raw yard per carry average exceeds or falls short of the collective yard per carry average of all other running backs on his team. Meant to be an overview of a player’s team-relative efficiency.
Box Count+
The degree to which the average amount of defenders in the box that a player faces on his runs exceeds or falls short of the collective average faced by the other running backs on his team. Considering that the outcome of any given rushing attempt is largely dependent on the amount of defenders in the box pre-snap, Box Count+ describes the relative degree of difficulty of a running back’s carries.
Breakaway Conversion Rate (BCR)
Quantifies performance in the open field by measuring how often a player turns his chunk runs of at least 10 yards into breakaway gains of at least 20 yards.
Box-Adjusted Efficiency Rating (BAE Rating)
Improves upon YPC+ by accounting for the box counts that a player carried the ball against. Looks at team-relative yards per carry against each individual box count, then uses a weighted average (based on total carries against each box count) to generate an overall score. A score of 100-percent indicates that a player is producing exactly the per carry output of his teammates, a score above 100-percent indicates that he is outdoing their per carry output to whatever degree, and vice versa for a score below 100-percent.
Relative Success Rate (RSR)
Measures player consistency using Success Rate, but relative to his teammates and adjusted for the box counts that he faced in the same way that BAE Rating is. “Success” on a given carry is defined by gaining 40-percent of yards needed on first down, 70-percent of yards needed on second down, and 100-percent of yards needed on third or fourth down. A score of 0.0-percent indicates that a player is succeeding on exactly the same percentage of his carries as are the other backs on his team, a positive score indicates that he is succeeding more often than his teammates are, and vice versa for a negative score.
Volatility Rating
Measures the disparity between a running back’s percentile ranks in BAE Rating and RSR in order to indicate how volatile a player’s per-carry performance is. High overall efficiency paired with low rate of success indicates boom/bust output, while low overall efficiency paired with high rate of success indicates steady, low-ceiling output. Measures degree of volatility, not quality of performance.
Composite Efficiency Score (CES)
Presents a single-metric overview of the quality of team-relative performance a player produced on his carries in a single season. Calculated using the average of a player’s percentile ranks in Box-Adjusted Efficiency Rating and Relative Success Rate, represents player performance on a 0-100 scale.
Team Rushing Volume
The Indianapolis Colts were one of the run-heaviest teams in the NFL last season. Their 499 carries were good for No. 5 in the league and 47 more than league average. 2021 marks the third year in a row that they’ve finished in the top 10 in rushing attempt volume. They ranked No. 10 in 2020 and No. 5 in 2019.
Situationally, the Colts were a bit less run-obsessed last season than it might first appear. Despite a top-five carry total, they were “just” No. 10 in the league in early-down run rate in neutral Game Script situations (when win probability for either team did not exceed 80-percent), according to rbsdm.com. From 2018 to 2020, the first three years of the Frank Reich era, they ranked No. 14 in the same metric.
Also according to rbsdm.com, the Colts opted to run the ball more often than expected (given league-wide play-by-play data) in most down-and-distance situations. In nearly every situation other than first down, Indianapolis was pounding the rock more than other teams in the NFL, and 4-percent more often overall.
A presumed quarterback upgrade from the departed Carson Wentz to the newly acquired Matt Ryan could mean more passing volume in the year ahead, but the strength of this Colts team is their dominant running game. We shouldn’t expect that to go away in 2022.
Efficiency Numbers
Jonathan Taylor was obviously the lead back. But the other guys in Indianapolis, Nyheim Hines, Marlon Mack, and Deon Jackson, combined for nearly 100 carries. Here are the complete rushing efficiency profiles for each of those players:
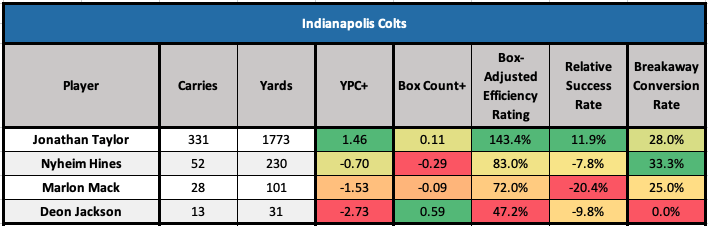
We’ll save Taylor for last because that’s the fun stuff, but nobody else in this backfield was impressive last year.
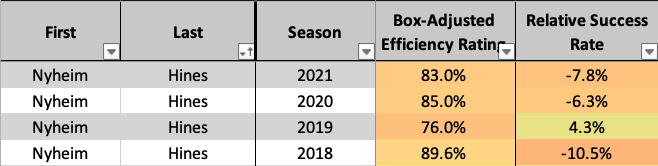
Running the ball isn’t really Hines’ thing. Still, he was a negative there relative to the contributions of the other backs in 2021. You might assume that that poor team-relative efficiency is largely due to Taylor’s incredible per-touch output. But Hines’ numbers have been roughly the same since he entered the league:
Mack started slowly after returning from the torn Achilles he suffered in 2020. He became a regular healthy scratch by midseason.
Jackson got little work and did nothing with it.
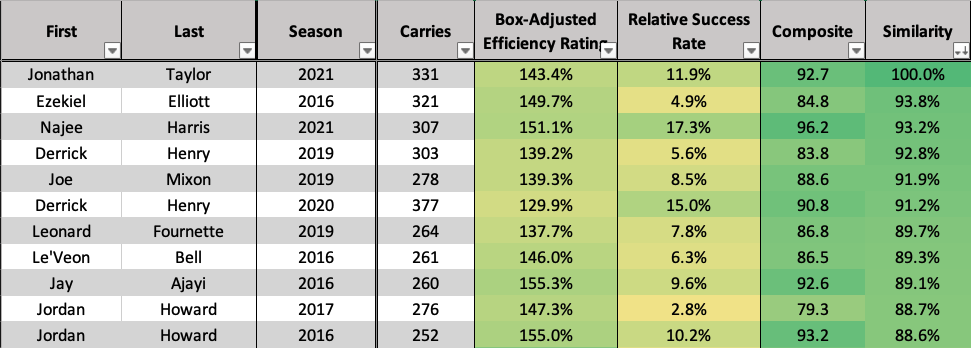
Now to Taylor: he was amazing last season. His 92.7 Composite Efficiency Score was the second-highest in the league last year behind only Najee Harris. And it’s the fourth-highest in the last six years among backs with at least 250 carries; behind only 2017 Kareem Hunt, 2021 Harris, and 2016 Jordan Howard.
Using similarity scores generated from Taylor’s carry volume, Box-Adjusted Efficiency Rating, and Relative Success Rate, the 10 most comparable seasons to Taylor’s 2021 campaign (since 2016) are the following:
So Now What?
Jonathan Taylor is properly valued as the no-doubt first running back off the board in all formats. He’s the best pure runner currently in the league, and one of the best in recent history.
Nyheim Hines has some fantasy utility as a satellite back. But nobody else on this team should see lineups unless Taylor gets hurt. That event would be interesting, because there’s not much clarity on who the next man up would be. Marlon Mack is now in Houston, and the other backs currently under contract in Indianapolis are Jackson, the recently signed Phillip Lindsay, and UDFAs D’Vonte Price and C.J. Verdell.
Jackson isn’t anything special. Lindsay has not been nearly as effective in recent years as he was early on in Denver. I don’t believe strongly in the talent of Price or Verdell. Price is probably the most interesting of these guys given his athletic profile, his productive stretch as an upperclassman at FAU, and the fact that he got some of the most guaranteed money among undrafted rookie running backs in the last decade.
Final Word
Continue drafting Jonathan Taylor as an elite RB1 and don’t stress over identifying his handcuff. That role probably doesn’t exist behind him in the same way that it does behind other workhorses like Dalvin Cook and David Montgomery. There just isn’t a player in this backfield with the clear talent to step in and command a three-down role. If you simply must, there are worse at-cost investments than taking a late shot on D’Vonte Price.

