
The 2022 Bills Backfield Breakdown is part of an offseason series in which I take a deep dive into one NFL team’s backfield and examine the respective rushing performances of the players in it. In doing so, I hope to gain insights into key players from a talent evaluation standpoint, and using that evaluation as a baseline, from a dynasty valuation standpoint. The first installments in the series can be found here.
I’ll start by taking a quick overview of each team’s raw rushing volume and propensity to run the ball. Then, I’ll dive into the player evaluation portion. Before we start, let’s define the metrics I’ll use as part of those evaluations:
Key Metrics
Yards per Carry+ (or YPC+)
The degree to which a player’s raw yard per carry average exceeds or falls short of the collective yard per carry average of all other running backs on his team. Meant to be an overview of a player’s team-relative efficiency.
Box Count+
The degree to which the average amount of defenders in the box that a player faces on his runs exceeds or falls short of the collective average faced by the other running backs on his team. Considering that the outcome of any given rushing attempt is largely dependent on the number of defenders in the box pre-snap, Box Count+ describes the relative degree of difficulty of a running back’s carries.
Breakaway Conversion Rate (BCR)
Quantifies performance in the open field by measuring how often a player turns his chunk runs of at least 10 yards into breakaway gains of at least 20 yards.
Box-Adjusted Efficiency Rating (BAE Rating)
Improves upon YPC+ by accounting for the box counts that a player carried the ball against. Looks at team-relative yards per carry against each individual box count, then uses a weighted average (based on total carries against each box count) to generate an overall score. A score of 100-percent indicates that a player is producing exactly the per carry output of his teammates, a score above 100-percent indicates that he is outdoing their per carry output to whatever degree, and vice versa for a score below 100-percent.
Relative Success Rate (RSR)
Measures player consistency using Success Rate, but relative to his teammates and adjusted for the box counts that he faced in the same way that BAE Rating is. “Success” on a given carry is defined by gaining 40-percent of yards needed on first down, 70-percent of yards needed on second down, and 100-percent of yards needed on third or fourth down. A score of 0.0-percent indicates that a player is succeeding on exactly the same percentage of his carries as are the other backs on his team, a positive score indicates that he is succeeding more often than his teammates are, and vice versa for a negative score.
Volatility Rating
Measures the disparity between a running back’s percentile ranks in BAE Rating and RSR in order to indicate how volatile a player’s per-carry performance is. High overall efficiency paired with a low rate of success indicates boom/bust output, while low overall efficiency paired with a high rate of success indicates steady, low-ceiling output. Measures the degree of volatility, not the quality of performance.
Composite Efficiency Score (CES)
Presents a single-metric overview of the quality of team-relative performance a player produced on his carries in a single season. Calculated using the average of a player’s percentile ranks in Box-Adjusted Efficiency Rating and Relative Success Rate represents player performance on a 0-100 scale.
Team Rushing Volume
The Buffalo Bills finished No. 13 in the NFL in total rushing attempts last season. Their 461 carries were just eight more than league average. That rank made the second year in a row that Buffalo was near the middle of the road in rushing volume. They finished No. 17 in the same category in 2020. In the previous three years of the Sean McDermott, and Brian Daboll era, the Bills were No. 6, No. 7, and No. 4, respectively, in carry volume. That shift between 2019 and 2020 perhaps not coincidentally coincides with quarterback Josh Allen taking big steps forward as a passer (as well as with the acquisition of wide receiver Stefon Diggs). Allen ranked No. 32 in the league in adjusted net yards per attempt as a rookie in 2018. He ranked No. 23 in the same metric in 2019. Then, he ranked No. 5 in 2020.
Game Script
According to rbsdm.com, the Bills ran the ball in early down and neutral game script situations (when win probability for either team did not exceed 80-percent) at the lowest rate in the NFL last season. The Bills opted to pound the rock on just 35.7-percent of those plays. They were similarly pass-centric in 2020 (finishing No. 29 in the same metric) after running the ball on early down and neutral script plays at the No. 12-highest rate in 2018 and 2019. More evidence of Buffalo’s recent pass-heavy inclination is the fact they threw the ball 5-percent more often than expected (given league-wide play-by-play data) considering the down-and-distance situations they found themselves in last season.
Daboll is now the head coach of the New York Giants. He has been replaced by Ken Dorsey who served as the team’s quarterbacks coach for the last three years. Dorsey was also the team’s passing game coordinator in 2021. Given the tenure Dorsey has on this offense, it seems reasonable to expect heavy carryover in the philosophy and play calling tendencies they’ve had in the last few seasons. Given that, league-average rushing volume is probably the best we can expect in Buffalo. This comes with an especially small slice of the pie available to running backs considering that Allen has been responsible for nearly a quarter of total Bills carries since joining the team.
Efficiency Numbers
Only three running backs saw work on the ground in Buffalo last season. Devin Singletary handled the lion’s share of the carries for the second year in a row. Behind him, Zack Moss approached triple figures in attempts while Matt Breida saw light work. Here are the full rushing efficiency profiles for each of those runners:
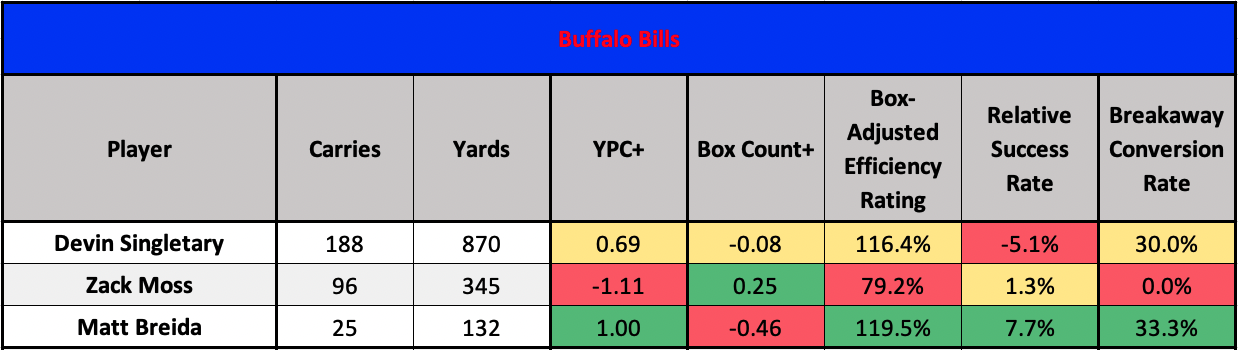
Singletary posted a Box-Adjusted Efficiency Rating above the 70th-percentile for the second time in his career last season. The 118.9-percent mark he notched as a rookie remains his career high. Conversely, he has now failed to reach the 0.0-percent mark in Relative Success Rate in all three of his NFL campaigns after also failing to do so in his final season at FAU in 2018 (the only of his college seasons for which box count data is available). The contrast between his performances in BAE Rating and RSR mean that Singletary has been one of the most boom/bust runners in the league since being drafted. His yearly Volatility Ratings have never dipped below the 78th-percentile.
Moss and Breida
Moss has had the opposite issue. With Volatility Ratings in the 23rd and 7th percentiles, respectively, through his first two NFL seasons, he has offered steady but low-ceiling output on the ground. His RSR this season is nearly identical to the 1.1-percent mark he posted as a rookie. Moss’s 18th-percentile BAE Rating represents a large step back from the 92.1-percent number he posted in 2018 (though that mark is plenty underwhelming on its own).
Breida has rarely been a high-volume runner. However, his 2021 performance is proof that he still has plenty of juice. He has now shown himself to be a quality ballcarrier on three different teams. Breida has also never posted a BAE Rating lower than 108.5-percent.
So Now What?
None of these guys were particularly useful in fantasy football last year. Singletary’s RB28-level performance in PPR points per game was the crowning achievement of this backfield.
While Breida is now with the Giants, former Georgia Bulldog James Cook was added to this running back room in the second round of the Draft. Duke Johnson was signed to a one-year deal in free agency. Taiwan Jones and UDFA Raheem Blackshear are the other backs currently under contract.
It’s difficult to project how the distribution of playing time will shake out, but given the archetypes represented by the players here, it seems likely the Bills coaches are content to throw the ball around the yard and focus on using their running backs as pass-catchers. Cook is well-suited for such a role given his usage and production as a receiver in college. Johnson has been one of the most skilled satellite backs in the NFL since he entered the league in 2015.
As a runner, Johnson had the highest Composite Efficiency Score among all number-two runners last season. Cook posted BAE Ratings in the 83rd-percentile among college backs in each of the last two seasons. However, he’s never been a high-volume runner or been asked to run into heavy defensive fronts. Both of these guys are dynamic space backs. Given the cost spent to acquire Cook, it wouldn’t shock me to see him lead this backfield in weighted opportunities.
Jones hasn’t carried the ball in an NFL game since 2019. Blackshear was a prolific receiver at both Virginia Tech and Rutgers, but the 139.3-percent BAE Rating he posted as a fifth-year senior last season was his first and only above the 100-percent threshold.
Final Word
Your guess is as good as mine as to who heads the pecking order in this backfield in 2022. Cook is a dynamic receiver with athletic juice who was taken early in the draft, but he’s 5-11, not even 200-pounds and is likely limited between the tackles. Singletary is a splashy runner but has plenty of holes elsewhere in his game. Moss is a plodder. Johnson is good but feels like Cook insurance.
If we’re shooting for the moon, Cook has to be the move here. The most likely scenario is that this backfield is gross, and nobody ends up as a trustworthy option on a weekly basis. The ceiling outcome is that Cook is immediately one of the best receiving backs in the league and slots into an offense that knows exactly how to use him. In that scenario, he could offer Nyheim Hines or Chris Thompson-type fantasy utility.

