
“Hey RotoUnderworld, why are you adjusting pro day 40-times by +0.05 seconds for 2021 prospects on PlayerProfiler.com?”
Some believe this article is long overdue. Others say it’s not necessary. This is an article for the people.
We never intended to create this article, since we had been adjusting pro day 40-times by 0.05 for the past half-decade, and there had been no chatter. No passionate response. No social media objections.
To date, not one person has ever DM’d me, furious over Kerryon Johnson’s official 4.52 from his 2018 pro day getting adjusted up to 4.57. But that all changed with the 2021 prospects.
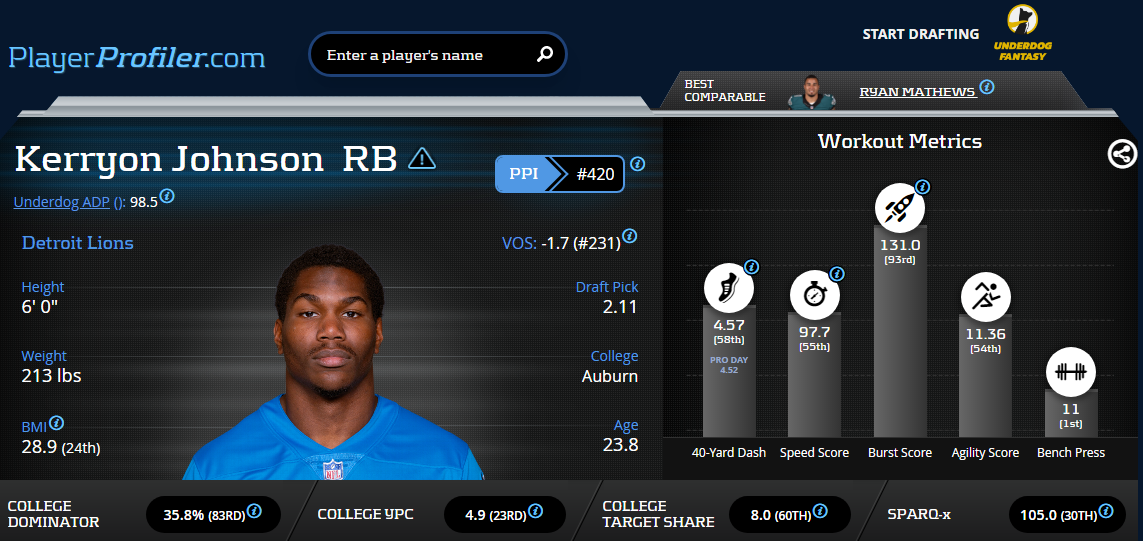
Kerryon Johnson Advanced Stats & Metrics Profile
There was no organized 2021 NFL Scouting Combine; rather, each college put on their individual pro day workouts, with the vertical jump, broad jump, 3-cone drill, and of course, the 40-yard Dash. In this piece, we’ll outline why we are adjusting the results of these 2021 pro day 40-times up by 0.05 seconds.
Before we dive into the data, you may be wondering why we would ever consider making an adjustment. Correcting 40-times, and the related advanced metrics such as Speed Score, creates more work for the RotoUnderworld crew, delays the release of player page data, and hurts the feelings of many NFL Draft gurus.

Combine Technology
At the NFL Scouting Combine, there are cameras at the starting line. Check out this video of John Ross’ record-setting 4.22 40-yard Dash from the 2017 Combine, and you can get a glimpse of the starting camera angle the Combine has at their disposal.
At the 2021 pro days, there were no cameras at the beginning, and you can skip to 1:55 of this video to see Ja’Marr Chase’s LSU pro day 40, where no cameras can be seen.
After a player has run their 40 and the unofficial time is released, these cameras at the Combine are then used to determine exactly when the player’s forward momentum started, which adds time to the player’s Combine 40 (the human eye consistently overestimates when the initial forward momentum of the player begins). The Combine has this technology; pro days do not.
In 2016, the NFL implemented its most recent technology upgrade when it rolled out the Zybek camera motion sensing system.
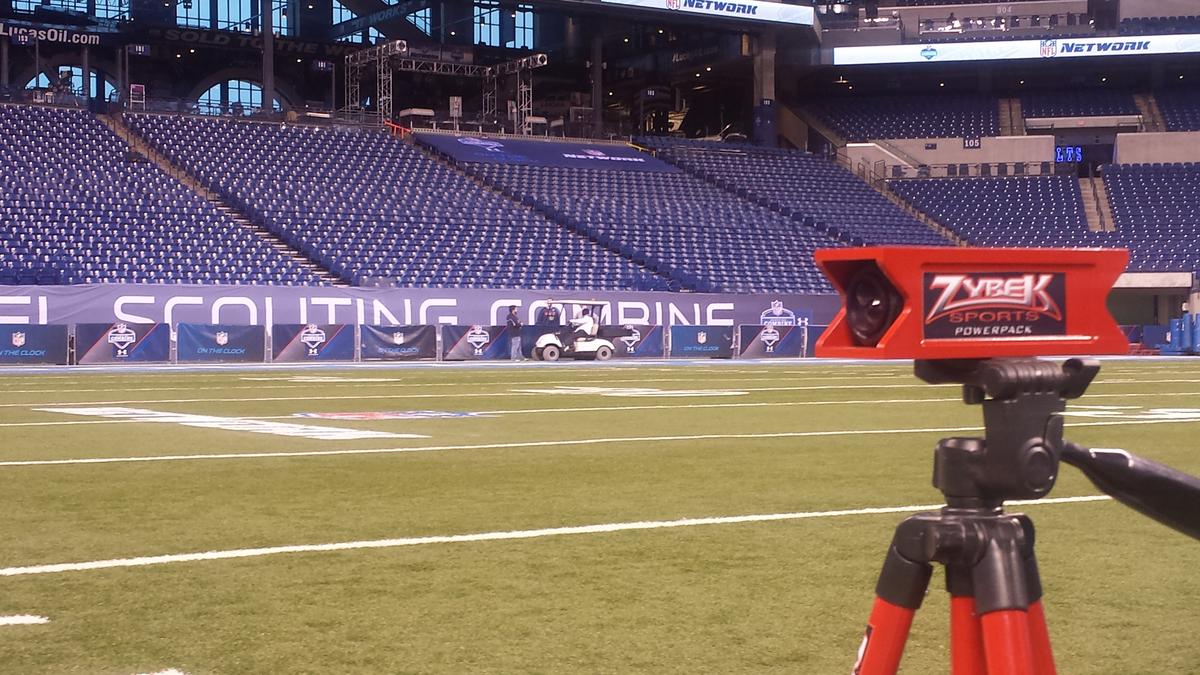
Zybek Sports Timing System
Did the switch to Zybek’s camera and motion sensing technology shift the results, bringing Combine and pro day 40-times closer together? Let’s investigate and find out.
Optimizing Player Evaluation
As the sub-4.40 pro day 40-times poured in throughout the 2021 prospect evaluation process, NFL Draft enthusiasts felt intuitively that pro day times were a tick faster. Expert analysts supported this belief, discussing “fast tracks” at Clemson and Ohio State, and pointing out that nine wide receivers ran sub-4.40 yard dashes across the 2021 college pro day circuit. This year, Kentucky won the fastest track award.
4️⃣0️⃣? at #UKProDay ??@bossmanfat1 @matayo_echols @jamindavis25 @ajrose_10 pic.twitter.com/mx5tybkgDO
— Kentucky Football (@UKFootball) March 31, 2021
If the data supports the intuition, and NFL Draft prospects do run faster at their pro day, then simply entering official pro day 40-times into the PlayerProfiler database would be a disservice to every player who attended the NFL Scouting Combine in previous seasons. It would also be a disservice to every talent evaluator, from NFL executives to fantasy footballers.
Comparing Amari Cooper’s advanced prospect profile, with athleticism metrics derived exclusively from NFL Scouting Combine results, to Ja’Marr Chase’s profile, populated 1:1 with pro day information, would necessarily inflate Chase’s percentile ranks at the expense of Cooper, and every other wide receiver who worked out at the Combine. If widespread intuition is correct, and pro day 40-times are generally faster, then as an NFL player data authority, it is our duty to adjust pro day results to be on par with NFL Combine results, offering the sports public a true apples to apples comparison of every player at every position.
What Does The Data Tell Us?
The data we started with for this analysis is the 648 RBs/WRs/TEs that have been drafted between 2010-2019, 10 years of data. Of these 648 players, 121 ran only at their pro day, 326 ran only at the Combine, and 190 ran at both the Combine and their pro day; we had no 40-time information for the remaining 11 players. Due to COVID-19, not only was there no 2021 Combine, but there were no college pro days the year prior.
We determined not to include other positions because:
- -Not every position group takes training and running the 40-yard-dash as seriously as RB/WR/TE
- -These are the three positions most hotly-debated in 2021
We have added pro day 40-times to our Data Analysis package so you can recreate this analysis yourself if you so choose. Transparency is important to us, as we are an unbiased provider of stats for every single player page on PlayerProfiler.
The Basic Analysis
We’ll start off as basic as possible, and slowly work our way up to a conclusion I’m comfortable with, and an adjustment to pro day times that the minions (and maybe a few buzzards) can get on board with.
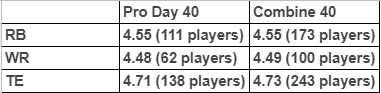
If we average all the pro day 40-times from these drafted RBs/WRs/TEs, and compared that to the average Combine 40-times, we see that the average pro day time is 4.552, and the average Combine time is 4.558. Just so we’re clear, this tells us next to nothing, but I know people are curious. We’ll address why these times are similar, and don’t matter, shortly.
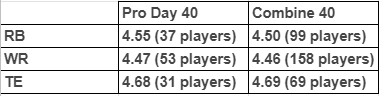
Adding on an additional layer of complexity, let’s get a simple average of these 2010-2019 prospects, separated by position.
Including ALL the 40-Times
The big issue right now is the Combine happens before the pro day, so a player with a very good Combine time has no incentive to run at their pro day. Logically, if a prospect runs a 4.42 at the Combine, why risk running a 4.48 or 4.53 at your pro day; just take the upper-percentile 40-time and move on in the draft preparation process. Julio Jones, after running a 4.39 at his Combine in 2011, had no reason to run again at his pro day after solidifying his elite 98th-percentile Speed Score.
Because of this, we should also look at players that ran both, as well as players that only ran at one or the other.
Only Players that Ran Both
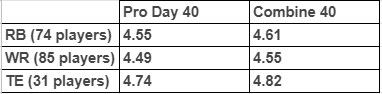
We can see that RBs are around 0.06 seconds faster at their pro day than the Combine from 2010-2019. WRs are 0.06 seconds faster and TEs are 0.08 seconds faster. It’s important to note that players running both may have run a little slower than expected at the Combine , and wanted to improve their time at their pro day. However, these are fairly dramatic differences in times; a 4.55 RB (like Chase Edmonds) has 64th-percentile speed, while a RB with a 4.61 (like T.J. Yeldon) has only a 43rd-percentile 40-time. While there may be some backing behind the motivation of prospects that ran both, I do not believe we can assume that the prospects running at both are only a subset that was getting injured while running at the Combine; we have to put some weight into the belief that pro day times may be faster than Combine times due to underlying differences.
Only Players that Ran at their Pro Day OR the Combine
The sample populations are wildly skewed here, as there are roughly three times the amount of RBs/WRs that run ONLY at the Combine compared to ONLY at their pro day, and roughly two times the amount of TEs that run ONLY at the Combine compared to ONLY at their pro day. I wouldn’t take much away from this chart, other than that sample population imbalance I mentioned. If you are looking for another takeaway, the RB/WR Combine times are faster in this subset, lending credibility to the idea that players who run quickly at the Combine are unlikely to run at their pro day.
To reiterate, the best population to analyze here is the group of 190 players that ran at both the Combine and their pro day. With simple averages across positions, we have now seen that pro day times are definitely faster than Combine times. We could stop here, but more advanced analysis can and will be done.
Handling Injuries
No players have been removed from analysis due to injuries. I can understand why you’d remove injured players, as you want all the 40-times to be accurate, but this is an incredibly slippery slope, and not in the fun “Breckenridge was icy, but I had a great time on the slopes regardless” type of way.
If you remove Ronald Jones because he tweaked his hamstring during his 40, then you should also remove Laviska Shenault, who underwent core muscle surgery the day after running at his Combine. Zack Moss ran with a hurt hamstring, too. Should we remove him?
Many expected former sprinter Chuba Hubbard to run sub-4.40 at his pro day, and then his official pro day time was north of 4.50. Should we exclude his time for any/all analysis and assume he was injured when running, even though no injury was reported?
Julio Jones ran a 4.39 at the NFL Combine in 2011, but he had a broken bone in his foot while running. Uh oh, should we exclude him? Should we adjust his time down to a 4.29 to account for his broken foot?
With every single player that misses expectations with their 40-yard Dash, we can squint hard enough and drum up a case that this player was injured. Any prospect that misses expectations at the Combine is incentivized to say they were injured, rather than let a slow time hurt their draft stock. I could make dozens, if not hundreds, of cases for players potentially being injured while running if they failed to reach expectations.
Notice how an already small sample can quickly become a baker’s dozen if we start nitpicking players based on supposed or confirmed Combine/pro day injuries. Sure, if we had a guy pull up lame 20 yards into his 40-yard Dash and limp across the finish line for a time of 5.83, I think we’d all agree including that time would ruin all analysis. But hopefully you can all understand the slippery slope that we’d be going down if we started deciding which players to include/exclude based on injury, assuming we don’t include any eyesores in the 5.40-plus range (we aren’t).
Note: Only 2 players in this analysis have a pro day 40-time more than 0.20 seconds faster than their Combine time: David Paulson (0.31 second difference) and Joey Iosefa (0.22 second difference). All other players were within 0.20 seconds that ran at both events.
The Advanced Analysis
As aforementioned, when looking at the players that ran both, we saw decent discrepancies in the average 40-times for the 2010-2019 draftees: 0.06 for RBs/WRs and 0.08 for TEs.
Now, let’s introduce the t-test, a statistical test that, at its core, lets us know if the averages of two different populations are the same or not.
We’ll examine the t-test on several different slices and dices of the data, then discuss a couple drawbacks to using this as our only measure of whether or not pro day/Combine 40-times are the same or not.
We can look at all 190 players who ran at both the Combine and their pro day, and use the t-test as a measure of whether or not the averages and distribution of these two datasets are likely sampled from the same population. The graph below is an easy way to visualize how many players per draft year are in this 190 player sample.
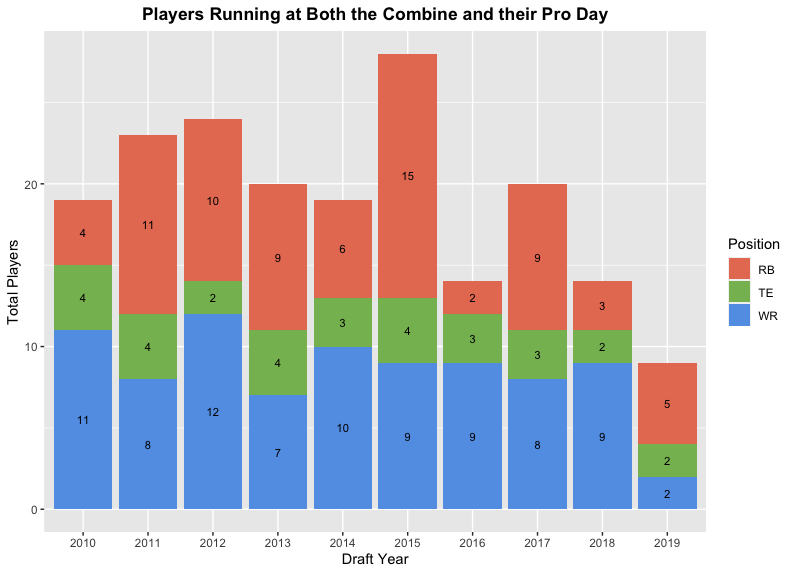
Among guys that ran both, the average Combine 40-time was 4.62, and the average pro day 40-time was 4.56. The results of the t-test on this sample, as expected, lead us to believe these are two very different populations. The Combine 40-time population has a very different average than the pro day 40-time population.
When separating out this group of 190 players (2010-2019) that ran both by position, the t-test results also indicate that:
- -Pro day 40-times for RBs are different than Combine 40-times for RBs
- -Pro day 40-times for WRs are different than Combine 40-times for WRs
- -Pro day 40-times for TEs are different than Combine 40-times for TEs
Complications arise once we get into even smaller sample sizes, and when reviewing the fundamental statistical assumptions of the t-test.
Pressing Against Small Sample Size Limitations
We already know that analyzing 2010-2019 for players that ran at both events leads us to the conclusion we should adjust pro day 40-times, as they are clearly faster than Combine 40-times. If we try to get a more recent population of players, and change our sample group to 2011-2019 (removing 2010), then we still see that the t-test results indicate these are two different populations (pro day 40-times compared to Combine 40-times).
We can try only the 2012-2019 players, 2013-2019 players, 2014-2019 players, even the 2015-2019 players.
With RBs/WRs/TEs that were drafted from 2015-2019 and ran at both the Combine and pro day, on average, they ran 0.05 seconds faster at their pro day; and the t-test also believes these times came from two totally distinct groups. We are already approaching a small sample though; 2015-2019 only gives us 85 players that ran at both – 34 RBs, 37 WRs, and 14 TEs.
Our sample size is reduced once again if we look at 2016-2019, and 2016 also happens to be the year that the Combine changed their technology to the Zybek system.
Across all three positions, the average pro day 40-time is 0.035 seconds faster than the average Combine time (among the 57 players that did both). Notice that we went from 85 players to only 57 players when eliminating 2015 from our analysis. Using a t-test, we now find that the pro day and Combine times do not have statistically different averages; however, we must ask ourselves if 57 prospects (19 RBs, 28 WRs, 10 TEs) is enough to feel confident in the results.
Personally, I am not confident, and that’s before we address the fundamental flaw with using the t-test, and why I believe using more simple averages is the way to proceed. Yes, the t-test is using “statistics” and I am a stats guy. But, a fundamental assumption of the t-test is that the data points are all independent. And for all these examples, we’ve been fundamentally bypassing this assumption.
These are not two independent samples; we are comparing players who ran both, so naturally, every single Combine 40-time will be dependent on a pro day 40-time, and vice versa. The same player represents a data point in the pro day sample, as well as a data point in the Combine sample. And statistically, if we violate this assumption, then we may have an inaccurate p-value (for the non-stats nerds out there, the “p-value” just lets us know if the average 40-time in the pro day sample and Combine sample look the same or not. If we cannot trust the p-value, then our entire t-test is in question).
The crux is two-fold, in that we have such a small sample of data from 2016 onward, as well as knowing that all along, the t-test isn’t the “perfect” test to use, as we aren’t comparing independent samples of data.
Just comparing players that ran both from 2017-2019, we only have 43 total players now, and the pro day times were a little over 0.035 seconds faster than the Combine times.
Comparing the prospects that ran both from 2018-2019 (23 players), we have pro day times being 0.05 seconds faster. And finally, just looking at 2019 (nine players), we have pro day times being 0.045 seconds faster.
What Comes Next?
What should you do with this information? How should we be adjusting these 2021 pro day times?
The prudent approach is to look at the last five years, where we still have 85 players across RB/WR/TE. Yes, we could say that there’s a downward trend, and that pro day/Combine times are closer than they were in 2010, but I do not believe we should stop adjusting pro day 40-times, and you will continue to see the pro day times juxtaposed with our adjustment on PlayerProfiler’s 2021 prospect player pages.
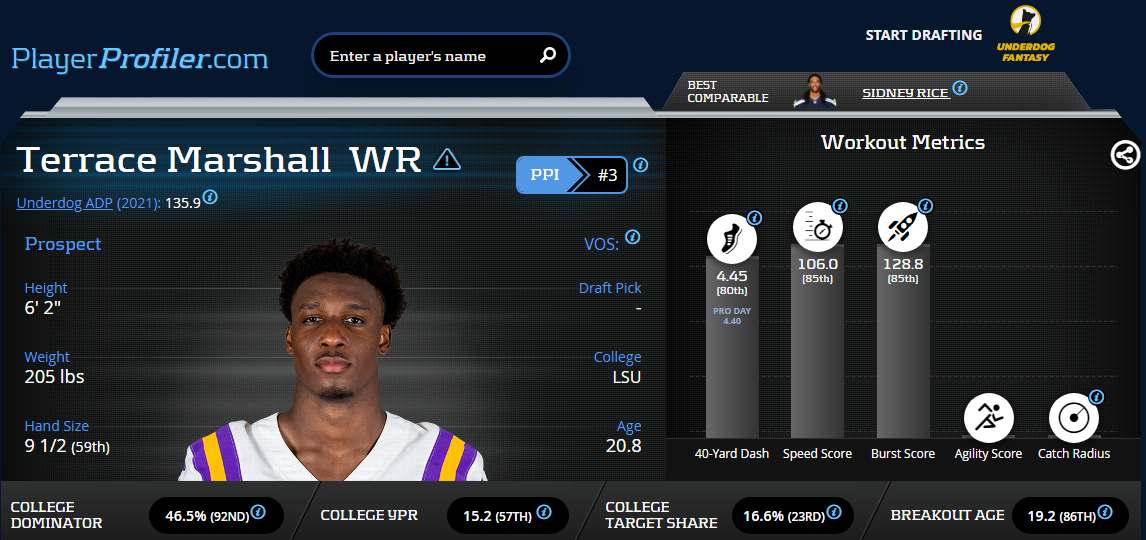
Terrace Marshall Advanced Stats & Metrics Profile
From 2018-2019, the average 40-time difference for the 23 players that ran both was 0.05 (which is our EXACT adjustment currently). Sure, from 2010-2013, the average difference was 0.08 overall (0.07 for RB, 0.08 for WR, and 0.09 for TE), and now that is down to 0.05 the past couple seasons. But, we need to keep a reasonable sample size, AND note that there is still a difference as recently as 2018 and 2019, the last two years with both a Combine and pro days.
I propose that we do NOTHING differently; we’ll continue adjusting by 0.05 for all the 2021 prospects. Next year, depending on what happens with the NFL Combine, we will revisit our process. However, nothing in the data (or video evidence from Ja’Marr Chase’s LSU pro day) leads me to believe that pro days have the same technology the Combine does, and therefore, the 40-times should still be adjusted at pro days.
While there is evidence that technology changed in 2016, the Combine still used video replay to determine forward momentum prior to that year, while pro days did not have that technology. If each individual pro day began using the same technology as the NFL Scouting Combine, then there’s an argument to remove our adjustment; though even then, the pro days aren’t performed on a uniform surface like the Combine, as each college track will have slightly different grass, turf, etc.
Still Humping the T-Test?
You thought the article was over? Not yet.
A little bonus for everyone that made it this far, let’s expose another flaw with using the t-test, and why I don’t recommend it for small samples.
What if we used the t-test on the small sample of 2018-2019 WRs and RBs? There’s eight RBs and nine WRs in this group. Overall, the RBs averaged a 4.59 40-time, while the WRs averaged a 4.53 40-time. Surprise, surprise. The t-test will let you know it’s not convinced that, statistically, these are difference samples. Put another way, these two samples “trick” the t-test, and it cannot say for certain that it’s analyzing two different datasets. The t-test concludes we may be looking at two sets of data from the SAME sample. Remember, we have RBs on one side, and WRs on the other side.
BOOM! We have just foiled the t-test with a small sample size.
Summary
Pro day 40-times will be adjusted by +0.05 seconds on PlayerProfiler.com in 2021, because the past five years of Combine and pro day information gathered for running backs, wide receivers and tight ends who participated in both events and were drafted, ran 0.05 seconds faster at their pro days. Furthermore, breaking it down by position over the past five years, RBs (34 players) have a difference of 0.555 seconds, WRs (37 players) have a difference of 0.045 seconds, and TEs (14 players) have a difference of 0.05 seconds. Across offensive skill positions, the average difference is 0.05 seconds, reinforcing RotoUnderworld’s existing correction value.
However, the trendline (post-Zybek installation in 2016) shows converging results in recent years, most notably, the 0.035 differential from 2017 to 2019. We will continue to watch this trendline closely. If the NFL Scouting Combine returns in 2022, and the trend continues, we may have the requisite sample size, correlation, and cause and effect (Zybek system may be returning slightly faster Combine 40-time results) to modify the adjustment from +.05 to +.04 in 2023, depending on position.
This is not how I envisioned spending my time in April, but I know this has been a hotly debated conversation, and I wanted to run the numbers myself before weighing in, publicly.
And remember, you can recreate this analysis yourself with our Data Analysis Tool, as we’re adding in pro day times for all the players.

