
Numbers are everywhere in the sports world. A small amount is overwhelming, and most meaningless. When you can discover the sweet spot with statistics, as Playerprofiler has, the world is your oyster (CLICHE ALERT). Numbers can help us determine the best NFL win totals to play in 2022.
Over the course of the 2021 season, I built a regression model to help project and find edges in the world of football. The results were exceedingly profitable. With that being said I buckled up, put my model into drive and drove off into the off-season sunset to develop something better to share with the world. Let’s dive in.
Before we are fully immersed in this exercise, let’s take a minute to define terms. Defining these terms will help us uncover the best NFL win totals for 2022.
Terminology
xWins
Short for expected wins. I used offensive as well as defensive passing and rushing statistics to formulate how many wins a team should expect given the statistics noted. This has a r2 of 0.78, meaning that seventy-eight percent of the time the xWin total is given through the inputted statistics (note: anything over 0.5 is very good). Below is a graph. The hard black line is the actual wins of the NFL team where the green dots represent what my model thought the teams’ win total should have been.
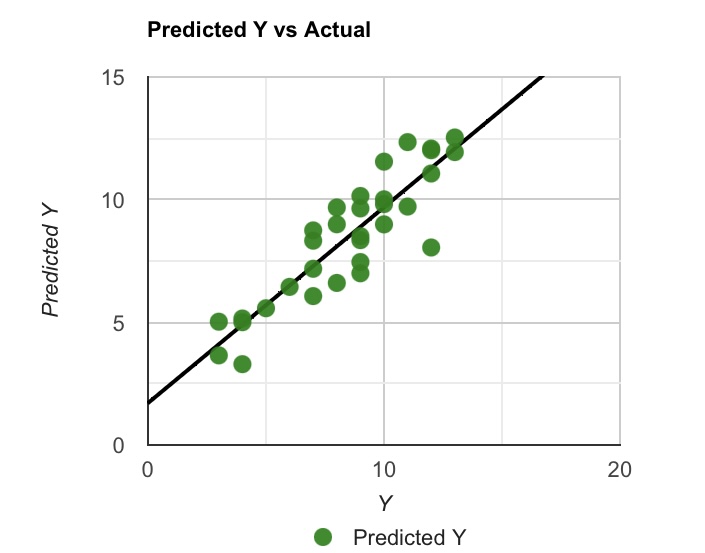
Chart showing the accuracy of xWins
Pythagorean Wins
Pythagorean Winning Percentage is a method that gives an expected winning percentage using the ratio of a team’s wins and losses related to the number of points scored and allowed. A good example would be the Patriots last year. Their point differential had a very high margin. This implies the Patriots won less than they should have according to this formula.
Luck Factor
Using an average of “Wins” and “Pythagorean Wins,” I found the difference between that number (let’s call this number “x”) and my xWins (“y”). I then found the difference between X and Y, divided that number by the highest of the differences to create a scale. This scale has ten being the highest. The team with ten as their luck score had the greatest difference between X and Y. This implies luck or an easier schedule.
Bankroll
When investing in sports, the majority of the public spends money in not the wisest of manners. The most important skill to profit while investing in sports is to manage your bankroll or “the amount of money you have to spend on investing.” The typical suggestion is using three percent as one unit (a unit is how much you’re willing to place, a unit can typically range from ten cents up to one thousand dollars). If you have one thousand dollars to spend on investing, a typical bet will come in at thirty dollars. This way, if and when you end up on a streak of bad luck, you won’t ever run out of money.
Finding Edges
What does “find edges” mean? This means we use the implied probabilities that are built into the lines Vegas places. Next step is to build a model that also gives us this information and find gaps that we can exploit to gain profit. The only catch is crossing your fingers that what you assembled is good.
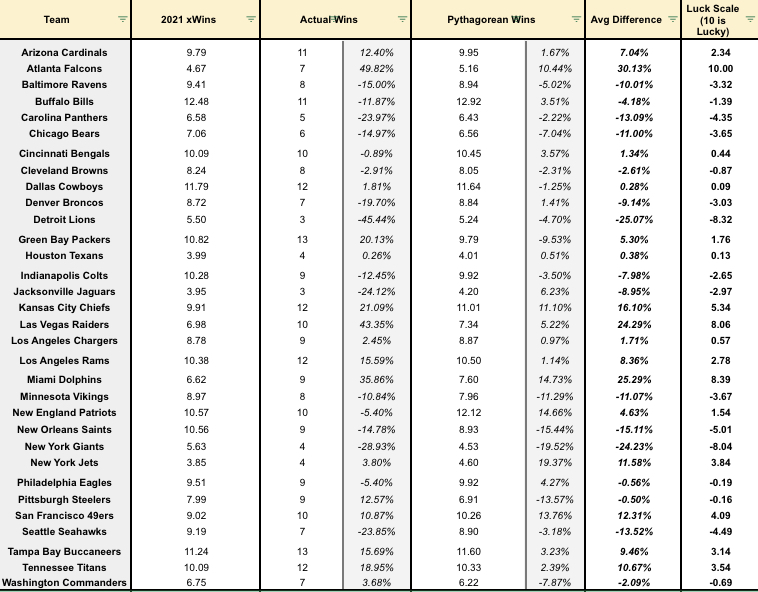
Chart showing how teams performed in 2021
In this chart, what you see are the results of what my regression model expected for wins for each team given certain statistics in the year 2021 (2021 xWins), the teams’ actual wins, and Pythagorean wins. As I stated above, I then used more simple math to find the average difference between my xWins and the latter two to create the “Luck Factor.” You can clearly see the Falcons had either a super easy schedule or had the ball rolling the right way a few more times than it should’ve. Where a team such as the Lions could’ve used the horseshoe on the side of the Colts’ helmet.
You’re probably curious how this helps find edges for the 2022 NFL win totals. I’m delighted you asked. Using xWins from 2021 alongside parity calculations, a hot tub time machine, and a DeLorean, I was able to use the off-season moves each team made to create xWins 2022.
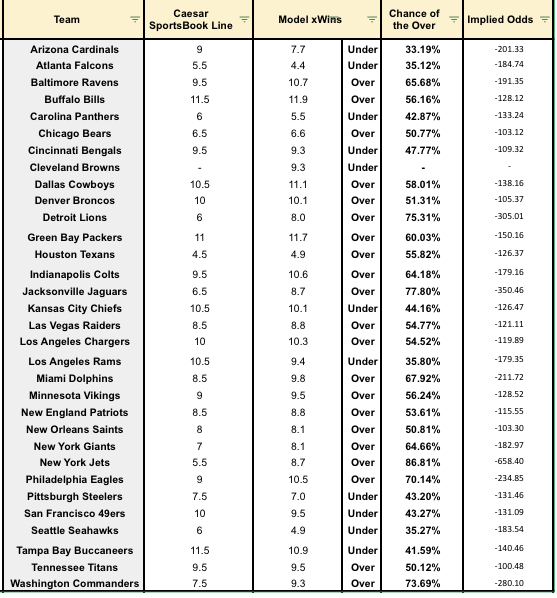
Expected outcomes in 2022
Going Forward in 2022
This chart shows the Caesar’s line for 2022 NFL win totals (code:PODFATHER15), 2022 xWins, and the percentage chance that the over hits, with implied odds at the far right (implied odds, meaning if my model set the lines based on my probabilities what would it be set at). Now that I’ve streamlined important information into your noggins, let’s develop actionable items for you to look at this off-season. What we will be looking for are slight edges. As you see, there are teams that have massive edges to the Vegas line according to my model. In my opinion these lines are an easy win. I’d rather take the time to elaborate on spicier, more bold takes.
One important piece of information to remember as you continue, schedules matter.
https://youtu.be/ZbCrWq8Dt5c
This is not a simple website that might write on easier takes and disperse those to the public eye. This is Playerprofiler, and here, we like spice. Let’s roll.
Tampa Bay Under 11.5 Wins
With a xWin total of 11.24 in 2021, a Caesar’s win total of 11.5, history is already on our side with this. Now the question begs, did they get better or worse over the off-season? Personally, I think slightly worse. With that being said, Tom Brady and the team have to run the gauntlet of having the fourth hardest strength of schedule based on last year’s winning percentage. They are a team that should end up with 10 or 11 wins which hits the under we’re looking for. Chris Godwin will probably miss a good chunk of the season and with Rob Gronkowski being questionable to return, this passing attack should see regression. (On your bankroll for futures, at -120, I’d bet 2.5 percent.)
Los Angeles Rams Under 10.5 Wins
Coming off a fantastic win in the Super Bowl, this one is a risky take for sure. The Rams had a xWin total of 10.38 last year. Their Caesar’s win total for 2022 is 10.5. This, combined with the hardest strength of schedule this year relative to last year’s winning percentage, and the Rams should be in for a tough season. The passing attack will thrive, and you, as a fantasy player, want every player on the Rams to some degree on your fantasy team (my current week 1 projection for Matt Stafford is 21.95 FPts). I still don’t trust this schedule and neither does my model. Expect a ten-win season from the Rams, but I’d be hard done by penciling them in for eleven. (On your bankroll for futures, at+100, I’d bet 7.7 percent.)
Baltimore Ravens Over 9.5 Wins
The ideally non injured Ravens come into the season with recency bias on our side. The team couldn’t have had any worse luck. Their secondary couldn’t catch a cold. Their xWin total came in at an excellent 1.41 wins above their measly 8 win season. The Ravens added assets that will help them get to a much better spot. With uncertain Pittsburgh, and likely the “Watson-less” Browns, combined with a six percent easier schedule than average, the Ravens will probably fly their way to the top of the division. (On your bankroll for futures, at -130, I’d bet 5.4 percent.)
Arizona Under 9 Wins
With Kyler’s future in Arizona, still somewhat of a hot topic in today’s crazy NFL world. Where is this team headed? Arizona came in at a xWin total last year of 9.79, a a full 1.21 wins below their 2022 NFL win total, telling us there was a combination of luck and easier matchups. Kyler Murray is currently in contract disputes. Combine that with DeAndre Hopkins going the Will Fuller route, there’s uncertainty galore with this once thought of great team. Vegas currently has their over under at only (-0.79) wins below last year’s xWin total, combined with the second hardest strength of schedule gives an easy under in my eyes.. (On your bankroll for futures, at -130, I’d bet 5.6 percent.)

