
The goal of this article is to determine if it’s worth spending a significant portion of your total auction budget on a RB with a first round ADP.
The baseline for league format is:
ESPN PPR default auction league settings
12 Teams – $200 auction budget per team – 1 QB – 2 RB – 2 WR – 1 W/R/T – K – D/ST – 7 BN
I compiled ADP data for the past five years from Fantasy Football Calculator to figure out how many RBs have had first round ADPs. Additionally, I gathered seasonal finishes (total fantasy points) from this group through Fantasy Data.com.
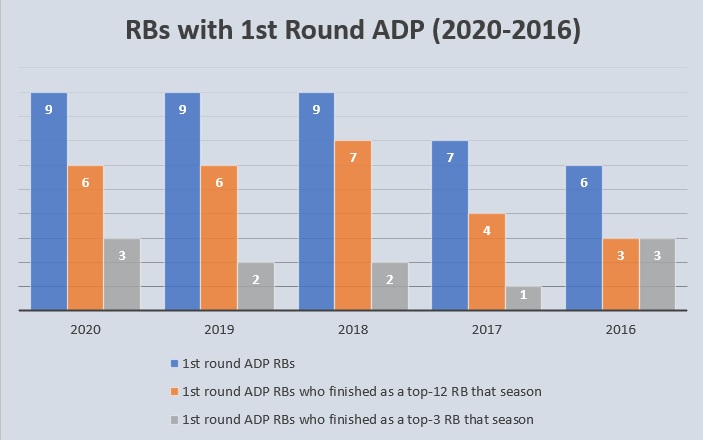
The data shows that the hit rate for RBs with first round ADPs is strong. Since 2016, 64-percent of RBs with first round ADPs finished as top-12 fantasy backs, and 25-percent finished in the top-3. Every top-3 RB since 2016 scored over 300 fantasy points for their respective season. The juice is worth the squeeze, especially in a shallow format such as the ESPN PPR default leagues.
Go For Broke?
Historically, average auction values for the top RBs range from 30-35-percent of total auction budget, and gradually taper down to 25-20-percent for RBs by the end of the first round.
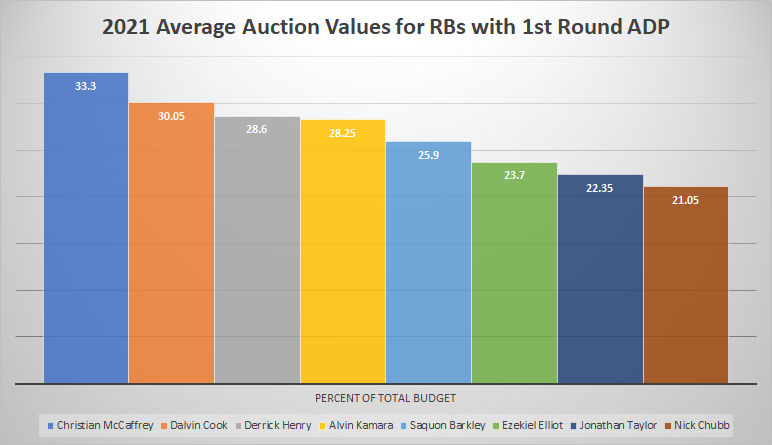
ESPN PPR, Average Auction Values, RBs with 1st Round ADP
It is clear that Christian McCaffrey costs more than Nick Chubb, but how can we quickly identify variance in player costs? Fortunately, Josh Larky enlightened fantasy gamers on why standard deviation is an effective metric for fantasy analysis. Also, Neel Gupta wrote an excellent article covering player variance using this formula.
The standard deviation of the cost for RBs within the group is 3.89-percent. Furthermore, the deviation is lower when the group is split into two halves: top-4 RBs and bottom-4 RBs. The top-4 RB group has a low deviation of 2.03-percent and the bottom-4 RB group is even closer at 1.79-percent.
We know that the hit rate for first round RBs is better than any other round, but we don’t know if the top-4 RBs have a better hit rate than the next four RBs.
While this isn’t useful knowledge for snake draft, it is helpful when it comes to auction, where prices are dictated by ADP.
There have been nine RBs with first round ADPs from 2018-2020. The 2017 season had seven RBs with first round ADPs, and 2016 had six RBs. I compiled the seasonal finishes for these RBs and split them up into the two groups: RB1-4 (2020-2018) or RB1-3 (2017-2016) for RBs drafted in the top half of the first round, and RB5-9 (2020-2018), RB4-7 (2017) and RB4-6 (2016) for RBs drafted in the bottom half of the first round.
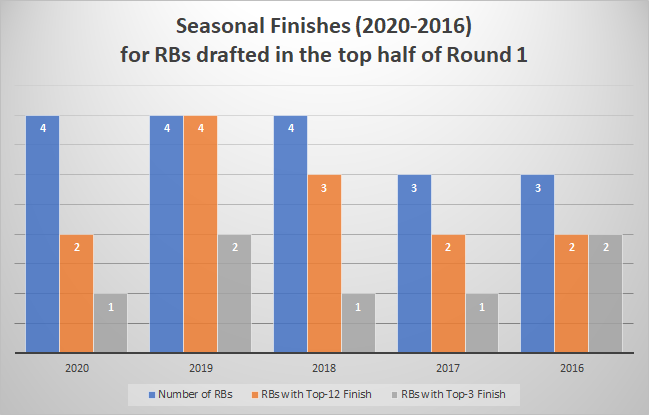
2019 and 2016 were excellent years to draft an RB in the top half of the first round. 50-percent of the RBs from the 2019 group finished as a top-3 RB, and 2016 had 66.66-percent of the group finish in the top three. Overall, it looks like it’s safe to spend up for these guys; 71.66-percent of RBs drafted in the top half of drafts finished as top-12 backs, and 40-percent finished as a top-3 backs.
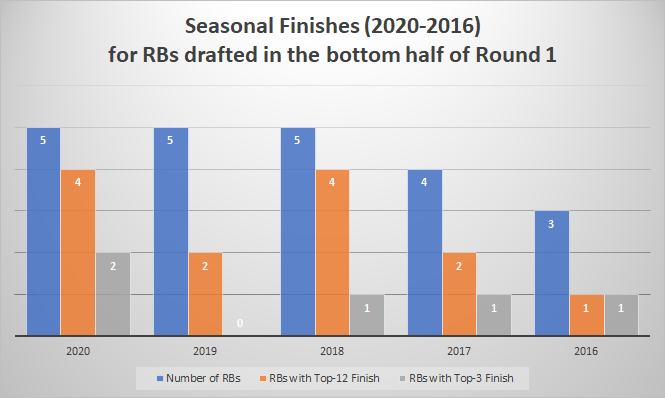
The bottom half of first round RBs fared well, with 56.66-percent finishing as top-12 RBs and 23.66-percent finishing as top-3 backs.
Drafting a RB in the top half of the first round instead of one in the bottom half increases the chance of getting a top-12 RB by 15-percent, and a top-3 back by 16.34-percent.
Takeaways
Hero RB strategy lends well to drafting a top RB because it gives gamers the best chance to get a stable RB1 or a game changing top-3 RB.
Drafting two RBs with first round ADPs is viable in shallow formats like ESPN PPR default. It’s possible to spend 50-percent of your total budget on two RBs with first round ADPs and still construct a winning roster. Hitting on both of RBs puts you on cruise control to the playoffs.
There is no reason not to draft a RB with a first round ADP in auction format. In fact, it can be advantageous to draft multiple RBs with first round ADPs.

