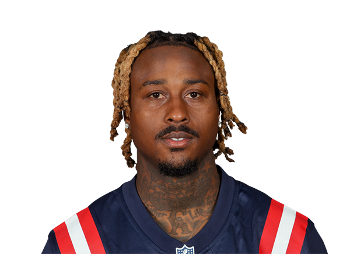
Terrance Mitchell
CB
- Height
- 5' 11"
- Weight
- 192 lbs
- Arm Length
- 30 1/8" (13th)

- Draft Pick
- 7.39 2014
- College
- Oregon
- Age
- 30.0
Workout Metrics
4.63
11th
83.6
14th
116.8
18th
10.57
98th
10.02
54th
40-Yard Dash
Speed Score
Burst Score
Agility Score
Catch Radius
Terrance Mitchell Advanced Stats & Metrics
Opportunity
Snap Share Snap Share | Man Coverage Rate | Shadow Rate | Targets Allowed | Target Rate | Routes Defended | Average Target Distance Target Depth (ADOT) |
---|---|---|---|---|---|---|
76.1% | - | - | 65 (4.6 p/g) | 18.0% | 362 (25.9 p/g) | 11.8 |
#48 | - | - | #50 | #73 | #60 | #64 |
Productivity
Target Separation Target Separation | Receptions Allowed Rec Allow | Yards Allowed Yards Allow | Yards Per Reception Allowed YPR Allow | Yards Per Target Allowed YPT Allow | Pass Break-ups Break-ups | TDs Allowed TDs Allow |
---|---|---|---|---|---|---|
1.9 | 41 (2.9 p/g) | 610 (43.6 p/g) | 14.9 | 9.4 | 8 | 6 (1 int) |
#66 | #57 | #72 | #79 | #82 | #38 | #86 |
Efficiency
Coverage Rating Coverage Rating | Man Coverage Success Rate Man Success Rate | Catch Rate Allowed | Passer Rating Allowed | Fantasy Pts Allowed Per Cover Snap Fantasy Pts/Cover Snap | Fantasy Points Allowed Per Target Fantasy Pts/Tgt | Fantasy Points Allowed Per Game Fantasy Pts/G |
---|---|---|---|---|---|---|
+2.6 | - | 63.1% | 124.3 | 0.38 | 2.12 | 9.9 |
#58 | - | #61 | #86 | #89 | #86 | #85 |
Opportunity
Snap Share Snap Share | Man Coverage Rate | Shadow Rate | Targets Allowed | Target Rate | Routes Defended | Average Target Distance Target Depth (ADOT) |
---|---|---|---|---|---|---|
85.9% | - | - | 107 (6.7 p/g) | 17.1% | 627 (39.2 p/g) | 10.6 |
#12 | - | - | #10 | #10 | #1 | #11 |
Productivity
Target Separation Target Separation | Receptions Allowed Rec Allow | Yards Allowed Yards Allow | Yards Per Reception Allowed YPR Allow | Yards Per Target Allowed YPT Allow | Pass Break-ups Break-ups | TDs Allowed TDs Allow |
---|---|---|---|---|---|---|
1.1 | 65 (4.1 p/g) | 962 (60.1 p/g) | 14.8 | 9.0 | 11 | 6 (1 int) |
#34 | #13 | #4 | #65 | #65 | #15 | #7 |
Efficiency
Coverage Rating Coverage Rating | Man Coverage Success Rate Man Success Rate | Catch Rate Allowed | Passer Rating Allowed | Fantasy Pts Allowed Per Cover Snap Fantasy Pts/Cover Snap | Fantasy Points Allowed Per Target Fantasy Pts/Tgt | Fantasy Points Allowed Per Game Fantasy Pts/G |
---|---|---|---|---|---|---|
+16.2 | - | 60.7% | 105.0 | 0.31 | 1.84 | 12.3 |
#33 | - | #32 | #55 | #30 | #55 | #59 |
Opportunity
Snap Share Snap Share | Man Coverage Rate | Shadow Rate | Targets Allowed | Target Rate | Routes Defended | Average Target Distance Target Depth (ADOT) |
---|---|---|---|---|---|---|
38.1% | - | - | 31 (2.4 p/g) | 20.9% | 148 (11.4 p/g) | 8.5 |
- | - | - | - | - | - | - |
Productivity
Target Separation Target Separation | Receptions Allowed Rec Allow | Yards Allowed Yards Allow | Yards Per Reception Allowed YPR Allow | Yards Per Target Allowed YPT Allow | Pass Break-ups Break-ups | TDs Allowed TDs Allow |
---|---|---|---|---|---|---|
2.5 | 18 (1.4 p/g) | 246 (18.9 p/g) | 13.7 | 7.9 | 1 | 0 (1 int) |
- | - | - | - | - | - | - |
Efficiency
Coverage Rating Coverage Rating | Man Coverage Success Rate Man Success Rate | Catch Rate Allowed | Passer Rating Allowed | Fantasy Pts Allowed Per Cover Snap Fantasy Pts/Cover Snap | Fantasy Points Allowed Per Target Fantasy Pts/Tgt | Fantasy Points Allowed Per Game Fantasy Pts/G |
---|---|---|---|---|---|---|
+16.7 | - | 58.1% | 82.6 | 0.29 | 1.37 | 3.3 |
- | - | - | - | - | - | - |
Opportunity
Snap Share Snap Share | Man Coverage Rate | Shadow Rate | Targets Allowed | Target Rate | Routes Defended | Average Target Distance Target Depth (ADOT) |
---|---|---|---|---|---|---|
74.3% | - | - | 56 (7.0 p/g) | 25.1% | 223 (27.9 p/g) | - |
#60 | - | - | #11 | #70 | #78 | - |
Productivity
Target Separation Target Separation | Receptions Allowed Rec Allow | Yards Allowed Yards Allow | Yards Per Reception Allowed YPR Allow | Yards Per Target Allowed YPT Allow | Pass Break-ups Break-ups | TDs Allowed TDs Allow |
---|---|---|---|---|---|---|
2.0 | 30 (3.8 p/g) | 355 (44.4 p/g) | 11.8 | 6.3 | 6 | 2 (1 int) |
#85 | #7 | #9 | #31 | #15 | #44 | #13 |
Efficiency
Coverage Rating Coverage Rating | Man Coverage Success Rate Man Success Rate | Catch Rate Allowed | Passer Rating Allowed | Fantasy Pts Allowed Per Cover Snap Fantasy Pts/Cover Snap | Fantasy Points Allowed Per Target Fantasy Pts/Tgt | Fantasy Points Allowed Per Game Fantasy Pts/G |
---|---|---|---|---|---|---|
+36.7 | - | 53.6% | 77.6 | 0.35 | 1.40 | 9.7 |
#7 | - | #7 | #11 | #34 | #10 | #40 |
Opportunity
Snap Share Snap Share | Man Coverage Rate | Shadow Rate | Targets Allowed | Target Rate | Routes Defended | Average Target Distance Target Depth (ADOT) |
---|---|---|---|---|---|---|
62.2% | - | - | 98 (6.5 p/g) | 25.7% | 381 (25.4 p/g) | - |
#62 | - | - | #48 | #66 | #55 | - |
Productivity
Target Separation Target Separation | Receptions Allowed Rec Allow | Yards Allowed Yards Allow | Yards Per Reception Allowed YPR Allow | Yards Per Target Allowed YPT Allow | Pass Break-ups Break-ups | TDs Allowed TDs Allow |
---|---|---|---|---|---|---|
1.1 | 51 (3.4 p/g) | 793 (52.9 p/g) | 15.5 | 8.1 | 16 | 6 (5 int) |
#21 | #40 | #56 | #63 | #53 | #8 | #59 |
Efficiency
Coverage Rating Coverage Rating | Man Coverage Success Rate Man Success Rate | Catch Rate Allowed | Passer Rating Allowed | Fantasy Pts Allowed Per Cover Snap Fantasy Pts/Cover Snap | Fantasy Points Allowed Per Target Fantasy Pts/Tgt | Fantasy Points Allowed Per Game Fantasy Pts/G |
---|---|---|---|---|---|---|
+29.1 | - | 52.0% | 78.3 | 0.44 | 1.70 | 11.1 |
#16 | - | #17 | #26 | #66 | #50 | #59 |
Week Wk | Opponent Opp | Primary Coverage Coverage | Snap Share Snap Share | Slot Rate Slot Rate | Receptions Allowed Receptions Allowed | Yards Allowed Yards Allowed | Pass Break-ups Pass Break-ups |
---|---|---|---|---|---|---|---|
1 | JAX | Marvin Jones | 88.2% | 3.3% | 5 (11 tgt) | 121 | 1 |
2 | CLE | Rashard Higgins | 77.2% | 2.3% | 1 (1 tgt) | 21 | 0 |
4 | BUF | Emmanuel Sanders | 73.2% | 0.0% | 3 (6 tgt) | 22 | 1 |
5 | NE | Nelson Agholor | 88.5% | 1.9% | 2 (4 tgt) | 23 | 1 |
6 | IND | Michael Pittman | 85.4% | 0.0% | 2 (3 tgt) | 24 | 0 |
7 | ARI | A.J. Green | 81.2% | 41.1% | 2 (2 tgt) | 53 | 0 |
8 | LAR | Robert Woods | 87.9% | 5.2% | 3 (7 tgt) | 22 | 1 |
9 | MIA | Jaylen Waddle | 94.4% | 4.4% | 4 (5 tgt) | 32 | 1 |
11 | TEN | Nick Westbrook-Ikhine | 96.2% | 0.0% | 8 (11 tgt) | 95 | 1 |
12 | NYJ | Elijah Moore | 68.3% | 4.7% | 1 (3 tgt) | 10 | 1 |
13 | IND | Michael Pittman | 78.9% | 1.8% | 2 (2 tgt) | 31 | 0 |
14 | SEA | Tyler Lockett | 32.8% | 0.0% | 3 (3 tgt) | 89 | 0 |
17 | SF | Deebo Samuel | 83.6% | 5.9% | 6 (8 tgt) | 88 | 1 |
18 | TEN | Nick Westbrook-Ikhine | 29.2% | 5.3% | 0 (0 tgt) | 0 | 0 |
Week Wk | Opponent Opp | Primary Coverage Coverage | Snap Share Snap Share | Slot Rate Slot Rate | Receptions Allowed Receptions Allowed | Yards Allowed Yards Allowed | Pass Break-ups Pass Break-ups |
---|---|---|---|---|---|---|---|
1 | BAL | Miles Boykin | 86.4% | - | 5 (7 tgt) | 69 | 0 |
2 | CIN | A.J. Green | 90.9% | - | 3 (10 tgt) | 36 | 2 |
3 | WAS | Terry McLaurin | 88.7% | - | 4 (7 tgt) | 73 | 0 |
4 | DAL | Amari Cooper | 74.4% | - | 13 (15 tgt) | 159 | 1 |
5 | IND | T.Y. Hilton | 90.4% | - | 2 (4 tgt) | 24 | 1 |
6 | PIT | James Washington | 32.3% | - | 5 (8 tgt) | 120 | 2 |
7 | CIN | A.J. Green | 68.1% | - | 4 (5 tgt) | 49 | 2 |
8 | LV | Nelson Agholor | 87.3% | - | 4 (5 tgt) | 27 | 0 |
10 | HOU | Will Fuller | 98.1% | - | 5 (6 tgt) | 34 | 0 |
11 | PHI | Travis Fulgham | 92.4% | - | 4 (6 tgt) | 52 | 0 |
12 | JAX | Keelan Cole | 88.7% | - | 3 (7 tgt) | 64 | 0 |
13 | TEN | A.J. Brown | 92.6% | - | 5 (8 tgt) | 99 | 0 |
14 | BAL | Marquise Brown | 93.1% | - | 3 (5 tgt) | 63 | 0 |
15 | NYG | Sterling Shepard | 103.7% | - | 1 (3 tgt) | 10 | 1 |
16 | NYJ | Breshad Perriman | 95.7% | - | 2 (5 tgt) | 14 | 1 |
17 | PIT | Diontae Johnson | 98.5% | - | 2 (6 tgt) | 69 | 1 |
Week Wk | Opponent Opp | Primary Coverage Coverage | Snap Share Snap Share | Slot Rate Slot Rate | Receptions Allowed Receptions Allowed | Yards Allowed Yards Allowed | Pass Break-ups Pass Break-ups |
---|---|---|---|---|---|---|---|
1 | TEN | Tajae Sharpe | 29.5% | - | 2 (4 tgt) | 58 | - |
3 | LA | Robert Woods | 98.4% | - | 6 (9 tgt) | 79 | - |
4 | BAL | Marquise Brown | 98.5% | - | 2 (4 tgt) | 15 | - |
5 | SF | Marquise Goodwin | 97.2% | - | 1 (4 tgt) | 8 | - |
6 | SEA | Jaron Brown | 98.7% | - | 4 (6 tgt) | 47 | - |
9 | DEN | - | 0.0% | - | 0 (0 tgt) | 0 | - |
10 | BUF | - | 0.0% | - | 0 (0 tgt) | 0 | - |
11 | PIT | JuJu Smith-Schuster | 1.7% | - | 1 (1 tgt) | 16 | - |
12 | MIA | DeVante Parker | 11.9% | - | 2 (2 tgt) | 23 | - |
13 | PIT | Diontae Johnson | 13.2% | - | 0 (1 tgt) | 0 | - |
14 | CIN | - | 0.0% | - | 0 (0 tgt) | 0 | - |
15 | ARI | Christian Kirk | 10.0% | - | 0 (0 tgt) | 0 | - |
16 | BAL | - | 0.0% | - | 0 (0 tgt) | 0 | - |
17 | CIN | - | 0.0% | - | 0 (0 tgt) | 0 | - |
Week Wk | Opponent Opp | Primary Coverage Coverage | Snap Share Snap Share | Slot Rate Slot Rate | Receptions Allowed Receptions Allowed | Yards Allowed Yards Allowed | Pass Break-ups Pass Break-ups |
---|---|---|---|---|---|---|---|
1 | PIT | Antonio Brown | 76.3% | - | 4 (9 tgt) | 46 | - |
2 | NO | Michael Thomas | 81.4% | - | 8 (9 tgt) | 111 | - |
3 | NYJ | Terrelle Pryor | 86.9% | - | 2 (6 tgt) | 21 | - |
4 | OAK | Amari Cooper | 14.8% | - | 3 (5 tgt) | 38 | - |
14 | CAR | D.J. Moore | 96.9% | - | 2 (6 tgt) | 47 | - |
15 | DEN | Tim Patrick | 87.1% | - | 7 (12 tgt) | 62 | - |
16 | CIN | John Ross | 84.8% | - | 1 (2 tgt) | 3 | - |
17 | BAL | Chris Moore | 89.0% | - | 3 (7 tgt) | 27 | - |
Week Wk | Opponent Opp | Primary Coverage Coverage | Snap Share Snap Share | Slot Rate Slot Rate | Receptions Allowed Receptions Allowed | Yards Allowed Yards Allowed | Pass Break-ups Pass Break-ups |
---|---|---|---|---|---|---|---|
1 | NE | - | 86.5% | - | 4 (11 tgt) | 96 | - |
2 | PHI | - | 82.6% | - | 4 (7 tgt) | 57 | - |
3 | LAC | - | 91.2% | - | 8 (15 tgt) | 112 | - |
4 | WAS | - | 74.0% | - | 2 (5 tgt) | 17 | - |
5 | HOU | - | 89.3% | - | 4 (9 tgt) | 94 | - |
6 | PIT | - | 81.0% | - | 6 (7 tgt) | 110 | - |
7 | OAK | - | 98.6% | - | 6 (15 tgt) | 105 | - |
8 | DEN | - | 0.0% | - | 0 (0 tgt) | 0 | - |
9 | DAL | - | 6.2% | - | 1 (1 tgt) | 21 | - |
12 | BUF | - | 66.2% | - | 0 (4 tgt) | 0 | - |
13 | NYJ | - | 38.8% | - | 3 (4 tgt) | 54 | - |
14 | OAK | - | 98.2% | - | 7 (11 tgt) | 57 | - |
15 | LAC | - | 30.0% | - | 1 (1 tgt) | 9 | - |
16 | MIA | - | 1.9% | - | 1 (1 tgt) | 6 | - |
17 | DEN | - | 90.8% | - | 4 (7 tgt) | 55 | - |

Terrance Mitchell Injury History
Severity:
Low
Medium
High
Games Missed
Injury Reports
Concussion
Week 2 (2021)
1
2
Forearm fracture
Week 5 (2018)
11
11