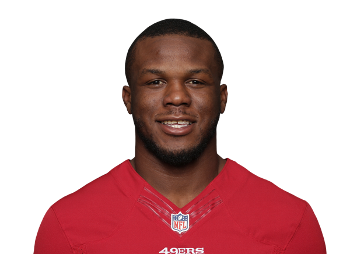
Jeff Wilson
- Height
- 6' 0"
- Weight
- 210 lbs
- BMI
- 28.5 (19th)

- Draft Pick
- Undrafted 2018
- College
- North Texas
- Age
- 27.2
Workout Metrics
Jeff Wilson Bio & Season Stats
Year Year | Games Played Games | Rush Attempts Atts | Rush Yards Rush Yds | Yards Per Carry YPC | Receptions Rec | Receiving Yards Rec Yds | Total Touchdowns TD | Fantasy Points Per Game Fantasy Pts/Game |
---|---|---|---|---|---|---|---|---|
2022 | 16 | 176 | 860 | 4.9 | 22 | 185 | 6 | 9.9 (#32) |
2021 | 9 | 79 | 294 | 3.7 | 7 | 31 | 2 | 5.7 |
2020 | 11 | 126 | 600 | 4.8 | 13 | 133 | 10 | 12.9 (#23) |
2019 | 8 | 27 | 105 | 3.9 | 3 | 34 | 5 | 5.9 (#59) |
2018 | 6 | 66 | 266 | 4.0 | 12 | 98 | 0 | 7.4 |
-
College Dominator34.6% (81st)
-
College YPC6.0 (73rd)
-
College Target Share7.1% (54th)
-
SPARQ-x102.4 (25th)
Jeff Wilson Advanced Stats & Metrics
Snap Share | Opportunity Share | Weighted Opportunities | Team Run Plays Per Game Team Run Plays/Gm | Carries | Targets | Red Zone Touches |
---|---|---|---|---|---|---|
52.7% | 55.2% | 163.7 (10.2 p/g) | 22.6 (2.04 pace) | 176 (11.0 p/g) | 37 (2.3 p/g) | 32 (7 gl) |
#26 | #27 | #30 | #31 | #31 | #31 | #25 |
Rushing Yards | Receiving Yards | Receptions | Total TDs | Fantasy Points Per Opportunity Fantasy Pts/Opportunity | Fantasy Points Per Game | Expected Fantasy Points Per Game Expected Fantasy Pts/Gm |
---|---|---|---|---|---|---|
860 (53.8 p/g) | 185 (11.6 p/g) | 22 (1.4 p/g) | 6 (3.0% rate) | 0.74 | 9.9 | 10.0 (-0.09 diff) |
#23 | #36 | #41 | #22 | #49 | #32 | #37 |
Target Share | Routes Run | Route Participation Route % | Yards Per Reception | Yards Per Route Run | Catch Rate Catch Rate | Drops |
---|---|---|---|---|---|---|
7.9% | 204 (12.8 p/g) | 39.8% | 8.4 (5.0 ypt) | 0.91 | 59.5% | 3 (8.1% rate) |
#30 | #27 | #31 | #9 | #29 | #33 | #19 |
True Yards Per Carry | Yards Per Touch | Juke Rate | Evaded Tackles | Breakaway Run Rate | Breakaway Runs | Best Ball Points Added |
---|---|---|---|---|---|---|
4.6 (4.9 ypc) | 5.3 | 18.2% | 36 (2.3 p/g) | 7.4% | 13 (0.8 p/g) | 62.7 (3.92 p/g) |
#22 | #14 | #43 | #40 | #9 | #12 | #31 |
Yards Created | Yards Created Per Touch Yards Created/Touch | Production Premium | Expected Points Added (EPA) Expected Pts Added | Dominator Rating | Game Script | Run Blocking Rating |
---|---|---|---|---|---|---|
372 (23.3 p/g) | 1.88 | -8.2 | -9.9 | 17.5% | -0.59 | 89.1 |
#42 | #49 | #52 | #115 | #31 | #15 | #3 |
Average Defenders In The Box Defenders In The Box | Stacked Front Carry Rate Stacked Front Carry % | Base Front Carry Rate Base Front Carry % | Light Front Carry Rate Light Front Carry % | Shotgun Carry Rate Shotgun Carry % | Under Center Carry Rate Under Center Carry % | Stuffed Runs |
---|---|---|---|---|---|---|
6.6 | 14.2% (3.0 ypc) | 45.5% (5.6 ypc) | 38.6% (4.9 ypc) | 31.8% (1.0 ypc) | 67.6% (1.0 ypc) | 27 (15.3% rate) |
#23 | #23 | #8 | #43 | #45 | #16 | #29 |
Snap Share | Opportunity Share | Weighted Opportunities | Team Run Plays Per Game Team Run Plays/Gm | Carries | Targets | Red Zone Touches |
---|---|---|---|---|---|---|
38.6% | 36.1% | 60.0 (6.7 p/g) | 27.4 (1.92 pace) | 79 (8.8 p/g) | 8 (0.9 p/g) | 12 (3 gl) |
#50 | #52 | #71 | #9 | #57 | #88 | #64 |
Rushing Yards | Receiving Yards | Receptions | Total TDs | Fantasy Points Per Opportunity Fantasy Pts/Opportunity | Fantasy Points Per Game | Expected Fantasy Points Per Game Expected Fantasy Pts/Gm |
---|---|---|---|---|---|---|
294 (32.7 p/g) | 31 (3.4 p/g) | 7 (0.8 p/g) | 2 (2.3% rate) | 0.59 | 5.7 | 6.7 (-0.98 diff) |
#60 | #95 | #86 | #61 | #69 | - | #59 |
Target Share | Routes Run | Route Participation Route % | Yards Per Reception | Yards Per Route Run | Catch Rate Catch Rate | Drops |
---|---|---|---|---|---|---|
3.5% | 63 (7.0 p/g) | 24.9% | 4.4 (3.9 ypt) | 0.49 | 87.5% | 0 (0.0% rate) |
- | #78 | - | - | - | - | - |
True Yards Per Carry | Yards Per Touch | Juke Rate | Evaded Tackles | Breakaway Run Rate | Breakaway Runs | Best Ball Points Added |
---|---|---|---|---|---|---|
3.7 (3.7 ypc) | 3.8 | 20.9% | 18 (2.0 p/g) | 2.5% | 2 (0.2 p/g) | 18.5 (2.06 p/g) |
#60 | - | - | #59 | - | #66 | #65 |
Yards Created | Yards Created Per Touch Yards Created/Touch | Production Premium | Expected Points Added (EPA) Expected Pts Added | Dominator Rating | Game Script | Run Blocking Rating |
---|---|---|---|---|---|---|
202 (22.4 p/g) | 2.35 | -20.5 | -4.9 | 8.6% | +1.23 | 37.0 |
#66 | - | - | #97 | - | #10 | #60 |
Average Defenders In The Box Defenders In The Box | Stacked Front Carry Rate Stacked Front Carry % | Base Front Carry Rate Base Front Carry % | Light Front Carry Rate Light Front Carry % | Shotgun Carry Rate Shotgun Carry % | Under Center Carry Rate Under Center Carry % | Stuffed Runs |
---|---|---|---|---|---|---|
6.7 | 21.5% (3.4 ypc) | 39.2% (4.9 ypc) | 38.0% (2.7 ypc) | 20.3% (1.0 ypc) | 79.7% (1.0 ypc) | 11 (13.9% rate) |
#16 | - | - | - | - | #11 | #62 |
Snap Share | Opportunity Share | Weighted Opportunities | Team Run Plays Per Game Team Run Plays/Gm | Carries | Targets | Red Zone Touches |
---|---|---|---|---|---|---|
39.5% | 45.2% | 119.6 (10.9 p/g) | 27.3 (2.02 pace) | 126 (11.5 p/g) | 28 (2.5 p/g) | 28 (8 gl) |
#47 | #35 | #40 | #62 | #34 | #42 | #27 |
Rushing Yards | Receiving Yards | Receptions | Total TDs | Fantasy Points Per Opportunity Fantasy Pts/Opportunity | Fantasy Points Per Game | Expected Fantasy Points Per Game Expected Fantasy Pts/Gm |
---|---|---|---|---|---|---|
600 (54.5 p/g) | 133 (12.1 p/g) | 13 (1.2 p/g) | 10 (7.2% rate) | 0.92 | 12.9 | 11.3 (+2.02 diff) |
#33 | #52 | #65 | #10 | #19 | #23 | #25 |
Target Share | Routes Run | Route Participation Route % | Yards Per Reception | Yards Per Route Run | Catch Rate Catch Rate | Drops |
---|---|---|---|---|---|---|
7.9% | 120 (10.9 p/g) | 30.8% | 10.2 (4.8 ypt) | 1.11 | 46.4% | 4 (14.3% rate) |
- | #52 | - | - | - | - | #9 |
True Yards Per Carry | Yards Per Touch | Juke Rate | Evaded Tackles | Breakaway Run Rate | Breakaway Runs | Best Ball Points Added |
---|---|---|---|---|---|---|
4.6 (4.8 ypc) | 5.3 | 14.4% | 20 (1.8 p/g) | 5.6% | 7 (0.6 p/g) | 80.5 (7.32 p/g) |
#14 | #22 | #56 | #52 | - | #18 | #25 |
Yards Created | Yards Created Per Touch Yards Created/Touch | Production Premium | Expected Points Added (EPA) Expected Pts Added | Dominator Rating | Game Script | Run Blocking Rating |
---|---|---|---|---|---|---|
245 (22.3 p/g) | 1.76 | -0.4 | -10.2 | 27.9% | -0.09 | 70.2 |
#58 | #58 | #70 | #119 | #8 | #70 | #5 |
Average Defenders In The Box Defenders In The Box | Stacked Front Carry Rate Stacked Front Carry % | Base Front Carry Rate Base Front Carry % | Light Front Carry Rate Light Front Carry % | Shotgun Carry Rate Shotgun Carry % | Under Center Carry Rate Under Center Carry % | Stuffed Runs |
---|---|---|---|---|---|---|
7.2 | 28.6% (3.2 ypc) | 54.0% (5.5 ypc) | 17.5% (5.2 ypc) | 31.0% (4.5 ypc) | 69.0% (4.9 ypc) | 24 (19.0% rate) |
#9 | #17 | #3 | #59 | #44 | #24 | #28 |
Snap Share | Opportunity Share | Weighted Opportunities | Team Run Plays Per Game Team Run Plays/Gm | Carries | Targets | Red Zone Touches |
---|---|---|---|---|---|---|
10.7% | 11.4% | 24.1 (3.0 p/g) | 31.1 (2.10 pace) | 27 (3.4 p/g) | 5 (0.6 p/g) | 16 (3 gl) |
#127 | - | - | #2 | #84 | #106 | #48 |
Rushing Yards | Receiving Yards | Receptions | Total TDs | Fantasy Points Per Opportunity Fantasy Pts/Opportunity | Fantasy Points Per Game | Expected Fantasy Points Per Game Expected Fantasy Pts/Gm |
---|---|---|---|---|---|---|
105 (13.1 p/g) | 34 (4.2 p/g) | 3 (0.4 p/g) | 5 (16.7% rate) | 1.47 | 5.9 | - |
#87 | #102 | #109 | #34 | #8 | #59 | - |
Target Share | Routes Run | Route Participation Route % | Yards Per Reception | Yards Per Route Run | Catch Rate Catch Rate | Drops |
---|---|---|---|---|---|---|
2.3% | 7 (0.9 p/g) | 3.1% | 11.3 (6.8 ypt) | 4.86 | 60.0% | 1 (20.0% rate) |
- | #120 | - | - | - | - | #55 |
True Yards Per Carry | Yards Per Touch | Juke Rate | Evaded Tackles | Breakaway Run Rate | Breakaway Runs | Best Ball Points Added |
---|---|---|---|---|---|---|
3.7 (3.9 ypc) | 4.6 | 23.3% | 7 (0.9 p/g) | 3.7% | 1 (0.1 p/g) | 13.8 (1.70 p/g) |
- | - | - | #82 | - | #63 | #63 |
Yards Created | Yards Created Per Touch Yards Created/Touch | Production Premium | Expected Points Added (EPA) Expected Pts Added | Dominator Rating | Game Script | Run Blocking Rating |
---|---|---|---|---|---|---|
48 (6.0 p/g) | 1.60 | +27.0 | +6.1 | 10.7% | +4.54 | 0.0 |
#73 | - | - | #120 | #66 | #4 | #154 |
Average Defenders In The Box Defenders In The Box | Stacked Front Carry Rate Stacked Front Carry % | Base Front Carry Rate Base Front Carry % | Light Front Carry Rate Light Front Carry % | Shotgun Carry Rate Shotgun Carry % | Under Center Carry Rate Under Center Carry % | Stuffed Runs |
---|---|---|---|---|---|---|
7.0 | 37.0% (1.0 ypc) | 29.6% (3.8 ypc) | 33.3% (7.2 ypc) | 11.1% (10.3 ypc) | 88.9% (3.1 ypc) | 5 (18.5% rate) |
- | - | #94 | - | - | - | - |
Snap Share | Opportunity Share | Weighted Opportunities | Team Run Plays Per Game Team Run Plays/Gm | Carries | Targets | Red Zone Touches |
---|---|---|---|---|---|---|
52.7% | 49.1% | 63.2 (10.5 p/g) | - (2.23 pace) | 66 (11.0 p/g) | 15 (2.5 p/g) | 15 (0 gl) |
#25 | #28 | #72 | - | #59 | #74 | #55 |
Rushing Yards | Receiving Yards | Receptions | Total TDs | Fantasy Points Per Opportunity Fantasy Pts/Opportunity | Fantasy Points Per Game | Expected Fantasy Points Per Game Expected Fantasy Pts/Gm |
---|---|---|---|---|---|---|
266 (44.3 p/g) | 98 (16.3 p/g) | 12 (2.0 p/g) | 0 (0.0% rate) | 0.55 | 7.4 | - |
#60 | #68 | #69 | #99 | #118 | - | - |
Target Share | Routes Run | Route Participation Route % | Yards Per Reception | Yards Per Route Run | Catch Rate Catch Rate | Drops |
---|---|---|---|---|---|---|
7.5% | 84 (14.0 p/g) | 39.4% | 8.2 (6.5 ypt) | 1.17 | 80.0% | 0 (0.0% rate) |
- | #56 | - | - | - | - | #82 |
True Yards Per Carry | Yards Per Touch | Juke Rate | Evaded Tackles | Breakaway Run Rate | Breakaway Runs | Best Ball Points Added |
---|---|---|---|---|---|---|
4.0 (4.0 ypc) | 4.7 | 25.6% | 20 (3.3 p/g) | 3.0% | 2 (0.3 p/g) | 11.0 (1.80 p/g) |
#43 | - | - | #59 | - | #63 | #69 |
Yards Created | Yards Created Per Touch Yards Created/Touch | Production Premium | Expected Points Added (EPA) Expected Pts Added | Dominator Rating | Game Script | Run Blocking Rating |
---|---|---|---|---|---|---|
39 (6.5 p/g) | 0.50 | -30.9 | - | 15.6% | -3.59 | - |
#85 | - | #75 | - | #41 | #27 | - |
Average Defenders In The Box Defenders In The Box | Stacked Front Carry Rate Stacked Front Carry % | Base Front Carry Rate Base Front Carry % | Light Front Carry Rate Light Front Carry % | Shotgun Carry Rate Shotgun Carry % | Under Center Carry Rate Under Center Carry % | Stuffed Runs |
---|---|---|---|---|---|---|
7.2 | 34.8% (4.0 ypc) | 50.0% (4.0 ypc) | 15.2% (4.1 ypc) | 19.7% (5.3 ypc) | 80.3% (3.7 ypc) | 9 (13.6% rate) |
#7 | - | #17 | - | - | - | #59 |
Week Wk | Opponent Opp | Snap Share Snap Share | Carries Carries | Routes Routes | Targets Targets | Receptions Receptions | Total Yards Total Yards | Total TDs Total TDs | Fantasy Points Fantasy Points |
---|---|---|---|---|---|---|---|---|---|
1 | CHI | 58.2% | 9 (3 rz) | 9 (30.0% rate) | 2 | 2 | 30 | 0 | 5.0 (#52) |
2 | SEA | 51.4% | 18 (4 rz) | 9 (36.0% rate) | 2 | 2 | 103 | 0 | 12.3 (#15) |
3 | DEN | 70.8% | 12 (1 rz) | 7 (21.2% rate) | 3 | 3 | 106 | 0 | 11.6 (#25) |
4 | LAR | 67.3% | 18 (1 rz) | 7 (25.9% rate) | 0 | 0 | 74 | 1 | 13.4 (#21) |
5 | CAR | 58.1% | 17 (3 rz) | 13 (40.6% rate) | 2 | 1 | 132 | 1 | 20.2 (#12) |
6 | ATL | 50.9% | 7 (1 rz) | 15 (36.6% rate) | 1 | 0 | 25 | 0 | 0.5 (#60) |
7 | KC | 31.3% | 7 (0 rz) | 13 (25.5% rate) | 1 | 0 | 54 | 0 | 5.4 (#42) |
8 | LAR | 38.5% | 4 (1 rz) | 11 (37.9% rate) | 2 | 2 | 35 | 0 | 5.5 (#47) |
9 | CHI | 44.0% | 9 (3 rz) | 13 (43.3% rate) | 3 | 3 | 72 | 1 | 16.2 (#8) |
10 | CLE | 61.8% | 17 (3 rz) | 16 (47.1% rate) | 5 | 2 | 143 | 1 | 22.3 (#7) |
12 | HOU | 61.1% | 13 (4 rz) | 27 (58.7% rate) | 3 | 1 | 52 | 1 | 12.2 (#25) |
13 | SF | 35.6% | 1 (0 rz) | 13 (35.1% rate) | 2 | 0 | 3 | 0 | 0.3 (#73) |
14 | LAC | 14.3% | 4 (0 rz) | 1 (3.3% rate) | 0 | 0 | 26 | 0 | 2.6 (#53) |
16 | GB | 61.4% | 9 (2 rz) | 12 (44.4% rate) | 2 | 1 | 40 | 1 | 11.0 (#24) |
17 | NE | 63.8% | 15 (1 rz) | 21 (50.0% rate) | 7 | 3 | 76 | 0 | 10.6 (#22) |
18 | NYJ | 65.1% | 16 (0 rz) | 17 (53.1% rate) | 2 | 2 | 74 | 0 | 9.4 (#27) |
19 | BUF | 57.1% | 10 (2 rz) | 26 (53.1% rate) | 4 | 1 | 36 | 1 | 10.6 (#11) |
Week Wk | Opponent Opp | Snap Share Snap Share | Carries Carries | Routes Routes | Targets Targets | Receptions Receptions | Total Yards Total Yards | Total TDs Total TDs | Fantasy Points Fantasy Points |
---|---|---|---|---|---|---|---|---|---|
10 | LAR | 32.3% | 10 (1 rz) | 4 | 0 | 0 | 28 | 0 | 2.8 (#53) |
11 | JAX | 59.4% | 19 (4 rz) | 7 | 2 | 1 | 58 | 0 | 6.8 (#32) |
12 | MIN | 13.8% | 2 (0 rz) | 2 | 1 | 1 | 7 | 0 | 1.7 (#64) |
13 | SEA | 1.8% | 0 (0 rz) | 1 | 0 | 0 | 0 | 0 | 0.0 (#66) |
14 | CIN | 60.3% | 13 (0 rz) | 14 | 0 | 0 | 56 | 0 | 5.6 (#38) |
15 | ATL | 89.3% | 21 (2 rz) | 12 | 2 | 2 | 119 | 1 | 19.9 (#3) |
16 | TEN | 74.1% | 14 (3 rz) | 21 | 3 | 3 | 57 | 1 | 14.7 (#16) |
17 | HOU | 13.1% | 0 (0 rz) | 2 | 0 | 0 | 0 | 0 | 0.0 (#77) |
18 | LAR | 7.5% | 0 (0 rz) | 0 | 0 | 0 | 0 | 0 | 0.0 (#81) |
19 | DAL | 4.8% | 0 (0 rz) | 1 | 0 | 0 | 0 | 0 | 0.0 (#30) |
20 | GB | 0.0% | 0 (0 rz) | 0 | 0 | 0 | 0 | 0 | 0.0 (#16) |
Week Wk | Opponent Opp | Snap Share Snap Share | Carries Carries | Routes Routes | Targets Targets | Receptions Receptions | Total Yards Total Yards | Total TDs Total TDs | Fantasy Points Fantasy Points |
---|---|---|---|---|---|---|---|---|---|
2 | NYJ | 8.5% | 2 (0 rz) | 0 | 0 | 0 | 3 | 0 | 0.3 (#81) |
3 | NYG | 29.1% | 12 (5 rz) | 9 | 3 | 3 | 69 | 2 | 21.9 (#10) |
4 | PHI | 8.2% | 3 (1 rz) | 3 | 1 | 1 | 19 | 0 | 2.9 (#61) |
5 | MIA | 20.3% | 4 (0 rz) | 5 | 1 | 0 | 27 | 0 | 2.7 (#51) |
7 | NE | 56.3% | 17 (5 rz) | 11 | 2 | 2 | 120 | 3 | 32.0 (#1) |
12 | LAR | 35.3% | 12 (0 rz) | 9 | 0 | 0 | 40 | 0 | 2.0 (#62) |
13 | BUF | 46.7% | 7 (3 rz) | 15 | 5 | 2 | 59 | 0 | 7.9 (#31) |
14 | WAS | 35.9% | 11 (3 rz) | 17 | 3 | 1 | 44 | 1 | 9.4 (#27) |
15 | DAL | 46.9% | 16 (5 rz) | 19 | 4 | 0 | 60 | 1 | 12.0 (#27) |
16 | ARI | 71.2% | 22 (0 rz) | 6 | 2 | 1 | 204 | 1 | 27.4 (#5) |
17 | SEA | 84.4% | 20 (3 rz) | 26 | 7 | 3 | 88 | 2 | 23.8 (#7) |
Week Wk | Opponent Opp | Snap Share Snap Share | Carries Carries | Routes Routes | Targets Targets | Receptions Receptions | Total Yards Total Yards | Total TDs Total TDs | Fantasy Points Fantasy Points |
---|---|---|---|---|---|---|---|---|---|
2 | CIN | 20.6% | 10 (5 rz) | 0 | 0 | 0 | 34 | 2 | 15.4 (##14) |
3 | PIT | 20.8% | 8 (8 rz) | 2 | 1 | 0 | 18 | 2 | 13.8 (##20) |
7 | WAS | 11.7% | 5 (1 rz) | 1 | 0 | 0 | 20 | 0 | 2.0 (##58) |
8 | CAR | 5.0% | 2 (2 rz) | 0 | 0 | 0 | 6 | 0 | 0.6 (##73) |
9 | ARI | 2.9% | 0 (0 rz) | 0 | 1 | 1 | 2 | 0 | 1.2 (##64) |
11 | ARI | 1.6% | 0 (0 rz) | 1 | 1 | 1 | 25 | 1 | 9.5 (##30) |
12 | GB | 9.5% | 2 (0 rz) | 1 | 1 | 0 | 27 | 0 | 2.7 (##57) |
13 | BAL | 12.0% | 0 (0 rz) | 2 | 1 | 1 | 7 | 0 | 1.7 (##70) |
Week Wk | Opponent Opp | Snap Share Snap Share | Carries Carries | Routes Routes | Targets Targets | Receptions Receptions | Total Yards Total Yards | Total TDs Total TDs | Fantasy Points Fantasy Points |
---|---|---|---|---|---|---|---|---|---|
12 | TB | 39.3% | 7 (1 rz) | 13 | 1 | 1 | 41 | 0 | 5.1 (##44) |
13 | SEA | 76.1% | 15 (2 rz) | 28 | 9 | 8 | 134 | 0 | 19.4 (##8) |
14 | DEN | 90.5% | 23 (2 rz) | 15 | 2 | 1 | 96 | 0 | 10.6 (##27) |
15 | SEA | 20.0% | 7 (1 rz) | 4 | 1 | 0 | 46 | 0 | 2.6 (##59) |
16 | CHI | 67.9% | 11 (5 rz) | 23 | 2 | 2 | 38 | 0 | 5.8 (##47) |
17 | LA | 10.9% | 3 (0 rz) | 1 | 0 | 0 | 9 | 0 | 0.9 (##82) |
Stock Prices

Stock Prices

Value Over Stream
(VOS)Value Over Stream: Valuation scheme calculates a player’s fantasy pts/game over the average waiver wire replacement in standard fantasy league formats during either the current season (or previous year during the offseason) and adjusts for positional bust rates. VOS rank in parenthesis spans all positions, enabling player comparisons across QB's, RB's, WR's, and TE's.
Total Touches
Opportunity Share
Fantasy Points
Total Touches
Opportunity Share
Fantasy Points
Popularity Index
Player Popularity Index (PPI) ranks PlayerProfiler page views over the last 30 days. For example, the No. 1 PPI player page is the most frequently visited page in recent weeks.
Jeff Wilson Injury History
Year Year | Games Games | Rush Attempts Rush Atts | Rushing Yards Rush Yrds | Total Touchdowns TDs | Receptions Rec | Receiving Yards Rec Yrds | Target Share Tgt Share | Age Age | School School |
---|---|---|---|---|---|---|---|---|---|
2014 | 9 (RB) | 50 | 224 (1 tds) | 2 | 5 | 41 | - | 19 | North Texas |
2015 | 10 (RB) | 154 | 829 (1 tds) | 1 | 12 | 71 | - | 20 | North Texas |
2016 | 11 (RB) | 169 | 936 (14 tds) | 15 | 29 | 547 | - | 21 | North Texas |
2017 | 11 (RB) | 188 | 1,215 (16 tds) | 16 | 24 | 168 | - | 22 | North Texas |
Who is Jeff Wilson
Despite the hefty numbers, Jeff Wilson Jr.’s name went uncalled in the 2018 NFL Draft. An unsatisfactory 4.62 40-yard dash didn't do him many favors. But it wasn’t so bad for him; he latched on with the San Francisco 49ers as an undrafted free agent. He was waived during roster cuts in training camp, but stuck around on the 49ers’ practice squad. He eventually worked his way into a promotion to the main roster, but only toted the rock 93 times in his first two NFL seasons. He got his big break in the 2020 season. After a myriad of injuries to the 49ers’ entire roster, including starting running back Raheem Mostert, Wilson got his chance to showcase his abilities as a starting running back. He didn’t disappoint. In Week 7, Wilson gashed the New England Patriots for 112 yards and three touchdowns on the ground after 17 carries. Wilson got hurt himself after that but got another opportunity to close the season. From Week 14 through Week 17, Wilson registered double-digit carries in every game and at least 16 in the last three. He rumbled for 350 yards in that four-game span and scored three touchdowns. As a receiver, he added a couple more scores. He ended the season as the RB32 in fantasy football.
Jeff Wilson Jr. proved his worth, but a knee injury forced him to open the 2021 season on the PUP list. He missed San Francisco’s first nine games of the season. By the time he returned, it was too late. Sixth-round rookie sensation Elijah Mitchell was putting up records in the 49ers’ backfield as the new starting running back and would not relinquish that role back. Wilson did fill in as the starter a few times, but aside from a 110-yard touchdown performance against the Atlanta Falcons, he could not find the same magic. Wilson's true yards per carry of 3.7 ranked 64th among running backs. His 18 evaded tackles ranked 59th at the position and his 63 routes run ranked 78th. He only played 38.6-percent of the team's snaps and registered just 8 targets which resulted in a paltry 3.5-percent target share Wilson is a good running back and will be back with the 49ers in 2022.