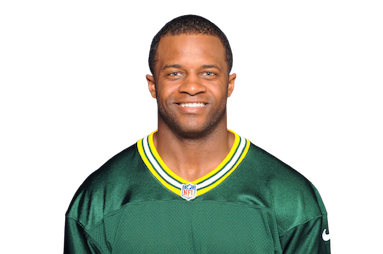
Curtis Samuel Limited At Minicamp
Washington Commanders wide receiver Curtis Samuel was ...
Year Year | Games Played Games | Targets Tgts | Receptions Rec | Receiving Yards Rec Yds | Yards Per Reception YPR | Air Yards Air Yds | Receiving TDs Rec TD | Fantasy Points Per Game Fantasy Pts/Game |
---|---|---|---|---|---|---|---|---|
2021 | 5 | 9 | 6 | 27 | 4.5 | 14 | 0 | 2.0 |
2020 | 15 | 97 | 77 | 851 | 11.1 | 694 | 3 | 14.1 (#27) |
2019 | 16 | 107 | 54 | 627 | 11.6 | 1542 | 6 | 10.7 (#48) |
2018 | 13 | 65 | 39 | 494 | 12.7 | 804 | 5 | 10.5 (#43) |
2017 | 8 | 26 | 15 | 115 | 7.7 | 249 | 0 | 4.1 (#110) |
Targets | Target Share | Target Rate | Snap Share | Slot Snaps | Routes Run | Route Participation Route % |
---|---|---|---|---|---|---|
9 (1.8 p/g) | 5.3% (0.0% rz) | 24.3% | 23.2% | 21 (26.3% rate) | 37 (7.4 p/g) | 21.4% |
#172 | - | - | #172 | #176 | #188 | - |
Air Yards | Air Yards Share | Average Target Distance (ADOT) Target Depth (ADOT) | Deep Targets | Red Zone Targets Red Zone Tgts | Target Quality Rating | Catchable Target Rate |
---|---|---|---|---|---|---|
14 (2.8 p/g) | 1.0% | 1.6 | 0 (0.0 p/g) | 0 (0 rec) | 3.04 | 66.7% (6 tgts) |
- | - | - | - | - | - | - |
Receptions Recs | Receiving Yards Rec Yards | Yards After Catch YAC | Unrealized Air Yards | Total TDs | Fantasy Points Per Game Fantasy Pts/Game | Expected Fantasy Points Per Game Expected Fantasy Pts/Game |
---|---|---|---|---|---|---|
6 (1.2 p/g) | 27 (5.4 p/g) | 33 (3.7 p/tgt) | 20 (2.2 p/tgt) | 0 (0.0% rate) | 2.0 | 2.5 (-0.51 diff) |
#161 | #195 | #150 | #197 | - | - | - |
Target Accuracy | Yards Per Route Run | Formation Adjusted Yards Per Route Run Formation Adjusted YPRR | Yards Per Target YPT | Yards Per Reception YPR | Yards Per Team Pass Attempt Yards/Team Pass Attempt | True Catch Rate |
---|---|---|---|---|---|---|
6.9 | 0.73 | 0.59 | 3.0 | 4.5 | 0.06 | 100.0% (66.7% actual) |
- | - | - | - | - | - | - |
Target Separation | Average Cushion | Target Premium | Dominator Rating | Juke Rate | Drops | Contested Catch Rate Contested Catch % |
---|---|---|---|---|---|---|
0.33 | 3.22 | -33.2% | 1.2% | 16.7% | 0 (0.0% rate) | 0.0% (1 tgts) |
- | - | - | - | - | - | - |
Production Premium | Expected Points Added (EPA) EPA | QB Rating Per Target QB Rating Per Target | Best Ball Points Added Best Ball Pts Added | Fantasy Points Per Route Run Fantasy Points Per Route | Fantasy Points Per Target Fantasy Points Per Target | Total Fantasy Points Total Fantasy Pts |
---|---|---|---|---|---|---|
-38.4 | +0.5 | 70.1 | 0.0 (0.0 p/g) | 0.26 | 1.09 | 9.80 |
- | #165 | - | - | - | - | #181 |
Total Route Wins | Route Win Rate | Routes vs Man | Win Rate vs Man | Target Rate vs Man | Target Separation vs Man Tgt Separation vs Man | Fantasy Points Per Target vs Man Fantasy Pts/Tgt vs Man |
---|---|---|---|---|---|---|
9 | 29.0% | 9 (22 zone) | 22.2% (22.7% zone) | 22.2% (18.2% zone) | 2.00 (1.00 zone) | 1.00 (0.98 zone) |
#191 | - | #211 | - | - | - | - |
Targets | Target Share | Target Rate | Snap Share | Slot Snaps | Routes Run | Route Participation Route % |
---|---|---|---|---|---|---|
97 (6.5 p/g) | 19.7% (22.2% rz) | 22.4% | 68.5% | 340 (53.3% rate) | 433 (28.9 p/g) | 83.3% |
#37 | #40 | #33 | #68 | #19 | #47 | - |
Air Yards | Air Yards Share | Average Target Distance (ADOT) Target Depth (ADOT) | Deep Targets | Red Zone Targets Red Zone Tgts | Target Quality Rating | Catchable Target Rate |
---|---|---|---|---|---|---|
694 (46.3 p/g) | 18.2% | 7.2 | 13 (0.9 p/g) | 12 (10 rec) | 5.67 | 85.6% (83 tgts) |
#66 | #72 | #100 | #47 | #29 | #52 | #6 |
Receptions Recs | Receiving Yards Rec Yards | Yards After Catch YAC | Unrealized Air Yards | Total TDs | Fantasy Points Per Game Fantasy Pts/Game | Expected Fantasy Points Per Game Expected Fantasy Pts/Game |
---|---|---|---|---|---|---|
77 (5.1 p/g) | 851 (56.7 p/g) | 337 (3.5 p/tgt) | 180 (1.9 p/tgt) | 5 (4.2% rate) | 14.1 | 11.5 (+2.59 diff) |
#21 | #31 | #22 | #102 | #34 | #27 | #46 |
Target Accuracy | Yards Per Route Run | Formation Adjusted Yards Per Route Run Formation Adjusted YPRR | Yards Per Target YPT | Yards Per Reception YPR | Yards Per Team Pass Attempt Yards/Team Pass Attempt | True Catch Rate |
---|---|---|---|---|---|---|
303.0 | 1.97 | 1.93 | 8.8 | 11.1 | 1.55 | 92.8% (79.4% actual) |
#30 | #28 | #18 | #42 | #82 | #32 | #12 |
Target Separation | Average Cushion | Target Premium | Dominator Rating | Juke Rate | Drops | Contested Catch Rate Contested Catch % |
---|---|---|---|---|---|---|
1.61 | 4.06 | +31.0% | 20.3% | - | 5 (5.2% rate) | 62.5% (8 tgts) |
#60 | #22 | #19 | #54 | - | #24 | #18 |
Production Premium | Expected Points Added (EPA) EPA | QB Rating Per Target QB Rating Per Target | Best Ball Points Added Best Ball Pts Added | Fantasy Points Per Route Run Fantasy Points Per Route | Fantasy Points Per Target Fantasy Points Per Target | Total Fantasy Points Total Fantasy Pts |
---|---|---|---|---|---|---|
-5.1 | +26.4 | 109.2 | 82.3 (5.5 p/g) | 0.49 | 2.19 | 212.10 |
#157 | #57 | #30 | #27 | #16 | #13 | #24 |
Targets | Target Share | Target Rate | Snap Share | Slot Snaps | Routes Run | Route Participation Route % |
---|---|---|---|---|---|---|
107 (6.7 p/g) | 17.7% (23.4% rz) | 19.8% | 91.0% | 202 (21.8% rate) | 540 (33.8 p/g) | 85.3% |
#27 | #53 | #78 | #23 | #38 | #3 | #26 |
Air Yards | Air Yards Share | Average Target Distance (ADOT) Target Depth (ADOT) | Deep Targets | Red Zone Targets Red Zone Tgts | Target Quality Rating | Catchable Target Rate |
---|---|---|---|---|---|---|
1542 (96.4 p/g) | 29.5% | 14.4 | 27 (1.7 p/g) | 15 (9 rec) | 4.16 | 62.6% (67 tgts) |
#11 | #30 | #18 | #8 | #18 | #101 | #105 |
Receptions Recs | Receiving Yards Rec Yards | Yards After Catch YAC | Unrealized Air Yards | Total TDs | Fantasy Points Per Game Fantasy Pts/Game | Expected Fantasy Points Per Game Expected Fantasy Pts/Game |
---|---|---|---|---|---|---|
54 (3.4 p/g) | 627 (39.2 p/g) | 126 (1.2 p/tgt) | 1041 (9.7 p/tgt) | 7 (9.6% rate) | 10.7 | - |
#42 | #52 | #74 | #2 | #13 | #48 | - |
Target Accuracy | Yards Per Route Run | Formation Adjusted Yards Per Route Run Formation Adjusted YPRR | Yards Per Target YPT | Yards Per Reception YPR | Yards Per Team Pass Attempt Yards/Team Pass Attempt | True Catch Rate |
---|---|---|---|---|---|---|
5.9 | 1.16 | - | 5.9 | 11.6 | 0.99 | 80.6% (50.5% actual) |
#105 | #95 | - | #94 | #70 | #71 | #60 |
Target Separation | Average Cushion | Target Premium | Dominator Rating | Juke Rate | Drops | Contested Catch Rate Contested Catch % |
---|---|---|---|---|---|---|
1.75 | 5.19 | -2.7% | 25.2% | - | 6 (5.6% rate) | 29.2% (24 tgts) |
#23 | #3 | #62 | #38 | - | #18 | #71 |
Production Premium | Expected Points Added (EPA) EPA | QB Rating Per Target QB Rating Per Target | Best Ball Points Added Best Ball Pts Added | Fantasy Points Per Route Run Fantasy Points Per Route | Fantasy Points Per Target Fantasy Points Per Target | Total Fantasy Points Total Fantasy Pts |
---|---|---|---|---|---|---|
-20.3 | +26.5 | 79.5 | 53.5 (3.3 p/g) | 0.32 | 1.60 | 171.70 |
#73 | #69 | #81 | #44 | #82 | #72 | #36 |
Targets | Target Share | Target Rate | Snap Share | Slot Snaps | Routes Run | Route Participation Route % |
---|---|---|---|---|---|---|
65 (5.0 p/g) | 14.4% (15.5% rz) | 26.1% | 56.7% | 100 (22.2% rate) | 249 (19.2 p/g) | 53.2% |
#66 | #76 | #24 | #106 | #81 | #83 | #99 |
Air Yards | Air Yards Share | Average Target Distance (ADOT) Target Depth (ADOT) | Deep Targets | Red Zone Targets Red Zone Tgts | Target Quality Rating | Catchable Target Rate |
---|---|---|---|---|---|---|
804 (61.8 p/g) | 22.9% | 12.4 | - (0.0 p/g) | 9 (4 rec) | 6.11 | 78.5% (51 tgts) |
#59 | #55 | #40 | - | #52 | #28 | #43 |
Receptions Recs | Receiving Yards Rec Yards | Yards After Catch YAC | Unrealized Air Yards | Total TDs | Fantasy Points Per Game Fantasy Pts/Game | Expected Fantasy Points Per Game Expected Fantasy Pts/Game |
---|---|---|---|---|---|---|
39 (3.0 p/g) | 494 (38.0 p/g) | 92 (1.4 p/tgt) | 402 (6.2 p/tgt) | 7 | 10.5 | - |
#65 | #68 | #98 | #59 | #13 | #43 | - |
Target Accuracy | Yards Per Route Run | Formation Adjusted Yards Per Route Run Formation Adjusted YPRR | Yards Per Target YPT | Yards Per Reception YPR | Yards Per Team Pass Attempt Yards/Team Pass Attempt | True Catch Rate |
---|---|---|---|---|---|---|
6.5 | 1.98 | - | 7.6 | 12.7 | 1.06 | 76.5% (60.0% actual) |
#88 | #44 | - | #62 | #59 | #74 | #87 |
Target Separation | Average Cushion | Target Premium | Dominator Rating | Juke Rate | Drops | Contested Catch Rate Contested Catch % |
---|---|---|---|---|---|---|
1.27 | 4.29 | +16.5% | 18.1% | - | 4 (6.2% rate) | 54.5% (11 tgts) |
#79 | #37 | #26 | #58 | - | #36 | #31 |
Production Premium | Expected Points Added (EPA) EPA | QB Rating Per Target QB Rating Per Target | Best Ball Points Added Best Ball Pts Added | Fantasy Points Per Route Run Fantasy Points Per Route | Fantasy Points Per Target Fantasy Points Per Target | Total Fantasy Points Total Fantasy Pts |
---|---|---|---|---|---|---|
+8.5 | - | 96.6 | 28.5 (2.2 p/g) | 0.55 | 2.10 | 136.80 |
#27 | - | #52 | #119 | #15 | #16 | #50 |
Targets | Target Share | Target Rate | Snap Share | Slot Snaps | Routes Run | Route Participation Route % |
---|---|---|---|---|---|---|
26 (3.2 p/g) | 9.6% (3.4% rz) | 22.2% | 37.0% | 34 (17.9% rate) | 117 (14.6 p/g) | 42.5% |
#120 | - | - | #141 | #115 | #128 | - |
Air Yards | Air Yards Share | Average Target Distance (ADOT) Target Depth (ADOT) | Deep Targets | Red Zone Targets Red Zone Tgts | Target Quality Rating | Catchable Target Rate |
---|---|---|---|---|---|---|
249 (31.1 p/g) | 9.0% | 9.6 | - (0.0 p/g) | 1 (1 rec) | 0.00 | 76.9% (20 tgts) |
- | - | - | - | #139 | - | - |
Receptions Recs | Receiving Yards Rec Yards | Yards After Catch YAC | Unrealized Air Yards | Total TDs | Fantasy Points Per Game Fantasy Pts/Game | Expected Fantasy Points Per Game Expected Fantasy Pts/Game |
---|---|---|---|---|---|---|
15 (1.9 p/g) | 115 (14.4 p/g) | 52 (2.0 p/tgt) | 186 (7.2 p/tgt) | 0 (0.0% rate) | 4.1 | - |
#120 | #134 | #109 | - | #132 | #110 | - |
Target Accuracy | Yards Per Route Run | Formation Adjusted Yards Per Route Run Formation Adjusted YPRR | Yards Per Target YPT | Yards Per Reception YPR | Yards Per Team Pass Attempt Yards/Team Pass Attempt | True Catch Rate |
---|---|---|---|---|---|---|
0.0 | 0.98 | - | 4.4 | 7.7 | 0.42 | 75.0% (57.7% actual) |
- | - | - | - | - | - | - |
Target Separation | Average Cushion | Target Premium | Dominator Rating | Juke Rate | Drops | Contested Catch Rate Contested Catch % |
---|---|---|---|---|---|---|
1.42 | 4.10 | -19.8% | 6.5% | - | 2 (7.7% rate) | 25.0% (4 tgts) |
- | - | - | #140 | - | #95 | - |
Production Premium | Expected Points Added (EPA) EPA | QB Rating Per Target QB Rating Per Target | Best Ball Points Added Best Ball Pts Added | Fantasy Points Per Route Run Fantasy Points Per Route | Fantasy Points Per Target Fantasy Points Per Target | Total Fantasy Points Total Fantasy Pts |
---|---|---|---|---|---|---|
-28.8 | - | 68.6 | 0.6 (0.1 p/g) | 0.28 | 1.27 | 32.90 |
- | - | - | #269 | - | - | #128 |
Week Wk | Opponent Opp | Primary Corner Primary Corner | Snap Share Snap Share | Routes Routes | Targets Targets | Receptions Receptions | Receiving Yards Receiving Yards | Fantasy Points Fantasy Points |
---|---|---|---|---|---|---|---|---|
4 | ATL | A.J. Terrell | 39.1% | 15 | 4 | 4 | 19 (2 air) | 5.9 (#76) |
5 | NO | Paulson Adebo | 5.3% | 2 | 1 | 0 | 0 | 0.8 (#119) |
12 | SEA | Sidney Jones | 25.0% | 6 | 1 | 1 | 9 (-3 air) | 2.3 (#91) |
13 | LV | Casey Hayward | 29.5% | 9 | 1 | 1 | -1 (-5 air) | 0.8 (#102) |
14 | DAL | Anthony Brown | 20.3% | 5 | 2 | 0 | 0 (20 air) | 0.0 (#100) |
Week Wk | Opponent Opp | Primary Corner Primary Corner | Snap Share Snap Share | Routes Routes | Targets Targets | Receptions Receptions | Receiving Yards Receiving Yards | Fantasy Points Fantasy Points |
---|---|---|---|---|---|---|---|---|
1 | LV | Lamarcus Joyner | 72.7% | 28 | 8 | 5 | 38 (70 air) | 9.3 (#50) |
2 | TB | Sean Murphy-Bunting | 72.9% | 30 | 2 | 2 | 13 (8 air) | 5.9 (#86) |
3 | LAC | Casey Hayward | 64.7% | 23 | 4 (2 rz) | 4 | 45 (15 air) | 9.2 (#48) |
4 | ARI | Byron Murphy | 47.2% | 22 | 4 | 3 | 51 (28 air) | 7.8 (#57) |
5 | ATL | Isaiah Oliver | 73.4% | 33 | 5 | 5 | 36 (32 air) | 11.4 (#36) |
7 | NO | Patrick Robinson | 48.8% | 16 | 6 | 6 | 48 (18 air) | 17.3 (#24) |
8 | ATL | Isaiah Oliver | 71.7% | 26 | 5 | 4 (1 tds) | 31 (57 air) | 21.4 (#10) |
9 | KC | Rashad Fenton | 75.0% | 40 | 9 (3 rz) | 9 (1 tds) | 105 (56 air) | 26.8 (#7) |
10 | TB | Sean Murphy-Bunting | 76.1% | 26 | 5 | 3 | 8 (20 air) | 4.2 (#74) |
11 | DET | Justin Coleman | 68.1% | 31 | 10 (3 rz) | 8 (1 tds) | 70 (46 air) | 21.4 (#11) |
12 | MIN | Jeff Gladney | 64.1% | 28 | 5 | 5 | 72 (30 air) | 12.7 (#31) |
14 | DEN | Will Parks | 80.0% | 42 | 9 (3 rz) | 7 | 68 (53 air) | 16.0 (#23) |
15 | GB | Chandon Sullivan | 83.1% | 35 | 9 (1 rz) | 4 | 42 (75 air) | 8.8 (#55) |
16 | WAS | Jimmy Moreland | 56.7% | 22 | 5 | 5 | 106 (75 air) | 20.8 (#14) |
17 | NO | Grant Haley | 68.3% | 31 | 11 | 7 | 118 (111 air) | 19.1 (#18) |
Week Wk | Opponent Opp | Primary Corner Primary Corner | Snap Share Snap Share | Routes Routes | Targets Targets | Receptions Receptions | Receiving Yards Receiving Yards | Fantasy Points Fantasy Points |
---|---|---|---|---|---|---|---|---|
1 | LA | Aqib Talib | 90.2% | 32 | 4 | 3 | 32 | 6.2 (##69) |
2 | TB | Carlton Davis | 98.6% | 47 | 13 | 5 | 91 | 14.3 (##31) |
3 | ARI | Byron Murphy | 84.2% | 23 | 7 (3 rz) | 5 (1 tds) | 53 | 16.3 (##23) |
4 | HOU | Johnathan Joseph | 95.2% | 30 | 7 | 3 | 32 | 6.3 (##58) |
5 | JAC | Tre Herndon | 94.8% | 28 | 6 (1 rz) | 3 | 19 | 7.4 (##51) |
6 | TB | Carlton Davis | 83.6% | 28 | 6 (1 rz) | 4 (1 tds) | 70 | 23.8 (##5) |
8 | SF | Richard Sherman | 100.0% | 36 | 11 | 4 | 46 | 8.6 (##51) |
9 | TEN | Adoree' Jackson | 76.9% | 28 | 6 (2 rz) | 3 (1 tds) | 64 | 16.4 (##19) |
10 | GB | Kevin King | 89.4% | 36 | 8 (1 rz) | 4 (1 tds) | 35 | 13.5 (##24) |
11 | ATL | Desmond Trufant | 100.0% | 47 | 7 (1 rz) | 4 | 25 | 6.5 (##58) |
12 | NO | Eli Apple | 84.6% | 27 | 4 | 1 | 9 | 5.9 (##54) |
13 | WAS | Fabian Moreau | 100.0% | 42 | 7 (1 rz) | 4 (1 tds) | 65 | 16.5 (##22) |
14 | ATL | Blidi Wreh-Wilson | 100.0% | 40 | 4 | 2 | 25 | 6.2 (##66) |
15 | SEA | Akeem King | 94.4% | 40 | 8 (3 rz) | 5 (1 tds) | 31 | 16.4 (##24) |
16 | IND | Pierre Desir | 90.9% | 34 | 5 | 2 | 17 | 4.1 (##72) |
17 | NO | Marshon Lattimore | 52.2% | 22 | 4 (2 rz) | 2 | 13 | 3.3 (##85) |
Week Wk | Opponent Opp | Primary Corner Primary Corner | Snap Share Snap Share | Routes Routes | Targets Targets | Receptions Receptions | Receiving Yards Receiving Yards | Fantasy Points Fantasy Points |
---|---|---|---|---|---|---|---|---|
5 | NYG | Janoris Jenkins | 30.3% | 12 | 4 | 2 (1 tds) | 37 | 11.7 (##36) |
6 | WAS | Josh Norman | 3.4% | 1 | 0 | 0 | 0 | 0.0 (##109) |
7 | PHI | Dexter McDougle | 30.4% | 8 | 1 | 1 | 16 | 9.5 (##44) |
8 | BAL | Brandon Carr | 49.2% | 12 | 3 | 3 | 28 | 5.8 (##66) |
9 | TB | Brent Grimes | 38.6% | 8 | 4 (1 rz) | 2 (1 tds) | 25 | 19.8 (##10) |
10 | PIT | Coty Sensabaugh | 39.2% | 10 | 4 | 4 | 18 | 3.9 (##74) |
11 | DET | Nevin Lawson | 33.3% | 12 | 7 (1 rz) | 5 (1 tds) | 55 | 16.5 (##21) |
12 | SEA | Shaquill Griffin | 87.7% | 26 | 2 (1 rz) | 2 (1 tds) | 17 | 12.2 (##35) |
13 | TB | De'Vante Harris | 88.5% | 33 | 11 (1 rz) | 6 | 88 | 15.6 (##19) |
14 | CLE | - | 85.3% | 34 | 8 (1 rz) | 4 | 80 | 12.0 (##33) |
15 | NO | Eli Apple | 100.0% | 28 | 4 | 1 | 17 | 3.5 (##82) |
16 | ATL | Desmond Trufant | 85.4% | 46 | 13 (3 rz) | 7 | 41 | 11.1 (##45) |
17 | NO | Eli Apple | 50.7% | 19 | 4 (1 rz) | 2 (1 tds) | 72 | 15.2 (##26) |
Week Wk | Opponent Opp | Primary Corner Primary Corner | Snap Share Snap Share | Routes Routes | Targets Targets | Receptions Receptions | Receiving Yards Receiving Yards | Fantasy Points Fantasy Points |
---|---|---|---|---|---|---|---|---|
2 | BUF | - | 23.3% | 7 | 3 | 2 | 7 | 2.7 (##96) |
3 | NO | - | 63.6% | 25 | 5 | 2 | 5 | 5.6 (##70) |
5 | DET | - | 21.0% | 8 | 2 | 0 | 0 | 0.0 (##105) |
6 | PHI | - | 23.4% | 13 | 0 | 0 | 0 | 0.8 (##101) |
7 | CHI | - | 28.1% | 11 | 1 | 1 | 20 | 3.0 (##84) |
8 | TB | - | 11.1% | 5 | 3 | 2 | 15 | 4.6 (##56) |
9 | ATL | - | 77.4% | 22 | 5 | 3 | 23 | 6.7 (##51) |
10 | MIA | - | 54.9% | 25 | 7 (1 rz) | 5 | 45 | 9.5 (##42) |
Value Over Stream: Valuation scheme calculates a player’s fantasy pts/game over the average waiver wire replacement in standard fantasy league formats during either the current season (or previous year during the offseason) and adjusts for positional bust rates. VOS rank in parenthesis spans all positions, enabling player comparisons across QB's, RB's, WR's, and TE's.
Washington Commanders wide receiver Curtis Samuel was ...
Washington Commanders running back Antonio Gibson ...
Washington Commanders wide receiver Curtis Samuel's ...
Player Popularity Index (PPI) ranks PlayerProfiler page views over the last 30 days. For example, the No. 1 PPI player page is the most frequently visited page in recent weeks.
Year Year | Games Games | Receptions Recs | Receiving Yards Rec Yds | Target Share Tgt Share | Catch Rate Catch Rate | Special Teams Yards Special Teams | Age Age | School School |
---|---|---|---|---|---|---|---|---|
2014 | 14 (RB) | 11 (14 tgts) | 95 (8.6 ypr) | 3.4% | 78.6% | 246 | 18 | Ohio State |
2015 | 13 (RB) | 22 (35 tgts) | 289 (13.1 ypr) | 10.8% | 62.9% | 207 | 19 | Ohio State |
2016 | 13 (RB) | 74 (97 tgts) | 865 (11.7 ypr) | 23.7% | 76.3% | 19 | 20 | Ohio State |
Samuel signed a three-year, $34.5 million contract with the Commanders during the 2021 free agency period, reuniting with head coach Ron Rivera, who drafted and coached Samuel during their time with the Panthers from 2017 to 2019. Rivera was fired by Carolina at the end of the 2019 season and soon joined Washington for the 2020 season. It was during that season, under new head coach Matt Rhule, that Samuel enjoyed his best season with the Panthers.
In 2020, Samuel posted a receiving line of 77-851-3, and also rushed 41 times for 200 yards and another two touchdowns. Samuel’s 2020 season was easily the best of his career from a real-life standpoint, and it was reflected in fantasy as well, as he averaged 14.1 points per game good for a fantasy ranking of WR27, which was also a career-high as he ended the year as a high-end WR3 who just so happened to turn in seven games of 16.0 points or more.
Samuel dealt with both groin and hamstring injuries in 2021, with his groin injury dating back to the preseason. He appeared in just five games for Washington, saw nine targets and caught six passes for 27 yards. He also rushed four times for 11 yards.
When it comes to athleticism, we know Samuel has it. His 4.31 40 time (99th-percentile) and 110.5 speed score (92nd-percentile) suggest he has speed to burn in the open field. During his 2020 season, Samuel saw the 19th most snaps from the slot (340) and was No. 19 in target premium (+31.0%) and 40th in target share (19.7%. He totaled five drops in his last season with the Panthers and also ranked 22nd in YAC (337). His 433 routes run ranked 47th in the league, while his 694 air yards were the 66th most.
In 2019, which was Samuel’s most successful year under Rivera, Samuel saw career-highs in slot snaps (202), while also posting then career highs in receiving, with a line of 54-627-6.
Samuel isn’t the most imposing player on the field when it comes to size. But he’s a dangerous playmaker with elite speed who we’ve seen succeed in the slot in each of his last two healthy seasons. Step one for Samuel heading into the 2022 season will be getting healthy. Step two will be getting acclimated to an offense he didn’t get to play much in last season, along with (likely) a new quarterback. If he’s able to stay on the field, and returns to the slot role he has seen some success in, then the soon-to-be 26-year old wide receiver could be in line for a rebound in 2022. His ADP will be that of an affordable low-end receiver who we know still has plenty of upside when healthy.