
Don’t chase last year’s touchdowns. It’s a cliché for a reason. Touchdowns vary greatly from year to year, especially receiving touchdowns for wide receivers. The majority of receiving touchdowns are scored in the red zone, but perhaps nonintuitively, narrowing our focus to red zone receiving touchdowns does not increase year over year stability. What this means is a wide receiver who scored a huge number of red zone touchdowns last season is not likely to repeat that feat in the following season. That also goes for the inverse. Advanced stats and metrics for a player’s opportunity, however, tell a different story.
Yearly Correlation
Using the excellent, free play-by-play resource nflfastR, I plotted year over year red zone receiving touchdowns.
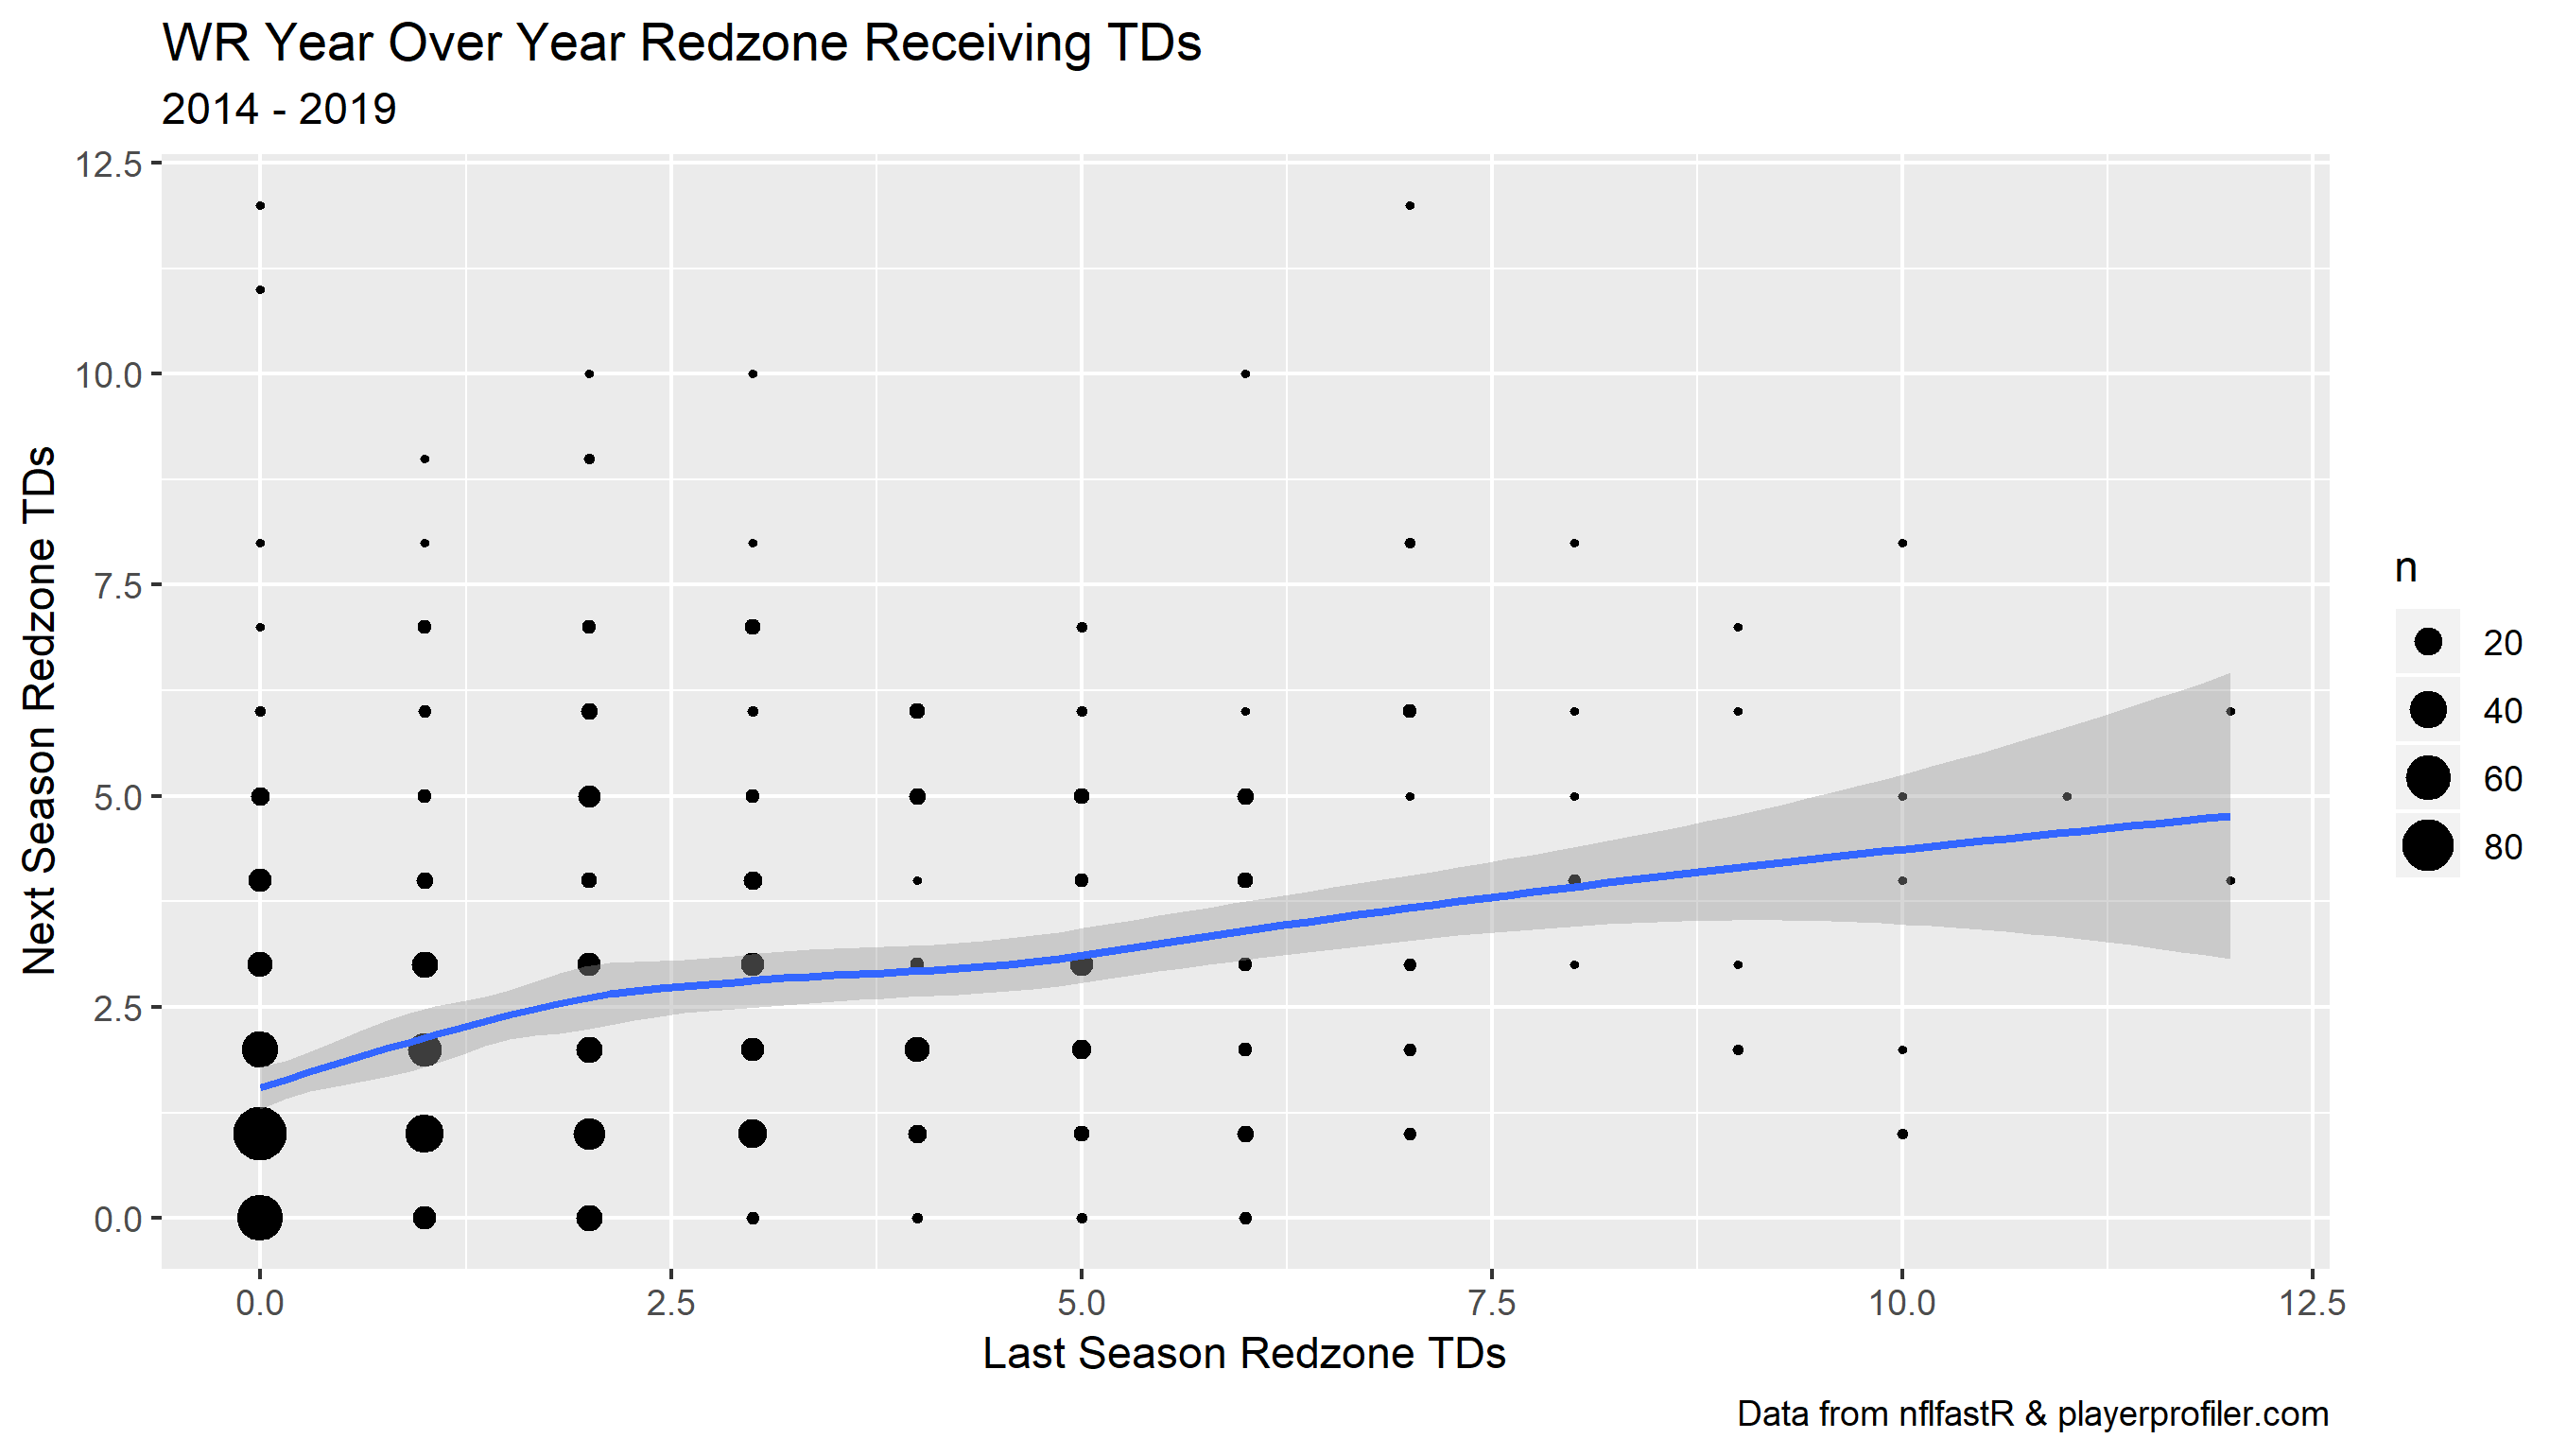
Red Zone TDs Year over Year
That is not a strong trend. In fact, the year over year correlation is a measly 0.11. This tells us that using last season’s red zone touchdowns will not be helpful in projecting red zone touchdowns for this season. An alternative approach is to look at advanced metrics for opportunity, PlayerProfiler’s Red Zone Target Share for example. Plotting the year over year correlation for Red Zone Target Share shows a different story.
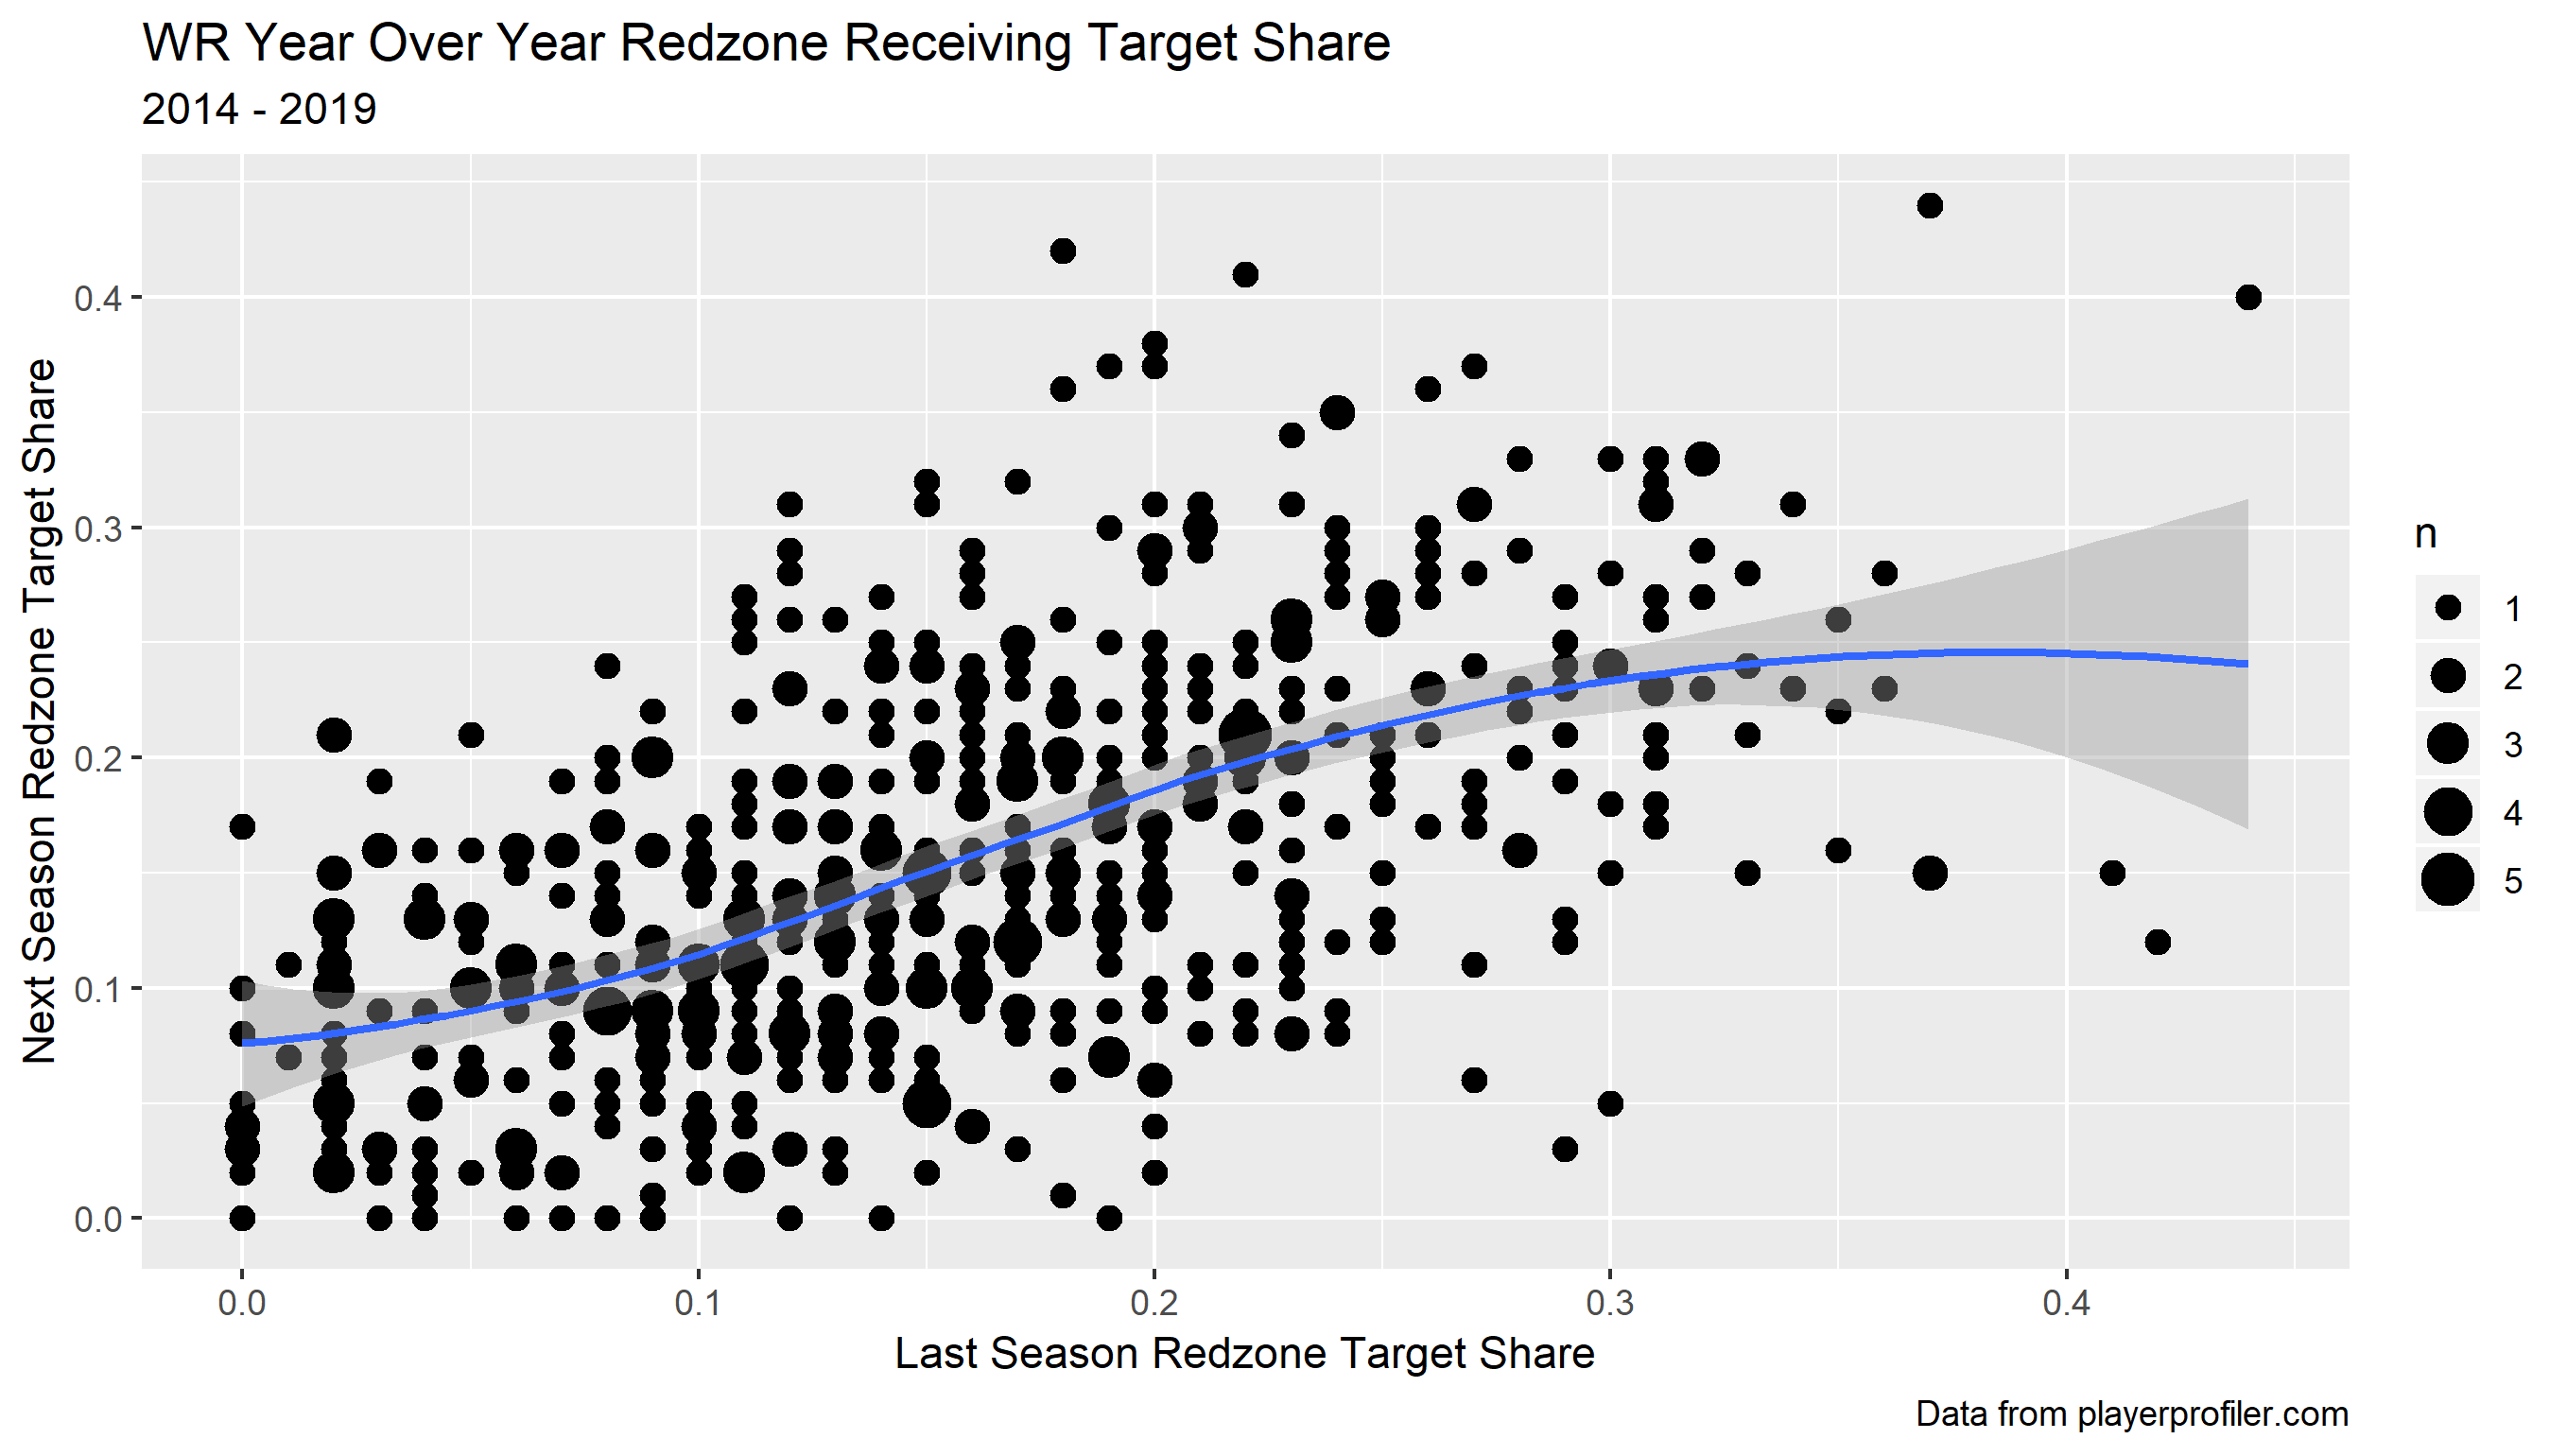
Red Zone Target Share Year over Year
Red Zone Target Share is three times more correlated than red zone touchdowns. A player’s Red Zone Target Share one year will be similar to what it is the next year. This is a tool we can use to build projections. Red Zone Receptions is another metric with similar, albeit slightly lower, year over year stability.
Regression Modelling
With these advanced opportunity metrics, we can predict red zone touchdowns a player would be expected to score. Since opportunity is stable year over year, a player should expect to see roughly the same opportunity in the next season. That player might produce vastly different touchdown totals given the same opportunity simply due to variance. On the whole, players experience regression to the mean for expected red zone touchdowns based on their opportunity.
I created a linear model to predict red zone receiving touchdowns based on Red Zone Target Share and Red Zone Receptions for each player that played in at least eight games in a season from 2014-2018. Then that model was applied to the wide receivers in 2019. Comparing Red Zone Touchdowns vs Predicted Red Zone Touchdowns gives us a view of which players may experience the most drastic regression.
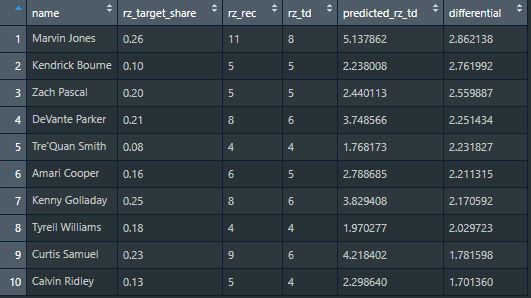
Top 10 Wide Receivers Fades Based on Negative TD Regression
Regression can be positive or negative. Today I’ll highlight players that are likely to be on the negative side of the coin. These are players that exceeded their expected red zone touchdowns and accordingly are primed for a downturn in 2020. They make for good sell candidates in dynasty and fades at their current ADPs in seasonal leagues.
Marvin Jones
This pains me to write as a documented member of the Marvin Jones fan club. However, there is no denying he ran hot in the touchdown department last season. Jones caught eight red zone touchdowns when his expected total would have been slightly over five given his opportunity metrics. Eight red zone touchdowns tied him with Michael Thomas for most among qualified wide receivers. In PPR leagues, taking away three touchdowns means at least 21 points come off the board, dropping Jones from WR28 to WR36.
Check out Marvin Jones’ 2020 Projection on PlayerProfiler’s “World Famous” Draft Kit:

It is interesting to note that Jones’s teammate Kenny Golladay also appears on the list of players most likely to negatively regress. Considering the context of the Detroit Lions, this does not come as much of a surprise. With little threat of a running game and only rookie T.J. Hockenson as a big target, these two should be expected to carry an oversized load in the red zone going into 2020 as well.
DeVante Parker
DeVante Parker‘s six red zone touchdowns tied him with three others for No. 5 among qualified wide receivers last year. Of those top eight players, Parker had the lowest Red Zone Target Share and tied for the least Red Zone Receptions. According to the model, that means he overshot his expected touchdowns by 2.25.
https://www.youtube.com/watch?v=cJreObl1ZCs&feature=emb_logo
It is unlikely Parker will be that efficient at translating red zone opportunities into touchdowns in 2020. With the return of Preston Williams and further development of Mike Gesicki, there is reason to doubt Parker will garner even the same level of opportunity this year. Having said that, this is still a team projected to be among the top in the league in pass attempts with a consolidated target breakdown. Parker will still be a viable fantasy option, just don’t expect the same touchdown output.
Amari Cooper
In 2019, Amari Cooper exhibited extreme red zone prowess with six Red Zone Receptions turning into five touchdowns. Those six catches came on a relatively tiny 15.5-percent Red Zone Target Share. Of the 32 wide receivers who caught at least four red zone touchdowns, only four had a lower Red Zone Target Share. Three of those players appear on the earlier list of negative regression candidates.
https://www.youtube.com/watch?v=Zzj9xhwA8lI&feature=emb_title
Jason Witten left for Vegas which leaves his 17.2-percent Red Zone Target Share ready to be split along with another 14.5-percent for Randall Cobb, a fraction of which will go to Cooper. CeeDee Lamb joined the squad and Michael Gallup‘s emergence should continue, so projecting a large increase for Cooper’s targets would be a mistake. His 2.2 touchdowns over expectation though will be a challenge to replicate. It’s the difference between his low-end WR1 finish and a mid-WR2 rank.
Conclusion
Red Zone touchdowns are difficult to predict year to year. Instead of projecting touchdowns, it can be more effective to project stable opportunity metrics and see who outperformed expectations. We talked about three such wide receivers today going in the early to mid-rounds of seasonal fantasy football drafts that will underwhelm fantasy gamers if they are only looking at box score totals. Next time we’ll look at the other side of the coin and identify exciting targets who may see a positive mean reversion in the touchdown department.

