
Eric Edgar and George Chahouri recently broke open Quarterback Rating (QBR) and used more sticky metrics to replace raw touchdowns and interceptions. PlayerProfiler has been adjusting metrics based on supporting cast efficiency with True Completion Percentage and True Passer Rating, which factor out receiver drops and quarterback clock killing to better illuminate QB on-field performance. Then in 2017, the RotoUnderworld Team started tracking Money Throws and Interceptable Passes, providing an opportunity to enhance ESPN’s Total QBR metric to reflect how well quarterback’s threw the ball more independently to how well it was caught. Using the advanced stats, metrics, and analytics available in PlayerProfiler’s Data Analysis Tool, an Adjusted QBR is in sight.
Why Adjust QBR?
QBR is a standard formula with six separate parts/stages, and attempts to describe the performance of a quarterback. It uses completion percentage, yards per attempt and the touchdown to interception ratio per attempt. Since we know touchdowns and interceptions are the most volatile stats year to year, QBR can be improved. Since we only have one year of Money Throws and Interceptable Passes data, we can’t test how sticky it is.
In the meantime, it is possible to say that adjusting it to a more accurate description of what the metrics are telling us. Eric and George already laid out the how very well in their article. All that was left was to crack open the formula and insert the best metrics available in PlayerProfiler.com’s data analysis tool.
Adjusting QBR
Instead of using touchdowns and interceptions we can re-aligned QBR to focus on the performance of the player rather than the result of the play. “Money Throws” reward a player for having thrown the ball well, regardless of how the play worked out. In place of touchdowns, it will focus QBR more on the Quarterback, than the receiver and defense. Any variance caused by the receiver or defensive variance on an individual play level.
https://www.youtube.com/watch?v=vKv1dfwxTM8
We can do the same thing by changing out interceptions for Interceptable Passes. Again focusing on how well the player throws the ball, instead of how well it was caught. Next, we go a step further. By using True Completion Percentage we are including drops as catches, and throwaways as interceptions. This will combine PlayerProfiler.com’s True Passer Rating with our adjusted QBR. Finally, I used Adjusted Yards Per Attempt (AY/A) instead of standard Yards Per Attempt. This awards a bonus for touchdowns and a discount for interceptions. But only as they relate to the quarterback.
The Results
Remember the important changes are focusing the formula on the player, not the play. The adjusted QBR will discount high touchdowns numbers unless earned by a high proportion of quality throws. If a touchdown streak happened because the Quarterback was playing exceptionally well, he’ll get credit. It will not matter if a receiver made an adjustment, or the defense happened to make a good play.
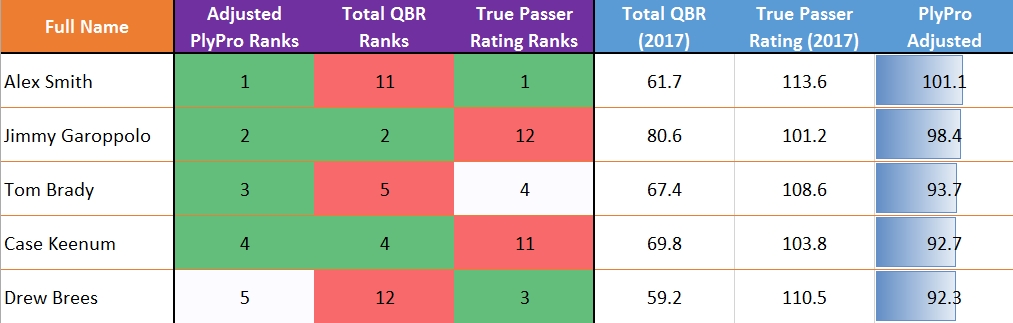
Top-5 Quarterbacks in Adjusted QBR
The adjusted formula use’s the same normalization method so it’s possible to compare the scores directly to each other (A perfect Adjusted QBR is the same as a normal QBR, 158.3). Here are the top-5 producers in the PlayerProfiler.com adjusted QBR compared to Total QBR and True Passer Rating.
Quarterbacks Rising
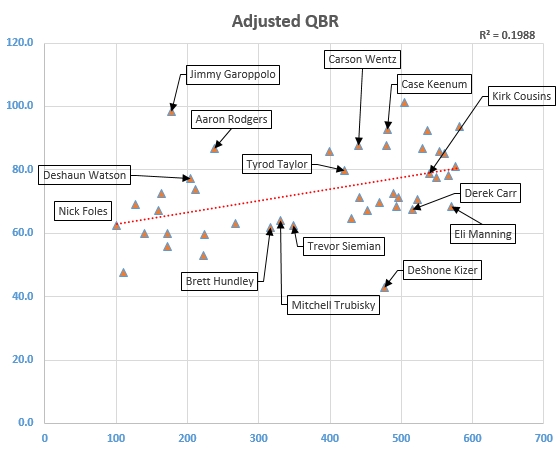
I admit I expected to drop all the small sample size quarterbacks. Jimmy Garoppolo should have fallen like a handsome stone dropped off a bridge. My plan was then to cackle like a madman in a dungeon full of the hopes and dreams of those who believed in small sample trends. True Passer Rating seemed to support this. But once Money Throws and Interceptable Passes were incorporated, he shot straight back to number 2. Even adjusted for his volume, Garoppolo performed very well in 2017.
Check out Jimmy Garoppolo on PlayerProfiler’s Updated Dynasty Rankings:

The Adjustment has a 4-percent higher relationship (R^2 of 1.9) than standard QBR (R^2 of 1.5). It’s fair to say that volume matters when considering quarterback ratings. In other words, sample size matters. But there’s no way to look at Jimmy Handsome Garoppolo’s 2017 and say he wasn’t good on the field.
Notable above and below average Names in Adjusted QBR
Adjusted QBR reclaims Drew Bress as an Elite player, and it also did well in identifying Case Keenum‘s season. Stefon Diggs and Adam Thielen certainly played a role, as did their schedule, but Keenum also played a role in Minnesota’s success.
Quarterbacks Dropping
Notable fallers include Deshaun Watson. His Touchdown dependent four-game stretch in 2017 did not help him with a quarterback rating that judges how well he threw the ball. Watson moves from No. 1 in Total QBR and No. 7 in True Passer rating, to No. 18 in the performance-focused adjusted QBR.
https://www.youtube.com/watch?v=2oSerQ4HKos
There’s a lot to unpack in the Adjusted QBR ranks list, including Dak Prescott falling from 6th in traditional QBR to 20th in adjusted QBR, which is interesting to say the least. As is Blake Bortles’ Drop from 15th to 24th. See full results here.
Conclusion
Adjusted QBR provides a clearer picture of how PlayerProfiler’s advanced stats, metrics, and analytics describe QB performances in 2017. While the predictive nature of this metrics is uncertain, even in a limit sample size, adjusted performance gives us a clear indication of how well a quarterback played, regardless of variance riddled stats like touchdowns and interceptions.

