
One of the more frustrating components of fantasy football involves shared backfields, especially when we expected a single running back to demand most of the touches and opportunities. We’re here to help in decoding split backfields. In hopes of doing so, we look at advanced metrics such as Snap Share, Opportunity Share, and Weighted Opportunities. To start, we’ll analyze the Arizona Cardinals backfield to look at what’s happening with Kenyan Drake and Chase Edmonds. Then, we’ll move to the Los Angeles Rams and their three-way running back carousel.
Arizona Cardinals – Kenyan Drake vs. Chase Edmonds
Coming into the 2020 draft season, Kenyan Drake held an FFPC ADP of 16.25, meaning fantasy managers drafted him in the first or second round of most leagues. However, through five weeks, Drake averages 13.3 (No. 24) Fantasy Points per Game and is currently underperforming based on expectations and ADP. Last week helped since he reached a season-high 28.4 (No. 2) fantasy points after scoring a 69-yard rushing touchdown to salt away the game. On the flip side, Chase Edmonds averages 10.4 (No. 34) Fantasy Points per Game and is closing in on Drake’s fantasy point totals with much fewer opportunities.
Opportunities
Kenyan Drake ranks middle of the pack with a 65.2-percent (No. 17) Snap Share and 69.8-percent (No. 11) Opportunity Share. Both metrics appear promising, but his 75.6 (No. 20) Weighted Opportunities provide reasons for concern since he lacks the passing game involvement. A reminder that Weighted Opportunities adjusts total opportunities by increasing the value of targets. Drake has drawn a whopping eight (No. 58) targets through six games, with two or fewer in each. After analyzing Drake’s Snap Share, Opportunity Share, and Weighted Opportunities, it potentially provides a buy-low opportunity. However, we also consider a sell-low scenario.
Check out Kenyan Drake on PlayerProfiler’s Updated Seasonal Rankings and Projections:

On the flip side, Chase Edmonds holds a 32.2-percent (No. 55) Snap Share, 30.2-percent (No. 52) Opportunity Share, and has recorded 53.7 (No. 32) Weighted Opportunities. With 25 targets (No. 12) compared to only eight for Drake, Edmonds receives the target volume. With the stock rising for Edmonds and the stock dropping for Drake, both look like intriguing players to acquire via trade. Edmonds provides more excitement while Drake raises more red flags, but Drake is possibly playing hurt with the preseason lower leg injury slowing him down.
Efficiency & Productivity
Next, let’s look at productivity and efficiency metrics for Kenyan Drake. Through six weeks, he has totaled 478 (No. 4) rushing yards, eight (No. 58) targets, and 22 (No. 77) receiving yards. The lack of targets and receiving production raises concerns, but Drake holds over 69-percent of the opportunities. Although it’s not what we expected, it begs the question of whether the lower leg injury in the preseason affected him. His -10.6 (No. 47) Production Premium and 4.5 (No. 38) Yards per Touch demonstrates the lack of efficiency, which isn’t surprising given the volume of touches and middle of the road production.
https://www.youtube.com/watch?v=7tf4k4YPM5c
Chase Edmonds has displayed more efficiency, with a +38.5 (No. 7) Production Premium and 5.9 (No. 6) Yards per Touch. Through six games, Edmonds has totaled 118 (No. 52) rushing yards, 135 (No. 17) receiving yards, 25 (No. 12) targets, and 19 (No. 12) receptions. Just when the hype train for Edmonds started rolling, Drake rushed for 164 yards and two touchdowns on Monday night. Given the Game Script, it’s not surprising that neither running back finished with much involvement in the passing game against the awful Cowboys defense.
Summary
When we analyze the touches, yards, and touchdowns for Kenyan Drake and Chase Edmonds, follow the opportunities and volume with Drake in hopes of the touchdowns and efficiency improving.
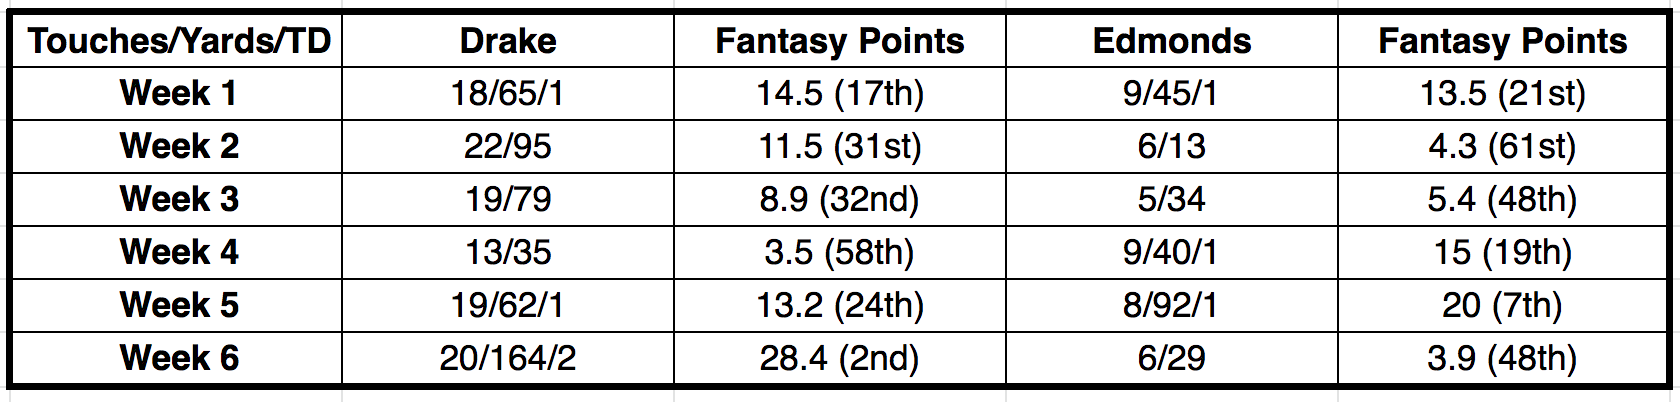
Kenyan Drake vs. Chase Edmonds Opportunities & Production
Overall, we noticed Drake trending down while Edmonds trended up in terms of fantasy points, with Week 6 as the exception. After the Week 6 explosion, sell high on Drake depending on the offer while also considering a buy-low opportunity with Edmonds.
The Los Angeles Rams Trio
The Los Angeles Rams have arguably one of the league’s more agonizing backfields since it’s split three ways. At least Arizona only primarily splits the touches between two running backs. However, the Rams play the hot hand and roll out Darrell Henderson, Malcolm Brown, and Cam Akers. We might as well let our pet turtle decide on which one to start because logic doesn’t appear to apply much here. The Rams average 31.3 (No. 6) Team Run Plays per Game, and typically that’s a positive note for running backs. However, when they split up these plays between three running backs, it messes things up for fantasy football purposes.
Darrell Henderson
Let’s start with Darrell Henderson since he exploded onto the scene over the last few games. Henderson has totaled a 36.5-percent (No. 45) Snap Share, 45.4-percent (No. 34) Opportunity Share, and 60.5 (No. 28) Weighted Opportunities. In Weeks 2-6, when he logged between a 34.5-percent and 52.6-percent Snap Share, he finished with three top-12 fantasy performances.
https://www.youtube.com/watch?v=jWxB3V7LYuk
Unfortunately, Henderson isn’t involved much in the passing game with only 11 (No. 44) targets, seven (No. 47) receptions, and 92 (No. 29) receiving yards. In terms of efficiency, he has a -1.3 (No. 34) Production Premium but averages 5.6 (No. 13) Yards per Touch. He averages 12.5 (No. 27) Fantasy Points per Game with 25 (No. 4) Red Zone Touches. The high-value touches have helped his fantasy production.
Malcolm Brown
The veteran Malcolm Brown leads the Rams with a 51.6-percent (No. 28) Snap Share and 61.3 (No. 27) Weighted Opportunities. Typically that provides reasons for hope moving forward, but Brown averages 8.6 (No. 40) Fantasy Points per Game since he shares touches. Outside of Week 1, where he finished with 26.0 (No. 5) fantasy points, he has only reached double-digit points once. Brown would be a running back to target via trade if the opportunities were split between two running backs instead of three. With 4.1 (No. 47) Yards per Touch and a -23.7 (No. 65) Production Premium, he also isn’t particularly explosive or efficient. He ranks last in the Rams backfield in terms of potential and upside.
Cam Akers
Rookie Cam Akers returned in Week 5 after a two-game absence due to injury and received the lowest Snap Share and Opportunity Share of the trio. Akers has logged an 18.3-percent (No. 86) Snap Share, 25.2-percent (No. 58) Opportunity Share, and 17.2 (No. 78) Weighted Opportunities. Granted, it’s not surprising to see the lower touches given the injuries and split backfield.
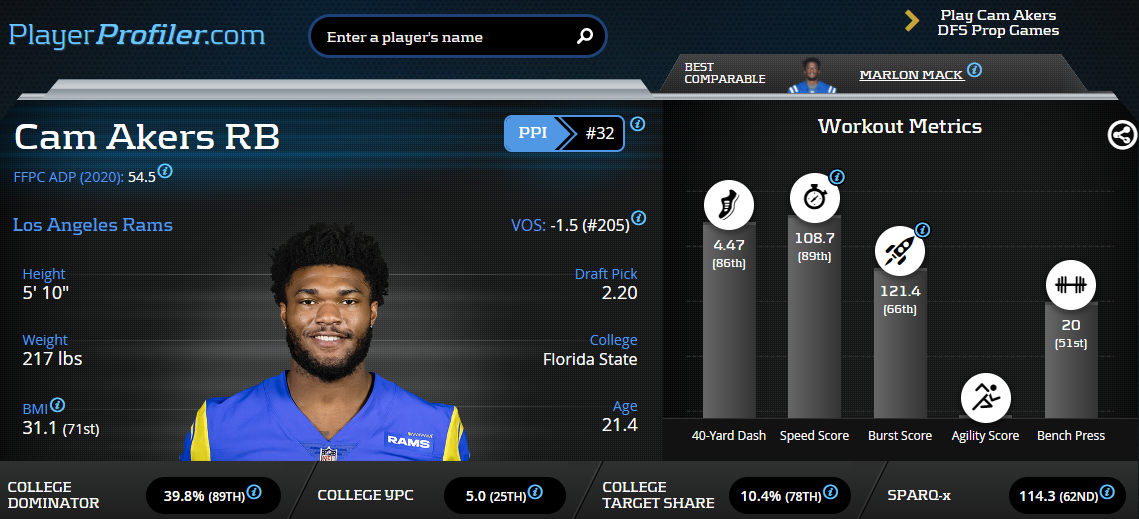
Cam Akers Advanced Stats & Metrics Profile
However, Akers’ NFL Draft profile provides reasons for hope moving forward. His collegiate profile includes a 39.8-percent (89th-percentile) College Dominator Rating, 10.4-percent (78th-percentile) College Target Share, and a 108.7 (89th-percentile) Speed Score.
Summary
As mentioned earlier, we might as well use our pet turtle to decide who to start when decoding this split backfield. Talent-wise, Cam Akers and Darrell Henderson should win out, but Sean McVay wants to use a split backfield. Last week, reports surfaced that Akers was expected to receive an increased workload, but he never even received a touch in Week 6. This provides hope for Henderson moving forward. Sure, Malcolm Brown can serve as a bye week replacement or deep-league Flex value on occasion, but it’s hard to feel confident in him producing on a week-to-week basis. At this point, the fantasy value for the Rams backfield ranks as follows – Henderson, Brown, and Akers, with Henderson providing the production and explosiveness. However, continue to stash Akers based on the talent and NFL Draft profile.

