
Our brains are extremely complex and can do some truly amazing things. Knowing this makes it all the more intriguing how easily our minds can be tricked into believing something that’s not necessarily rooted in the soundest of logic. There is perhaps no better example of this than the recency effect. This is the idea that individuals tend to remember things more clearly and put more weight in things that occurred more recently. Another phenomenon is one that just received a new name last year thanks to Rotoworld’s Rich Hribar: Take Lock. This is the idea that once we’ve formulated an incorrect opinion, exposure to data that signifies we were wrong either doesn’t change what we think or makes us even more likely to stubbornly maintain the same misguided thought process.
Knowing these mind tricks exist, it’s important to accept we have all fallen victim to them on numerous occasions. However, admitting this is not accepting defeat in any way shape or form. On the contrary actually. Coming to terms with our imperfections allows us to more freely constantly challenge what we believe and why we believe it. Doing this is going to give us a leg up on the competition because our minds don’t have to be perfect, they just have to fall for fewer tricks than the rest of the players in our leagues. Thus, when you hear an analyst say to attack recency bias and regression back to the mean, what they’re really saying is to attack the incorrect perceptions of your league mates. Rather than just having a pissing contest on Twitter, this strategy can actually be executed by taking advantage of market inefficiencies in ADP and underinformed perceptions of players/teams in trade negotiations. Putting these ideas into action can be easier than one might think as well due to the majority of individuals struggling to separate their perceptions from reality. After all, what they believe is DEFINITELY going to happen, right?
In order to do this, though, we have to put in the work. You’re doing that now by reading this article, which is good because I believe I’ve found some solid data on A.J. Green that suggests he is a strong BUY yet again in 2017.
Air Yards and Other Advanced Metrics
Josh Hermsmeyer has done a lot of great work on RotoViz showing how Air Yards are predictive of future success from year to year. I wanted to delve into the world of air yards and target distance myself using PlayerProfiler’s Data Analysis Tool. PlayerProfiler’s new “target distance” metric measures average target depth, and target distance multiplied by total targets provides total target depth, which is intellectually equivalent to Hermsmeyer’s completed plus incomplete air yards. I’ll be discussing air yards, target distance, and total target depth. Here’s a nomenclature key to get started:
- Air Yards = Completed Air Yards
- Target Distance = Average Target Depth
- Total Target Depth = Target Distance X Total Targets
A.J. Green’s 2016 Season In Review
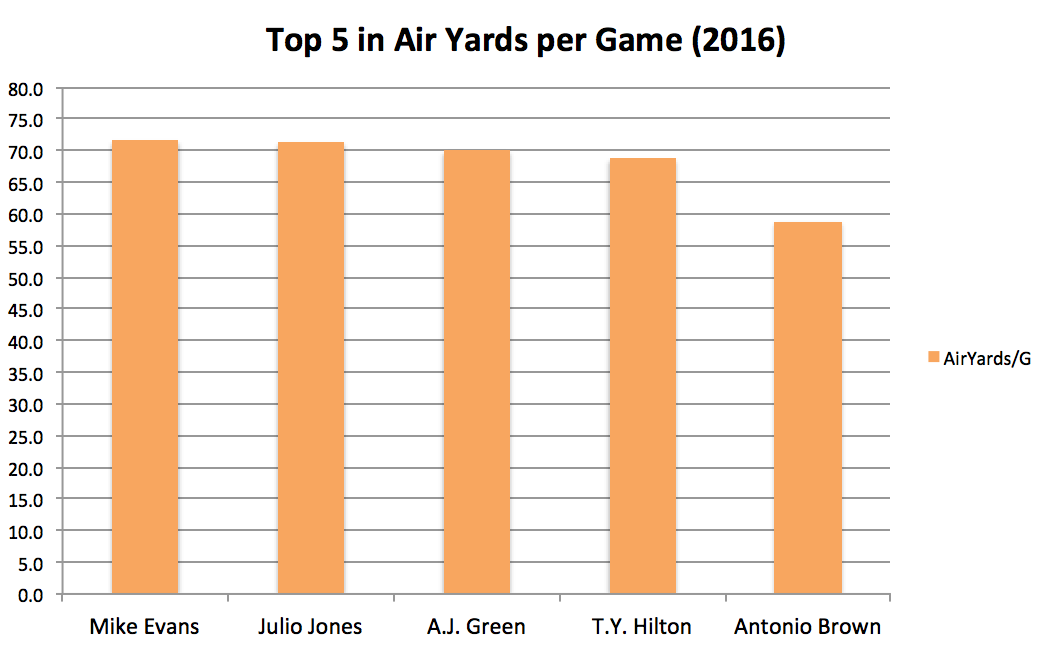
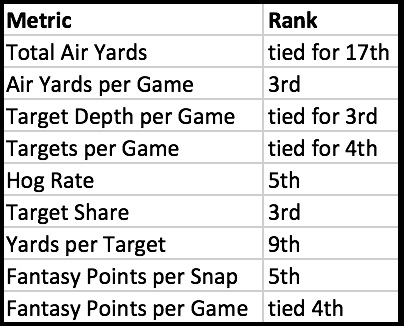
So what do these advanced metrics tell us about A.J. Green‘s 2016 season? The first thing that jumped out at me and what ultimately gave me the idea to write this article in the first place was Green’s Air Yards. Green finished tied for 17th in total Air Yards (700) on the season while only playing in 10 games. Mind boggling. Even better, using a sample of the top 25 players in total Air Yards, Green ranked 3rd in Air Yards per game (70).
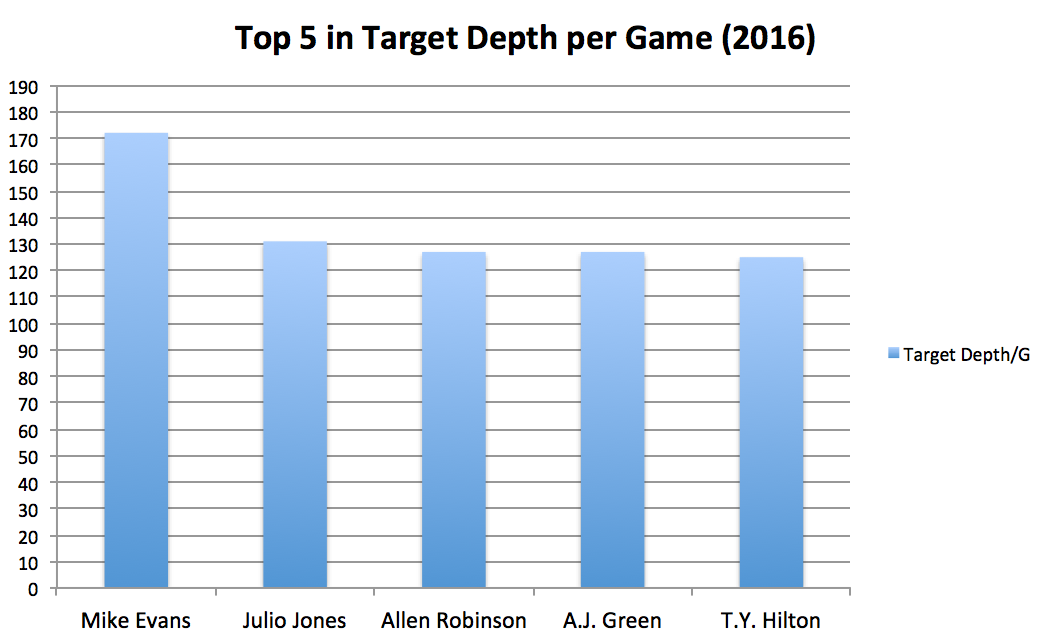
A.J. Green‘s Target Distance was 12.7. Multiplying that by the 100 targets he saw last season, we get a Total Target Depth of 1,270. This number doesn’t look as impressive as the Air Yards stat when compared to the rest of the field. Remember, though, that shouldn’t be surprising since we are now incorporating incomplete Air Yards as well as completed Air Yards. Incorporating more season-long data into a statistic is naturally going to favor those that played the most games. However, when adjusting for amount of games played, Green tied for 3rd with Allen Robinson in Target Depth per game (127) behind only Mike Evans and Julio Jones when using the sample mentioned in the previous paragraph.
These statistics are super fun to play around with and quite possibly could become the new norm when it comes to measuring WR opportunity. With that in mind, I wanted to see how they compared to some more currently widely accepted WR opportunity measurements. Understanding that Air Yards, Target Distance, and Total Target Depth are supposed to be predictive of fantasy success, my theory was they would correlate well with other statistics. Let’s take a look at how it played out:
A.J. Green averaged 10 targets per game which tied him for 4th in that category. In fact, Green was one of only five players to average double-digit targets per game. The others were Mike Evans (10.7), Odell Beckham (10.6), Antonio Brown (10.3), and Julian Edelman (10). Not surprisingly, Green also finished highly (5th) in Player Profiler’s Hog Rate (18%), which measures targets per snap. Also, in terms of percentage of team targets, Green saw a 28.7% target share. He finished 3rd in that category and was one of only five players to see a target share above 28%. The others were Mike Evans (30%), Julian Edelman (29.3%), Odell Beckham (28.3%), and Jarvis Landry (28.1%).
A.J. Green Advanced Stats & Metrics Profile
A.J. Green also finished 9th in yards per target, which likely helps explain why his Air Yards numbers were so impressive. Ultimately, though, fantasy points are what we’re looking for. Green delivered on a per game basis in that all-important category as well. He finished 5th in fantasy points per snap (0.34) and tied for 4th in fantasy points per game (18.6) with Julio Jones and Odell Beckham behind only Antonio Brown (20.5), Jordy Nelson (19.1), and Mike Evans (18.8). As expected, Player Profiler’s Air Yards data correlated well with all of these other statistics and did a good job showing how successful Green’s 2016 season was when he was on the field. Here’s a summarization:
AJ Green 2016 Statistical Summary
Zooming Out
Now let’s compare A.J. Green‘s successful 2016 season to the rest of his career:
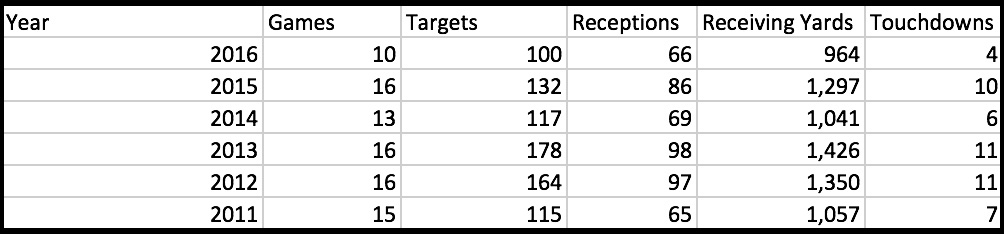
AJ Green Career Stats Summary
As the table shows, A.J. Green‘s 2016 data is consistent with the rest of his career meaning last season was not a fluke. In fact, it’s easy to see where Green’s season totals were headed had he stayed healthy. This is your friendly reminder Green has caught double-digit TDs in every season he has played all sixteen games. Simply put, when Green has been on the field, he has consistently produced his entire career and there is zero evidence that’s going to change next season.
A.J. Green vs. Mike Evans
Entering 2017, everyone is talking about Mike Evans. However, not much has been mentioned about A.J. Green. Why is that? Well, it’s likely because Green missed the final six games of the 2016 season whereas Evans played in all sixteen games. Even though it is extremely slight, recency bias is playing a role in early 2017 drafts. A year ago, Green was going off the board at 1.06 according to FantasyFootballCalculator.com (FFC). However, despite Green doing absolutely nothing to decrease his value last season while on the field, he’s now going off the board at 1.09 in early drafts according to FFC. Yes, a new trio of workhorse RBs rule the beginning of fantasy drafts now. Still, Evans, who currently has an ADP of 1.08 on FFC, is also driving down Green’s ADP. Thanks to Josh Hornsby, we can see this trend in early MFL10 ADP as well:
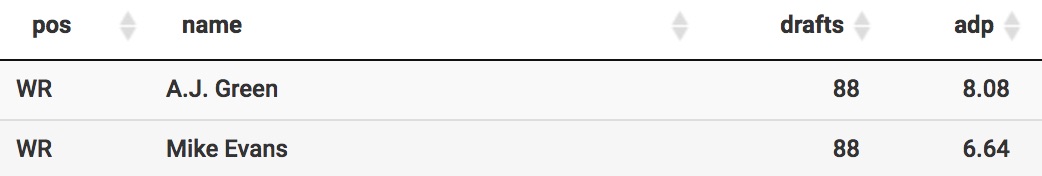
AJ Green and Mike Evans Early Average Draft Position
Looking at the numbers for both players from last season, it’s easy to see why A.J. Green and Mike Evans are being drafted so close together:

AJ Green vs. Mike Evans 2016 Season Stats
As you can see, A.J. Green compared extremely favorably to Mike Evans on a per game basis in 2016. In fact, Green actually outproduced Evans in Yards After Catch (YAC) on the season despite playing six fewer games and catching thirty fewer passes. When adjusting for games played, Evans doesn’t even come close to Green in that department. This begs the question, would Evans still be getting drafted higher on average if he was the one that got injured last season instead of Green? It’s fair to wonder. While the majority of fantasy football players will draft Evans over Green in 2017 without much hesitation due to groupthink somewhat formulated by recency bias, I’m here to tell you to confront those tricks being played on your brain. Now, I’m not necessarily telling you to draft Green over Evans. That’s for you to decide. However, I am saying it would be wise to re-evaluate the logic behind your decision before you make it. Is this a situation where “Take Lock” is warranted?
Conclusion
A.J. Green is a stud WR1 in the prime of his career as he will only be 29 during the entirety of the 2017 season. Player Profiler Air Yards, Target Distance, and Total Target Depth are just the latest advanced metrics that verify this belief. Make sure you have some exposure to Green this season, and if you’re able to get it by grabbing him at 1.09, brush that dirt off your shoulder while laughing all the way to the bank because you, my friend, just took advantage of a market inefficiency. That’s how you win leagues. You’re welcome.

