
We’ve all heard it before. The No. 1 rule of fantasy football is to know your league settings. Seemingly subtle differences such as 0.5 vs 1-pt PPR or an extra FLEX spot on the roster can add up to massive advantages to managers who tailor their strategy to the format they are drafting for. When it comes to drafting on sites with differing settings, the ADPs on each site reflect the strategy differences needed to succeed. Additionally, these ADP variations affect values of individual players. In this article, I’ll illustrate the ADP comparison between Underdog and the Fantasy Football World Championship (FFWC). We’ll examine how these differences can be leveraged in order to draft structurally strong teams in high-stakes leagues on FFWC and in best ball leagues on Underdog.
Structural Differences
First, let’s talk about the structural differences. Since Underdog leagues are best ball, every team typically drafts two-three QBs and two-three TEs. Meanwhile, FFWC leagues are redraft. This means managers should draft one or two quarterbacks and one or two tight ends. If you draft someone in the top-eight quarterbacks or tight ends, you’ll probably be fine with just one of each position. The resulting effect from these differences is a drastic change in QB and TE ADPs. You need to draft them much earlier in Underdog than FFWC. Conversely, if you typically draft in best ball leagues like Underdog, but are new to high-stakes redraft leagues, make sure not to rush into drafting a quarterback and/or tight end.
ADP Comparison
The other side of this structural coin is higher ADPs for running backs and wide receivers. On FFWC, there are two flex spots in the starting lineup compared to only one on Underdog. This results in one more running back or wide receiver entering each team’s lineup every week. This makes these positions even more valuable in FFWC drafts. To illustrate this, let’s look at an ADP comparison or the average difference in ADP by position across Underdog and FFWC. For the purposes of this exercise, we’ll focus on players in the top-200 for both sites due to slightly different handling of ADP data beyond 200.
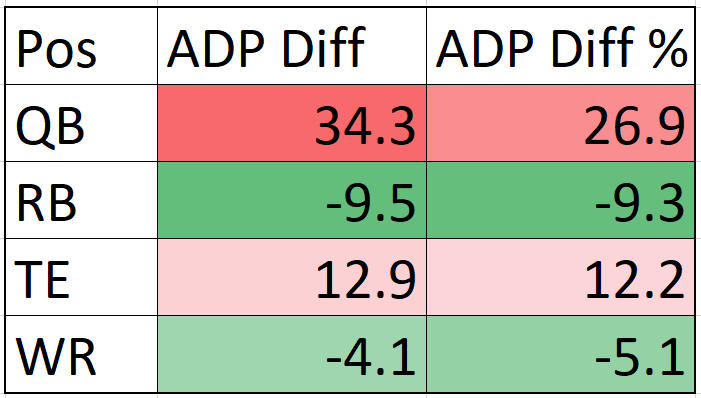
This chart tells us the difference between ADP’s by position in average picks. It also shows a percentage of pick value. Using percentages helps to normalize for the fact that higher picks are more valuable (i.e. the difference between picks 10 and 20 overall is more valuable than the difference between picks 100 and 110). Both calculations still bear out the trends we expected to see. They show serious devaluations of the “onesie” positions and a higher FFWC ADP for running backs and wide receivers.
Visualization
Another way to visualize this positional ADP gap across sites is to look at the difference within each position across the length of the draft board. In the following graph, you can see the trend within each position become more extreme as the draft plays out. The x-axis represents the Underdog ADP. The y-axis displays the difference between ADPs. A positive number indicates that a player has a higher ADP on FFWC.
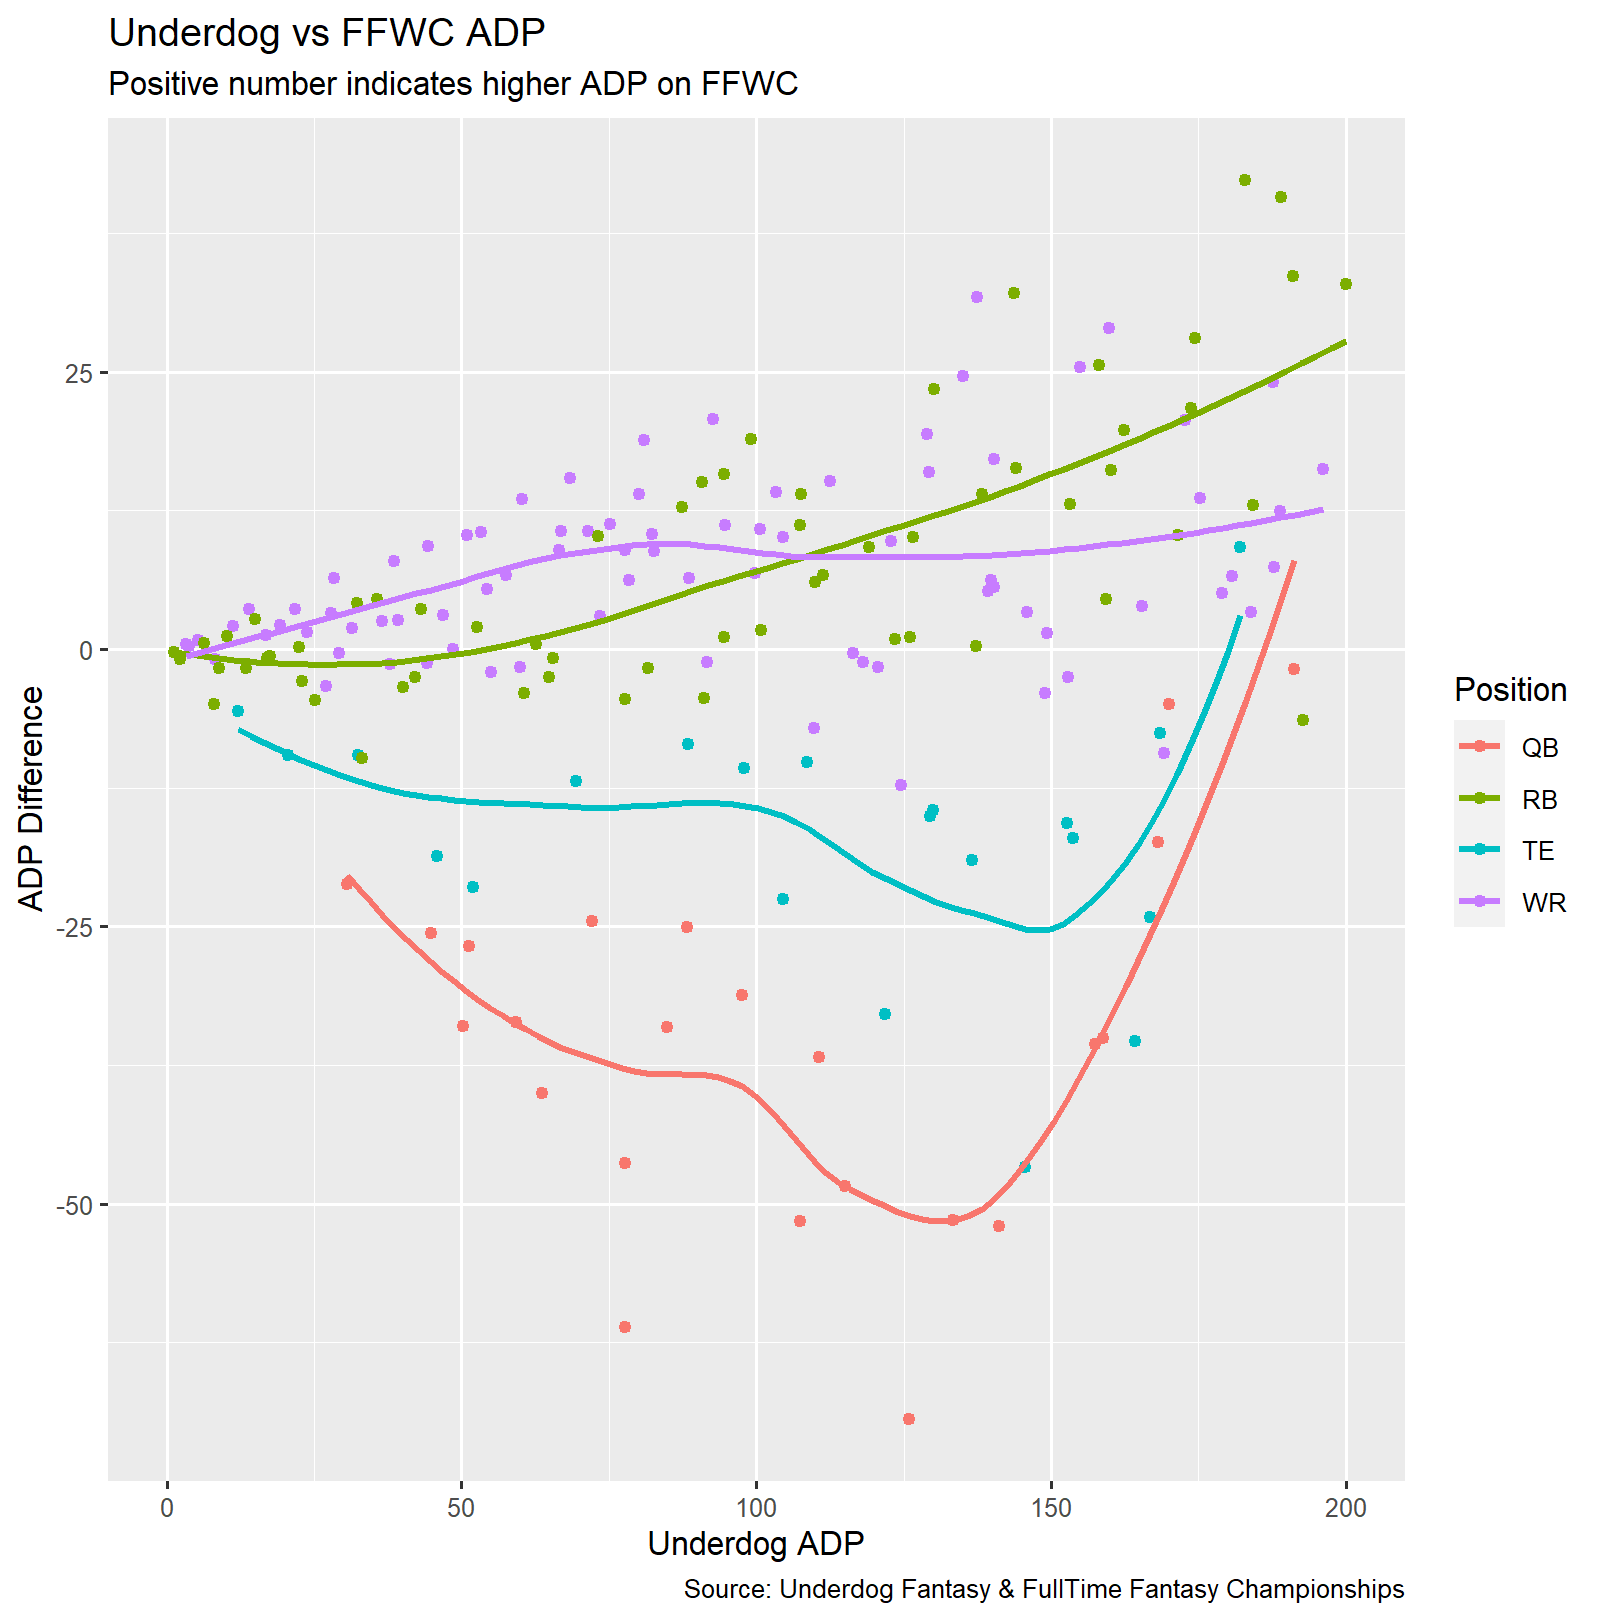
This graph allows us to analyze the ADP differences over the course of a draft. It allows fantasy gamers to analyze these differences with even more nuance than the pick differentials. We can still clearly see the devaluation of quarterback and tight end at the expense of running back and wide receiver. More importantly, we can see the pockets of the draft where fantasy gamers run the risk of overpaying more severely at a given position. Even though running backs are gaining more value than wide receivers in average pick differential, we can see that wide receivers are valued more highly in the top-100 picks of the draft. The running backs end up with a higher average pick differential due to a continued rise in picks 100-200 while the wide receiver trendline flattens out.
Quarterback and Tight End Trends
Another trend that presents itself by viewing the data this way is the upward shift for quarterbacks and tight ends after pick 150. This is explained by the fact that getting a second quality starter at these positions is extremely valuable on Underdog. Quarterbacks like Derek Carr and Kirk Cousins are prime examples of this. They’re much more desirable in a best ball format where you cannot stream the position. Their ADPs are 51 and 48 picks later on FFWC compared to Underdog, respectively. This trend is seen again with the comparable tier we see at tight end this year. Names such as Hunter Henry, Irv Smith, and Tyler Higbee represent this tier. After these tiers of desirable secondary players at both the “onesie” positions, we see the difference fall back toward zero. This is because QB20+ and TE20+ are not particularly desirable regardless of format.
Conclusion
If you take one lesson away from this article, it should be that your approach to quarterback and wide receiver needs to change drastically when alternating between drafting these two sites. If you’re going from Underdog to FFWC, be prepared to go all-in on wide receivers to keep pace with the draft room. Also, don’t bite too early on a value at quarterback. On the flip side, going from FFWC to Underdog, make sure to get two good quarterbacks much earlier than you’re used to. Don’t let the ADPs scare you off of the elite tier.
Now that we understand these macro-level trends, look out for my follow-up piece with which players provide opportunities for arbitrage between the two sites. It’s August, which means peak fantasy football is upon us. Hop in some drafts and enjoy the greatest game on Earth!

