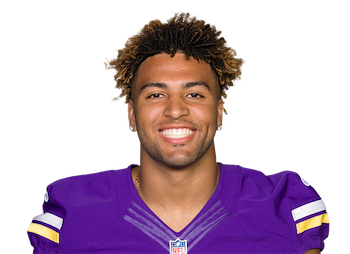
Irv Smith
- Height
- 6' 2"
- Weight
- 242 lbs
- Arm Length
- 31 1/2" (8th)

- Draft Pick
- 2.18 2019
- College
- Alabama
- Age
- 24.4
Workout Metrics
Irv Smith Bio & Season Stats
Year Year | Games Played Games | Targets Tgts | Receptions Rec | Receiving Yards Rec Yds | Yards Per Reception YPR | Air Yards Air Yds | Receiving TDs Rec TD | Fantasy Points Per Game Fantasy Pts/Game |
---|---|---|---|---|---|---|---|---|
2022 | 8 | 36 | 25 | 182 | 7.3 | 173 | 2 | 6.9 |
2020 | 13 | 43 | 30 | 365 | 12.2 | 355 | 5 | 7.6 (#22) |
2019 | 14 | 47 | 36 | 311 | 8.6 | 289 | 2 | 5.6 (#33) |
-
College Dominator14.0% (38th)
-
College YPR16.1 (89th)
-
Breakout Age-
-
SPARQ-x108.9 (60th)
Irv Smith Advanced Stats & Metrics
Targets | Target Share | Target Rate | Snap Share | Slot Snaps | Routes Run | Route Participation Route % |
---|---|---|---|---|---|---|
36 (4.5 p/g) | 13.4% (14.0% rz) | 22.1% | 52.5% | 48 (17.9% rate) | 163 (20.4 p/g) | 54.7% |
#39 | - | - | #36 | #50 | #46 | - |
Air Yards | Air Yards Share | Average Target Distance (ADOT) Target Depth (ADOT) | Deep Targets | Red Zone Targets Red Zone Tgts | Target Quality Rating | Catchable Target Rate |
---|---|---|---|---|---|---|
173 (21.6 p/g) | 8.6% | 4.8 | 1 (0.1 p/g) | 7 (5 rec) | 4.42 | 75.0% (27 tgts) |
- | - | - | #48 | #28 | - | - |
Receptions Recs | Receiving Yards Rec Yards | Yards After Catch YAC | Unrealized Air Yards | Total TDs | Fantasy Points Per Game Fantasy Pts/Game | Expected Fantasy Points Per Game Expected Fantasy Pts/Game |
---|---|---|---|---|---|---|
25 (3.1 p/g) | 182 (22.8 p/g) | 89 (2.5 p/tgt) | 80 (2.2 p/tgt) | 2 (8.0% rate) | 6.9 | 7.3 (-0.40 diff) |
#39 | #46 | #49 | #42 | #32 | - | #22 |
Target Accuracy | Yards Per Route Run | Formation Adjusted Yards Per Route Run Formation Adjusted YPRR | Yards Per Target YPT | Yards Per Reception YPR | Yards Per Team Pass Attempt Yards/Team Pass Attempt | True Catch Rate |
---|---|---|---|---|---|---|
8.1 | 1.12 | - | 5.1 | 7.3 | 0.61 | 92.6% (69.4% actual) |
- | - | - | - | - | - | - |
Target Separation | Average Cushion | Target Premium | Dominator Rating | Juke Rate | Drops | Contested Catch Rate Contested Catch % |
---|---|---|---|---|---|---|
2.67 | 2.48 | -15.5% | 12.8% | 8.0% | 3 (8.3% rate) | 40.0% (5 tgts) |
- | - | - | - | - | #14 | - |
Production Premium | Expected Points Added (EPA) EPA | QB Rating Per Target QB Rating Per Target | Best Ball Points Added Best Ball Pts Added | Fantasy Points Per Route Run Fantasy Points Per Route | Fantasy Points Per Target Fantasy Points Per Target | Total Fantasy Points Total Fantasy Pts |
---|---|---|---|---|---|---|
-5.8 | +4.4 | 88.0 | 5.2 (0.7 p/g) | 0.34 | 1.53 | 55.20 |
- | #58 | - | #43 | - | - | #43 |
Targets | Target Share | Target Rate | Snap Share | Slot Snaps | Routes Run | Route Participation Route % |
---|---|---|---|---|---|---|
43 (3.3 p/g) | 12.0% (25.5% rz) | 15.0% | 64.5% | 78 (15.0% rate) | 286 (22.0 p/g) | 73.0% |
#34 | #22 | #36 | #23 | #33 | #27 | - |
Air Yards | Air Yards Share | Average Target Distance (ADOT) Target Depth (ADOT) | Deep Targets | Red Zone Targets Red Zone Tgts | Target Quality Rating | Catchable Target Rate |
---|---|---|---|---|---|---|
355 (27.3 p/g) | 11.7% | 8.3 | 7 (0.5 p/g) | 12 (8 rec) | 5.98 | 86.0% (37 tgts) |
#29 | #21 | #11 | #13 | #16 | #7 | #8 |
Receptions Recs | Receiving Yards Rec Yards | Yards After Catch YAC | Unrealized Air Yards | Total TDs | Fantasy Points Per Game Fantasy Pts/Game | Expected Fantasy Points Per Game Expected Fantasy Pts/Game |
---|---|---|---|---|---|---|
30 (2.3 p/g) | 365 (28.1 p/g) | 129 (3.0 p/tgt) | 119 (2.8 p/tgt) | 5 (16.7% rate) | 7.6 | 7.2 (+0.20 diff) |
#31 | #27 | #32 | #35 | #13 | #22 | - |
Target Accuracy | Yards Per Route Run | Formation Adjusted Yards Per Route Run Formation Adjusted YPRR | Yards Per Target YPT | Yards Per Reception YPR | Yards Per Team Pass Attempt Yards/Team Pass Attempt | True Catch Rate |
---|---|---|---|---|---|---|
129.0 | 1.28 | - | 8.5 | 12.2 | 0.71 | 81.1% (69.8% actual) |
#31 | #24 | - | #8 | #8 | #27 | #33 |
Target Separation | Average Cushion | Target Premium | Dominator Rating | Juke Rate | Drops | Contested Catch Rate Contested Catch % |
---|---|---|---|---|---|---|
1.62 | 1.15 | +10.3% | 14.8% | - | 2 (4.7% rate) | 37.5% (8 tgts) |
#19 | #37 | #37 | #23 | - | #28 | #27 |
Production Premium | Expected Points Added (EPA) EPA | QB Rating Per Target QB Rating Per Target | Best Ball Points Added Best Ball Pts Added | Fantasy Points Per Route Run Fantasy Points Per Route | Fantasy Points Per Target Fantasy Points Per Target | Total Fantasy Points Total Fantasy Pts |
---|---|---|---|---|---|---|
+9.5 | +26.3 | 134.4 | 22.9 (1.8 p/g) | 0.34 | 2.29 | 98.50 |
#24 | #9 | #2 | #16 | #21 | #2 | #22 |
Targets | Target Share | Target Rate | Snap Share | Slot Snaps | Routes Run | Route Participation Route % |
---|---|---|---|---|---|---|
47 (3.4 p/g) | 11.4% (20.8% rz) | 19.3% | 61.7% | 162 (31.5% rate) | 243 (17.4 p/g) | 56.6% |
#30 | #25 | #78 | #34 | #12 | #25 | #20 |
Air Yards | Air Yards Share | Average Target Distance (ADOT) Target Depth (ADOT) | Deep Targets | Red Zone Targets Red Zone Tgts | Target Quality Rating | Catchable Target Rate |
---|---|---|---|---|---|---|
289 (20.6 p/g) | 8.0% | 6.2 | 5 (0.4 p/g) | 10 (7 rec) | 5.35 | 87.2% (41 tgts) |
#31 | #34 | #31 | #21 | #20 | #21 | #11 |
Receptions Recs | Receiving Yards Rec Yards | Yards After Catch YAC | Unrealized Air Yards | Total TDs | Fantasy Points Per Game Fantasy Pts/Game | Expected Fantasy Points Per Game Expected Fantasy Pts/Game |
---|---|---|---|---|---|---|
36 (2.6 p/g) | 311 (22.2 p/g) | 119 (2.5 p/tgt) | 97 (2.1 p/tgt) | 2 (5.6% rate) | 5.6 | - |
#23 | #33 | #34 | #41 | #33 | #33 | - |
Target Accuracy | Yards Per Route Run | Formation Adjusted Yards Per Route Run Formation Adjusted YPRR | Yards Per Target YPT | Yards Per Reception YPR | Yards Per Team Pass Attempt Yards/Team Pass Attempt | True Catch Rate |
---|---|---|---|---|---|---|
7.7 | 1.28 | - | 6.6 | 8.6 | 0.73 | 87.8% (76.6% actual) |
#15 | #35 | - | #28 | #34 | #31 | #8 |
Target Separation | Average Cushion | Target Premium | Dominator Rating | Juke Rate | Drops | Contested Catch Rate Contested Catch % |
---|---|---|---|---|---|---|
1.77 | 2.24 | -19.2% | 9.0% | - | 2 (4.3% rate) | 80.0% (5 tgts) |
#13 | #12 | #35 | #51 | - | #27 | - |
Production Premium | Expected Points Added (EPA) EPA | QB Rating Per Target QB Rating Per Target | Best Ball Points Added Best Ball Pts Added | Fantasy Points Per Route Run Fantasy Points Per Route | Fantasy Points Per Target Fantasy Points Per Target | Total Fantasy Points Total Fantasy Pts |
---|---|---|---|---|---|---|
-6.6 | +8.2 | 107.7 | 0.0 (0.0 p/g) | 0.33 | 1.68 | 79.10 |
- | #32 | #17 | #55 | #31 | #18 | #33 |
Week Wk | Opponent Opp | Snap Share Snap Share | Routes Routes | Targets Targets | Receptions Receptions | Receiving Yards Receiving Yards | Fantasy Points Fantasy Points |
---|---|---|---|---|---|---|---|
1 | GB | 27.6% | 11 (33.3% rate) | 2 (1 rz) | 0 | 0 (3 air) | 0.0 (#56) |
2 | PHI | 56.9% | 28 (58.3% rate) | 8 (1 rz) | 5 (1 tds) | 36 (63 air) | 14.6 (#4) |
3 | DET | 50.7% | 25 (59.5% rate) | 6 (1 rz) | 2 | 32 (34 air) | 5.2 (#29) |
4 | NO | 64.6% | 24 (58.5% rate) | 4 (1 rz) | 3 | 23 (26 air) | 5.3 (#31) |
5 | CHI | 60.8% | 30 (69.8% rate) | 5 | 4 | 42 (25 air) | 8.2 (#17) |
6 | MIA | 69.4% | 18 (54.6% rate) | 4 (1 rz) | 4 (1 tds) | 7 (-2 air) | 10.7 (#13) |
8 | ARI | 47.1% | 19 (48.7% rate) | 4 (1 rz) | 4 | 28 (15 air) | 6.8 (#22) |
18 | CHI | 45.1% | 8 (24.2% rate) | 3 (1 rz) | 3 | 14 (9 air) | 4.4 (#33) |
19 | NYG | 7.1% | 3 (7.5% rate) | 2 (1 rz) | 1 (1 tds) | 3 (11 air) | 7.3 (#12) |
Week Wk | Opponent Opp | Snap Share Snap Share | Routes Routes | Targets Targets | Receptions Receptions | Receiving Yards Receiving Yards | Fantasy Points Fantasy Points |
---|---|---|---|---|---|---|---|
1 | GB | 57.7% | 16 | 1 | 1 | 11 (11 air) | 2.1 (#44) |
2 | IND | 60.4% | 17 | 4 | 1 | 3 (22 air) | 1.3 (#49) |
3 | TEN | 54.0% | 17 | 0 | 0 | 0 | 0.0 (#57) |
4 | HOU | 61.5% | 12 | 1 (1 rz) | 0 | 0 (20 air) | 0.0 (#58) |
5 | SEA | 69.9% | 31 | 5 (1 rz) | 4 | 64 (53 air) | 10.4 (#12) |
6 | ATL | 76.9% | 31 | 5 (2 rz) | 4 | 55 (30 air) | 11.5 (#11) |
8 | GB | 77.6% | 12 | 1 | 1 | 16 (7 air) | 2.6 (#35) |
9 | DET | 41.8% | 10 | 4 (2 rz) | 2 (2 tds) | 10 (17 air) | 15.0 (#4) |
11 | DAL | 52.5% | 21 | 2 | 2 | 23 (11 air) | 4.3 (#34) |
14 | TB | 39.0% | 18 | 4 (1 rz) | 4 (1 tds) | 63 (43 air) | 16.3 (#3) |
15 | CHI | 84.8% | 35 | 4 (1 rz) | 3 | 37 (22 air) | 6.7 (#26) |
16 | NO | 86.9% | 36 | 9 (4 rz) | 6 (2 tds) | 53 (73 air) | 23.3 (#1) |
17 | DET | 77.0% | 30 | 3 | 2 | 30 (46 air) | 5.0 (#26) |
Week Wk | Opponent Opp | Snap Share Snap Share | Routes Routes | Targets Targets | Receptions Receptions | Receiving Yards Receiving Yards | Fantasy Points Fantasy Points |
---|---|---|---|---|---|---|---|
2 | GB | 40.7% | 10 | 2 | 1 | -1 | 0.9 (##54) |
3 | OAK | 49.2% | 8 | 3 | 3 | 60 | 9.0 (##16) |
4 | CHI | 53.8% | 13 | 1 | 1 | 5 | 1.5 (##51) |
6 | PHI | 50.0% | 8 | 2 (1 rz) | 2 | 29 | 4.9 (##26) |
7 | DET | 54.9% | 19 | 6 (1 rz) | 5 | 60 | 11.0 (##11) |
8 | WAS | 70.3% | 16 | 3 | 3 | 21 | 5.1 (##21) |
9 | KC | 61.5% | 24 | 6 (2 rz) | 4 | 33 | 7.3 (##19) |
10 | DAL | 70.6% | 22 | 6 (2 rz) | 5 | 34 | 8.4 (##18) |
11 | DEN | 94.3% | 34 | 3 (1 rz) | 3 (1 tds) | 20 | 11.0 (##13) |
13 | SEA | 82.7% | 29 | 3 | 1 | 6 | 1.6 (##49) |
14 | DET | 72.5% | 22 | 4 (1 rz) | 3 | 21 | 5.1 (##34) |
15 | LAC | 56.5% | 13 | 3 (1 rz) | 2 (1 tds) | 8 | 8.8 (##14) |
16 | GB | 62.5% | 19 | 3 | 2 | 4 | 2.4 (##51) |
17 | CHI | 44.7% | 6 | 2 (1 rz) | 1 | 11 | 2.1 (##36) |
Stock Prices

Stock Prices

Value Over Stream
(VOS)Value Over Stream: Valuation scheme calculates a player’s fantasy pts/game over the average waiver wire replacement in standard fantasy league formats during either the current season (or previous year during the offseason) and adjusts for positional bust rates. VOS rank in parenthesis spans all positions, enabling player comparisons across QB's, RB's, WR's, and TE's.
Snap Share
Target Share
Fantasy Points
Snap Share
Target Share
Fantasy Points
Irv Smith Injury History
Year Year | Games Games | Receptions Recs | Receiving Yards Rec Yds | Target Share Tgt Share | Catch Rate Catch Rate | Receiving Touchdowns Rec TDs | Special Teams Yards Special Teams | Age Age | School School |
---|---|---|---|---|---|---|---|---|---|
2017 | 9 (TE) | 14 | 128 (9.1 ypr) | - | - | 3 | 0 | 19 | Alabama |
2018 | 15 (TE) | 44 (61 tgts) | 710 (16.1 ypr) | 13.9% | - | 7 | 0 | 20 | Alabama |
Who is Irv Smith
In Irv Smith’s first two seasons, he was in the shadow of Kyle Rudolph and was the Vikings’ TE2. He saw small upticks in opportunity and production from year 1 to year 2, such as snap share going up from 61.7% to 64.5% and air yards going from 289 to 355. These numbers alone are not enough to draw interest in fantasy, but Rudolph departed in free agency in 2021 which opened the door for Smith to break out. In the stretch of four games which Rudolph missed in 2020, Smith averaged 12.8 PPR points. Despite being a secondary weapon in 2020, he still saw 7 deep targets and he only had 2 drops.
While underlying numbers such as his 1.28 yards per route run and his contested catch rate of 37.5% are not indicative of a diamond in the rough, there remains hope that Smith will produce with greater opportunity. He didn’t see the field in 2021 due to a preseason meniscus tear, but Tyler Conklin did little to steal his job in his absence. Smith is going into a contract year in 2022, as he will be a free agent in the 2023 offseason. His Underdog early best ball ADP is currently 151.4, where he is the 18th tight end off the board. That could rise after Conklin jetted his way to New York.