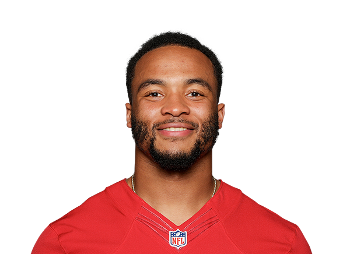

Pierre Strong Athleticism
Pierre Strong Season Stats
Pierre Strong Explosive Plays
Explosive Play Rating (EPX) is a comprehensive rating of a player's explosiveness, factoring in per-play efficiency and total volume of explosive plays created. EPX is scaled so 100 is league-average at each position and blends passing, rushing, and receiving according to each player's usage. Pass plays over 20 yards or rush plays over 10 yards are considered explosive.

Pierre Strong Advanced Stats & Metrics
| Week Wk | Opponent Opp | Snap Share Snap Share | Carries Carries | Routes Routes | Targets Targets | Receptions Receptions | Total Yards Total Yards | Total TDs Total TDs | Fantasy Points Fantasy Points |
|---|---|---|---|---|---|---|---|---|---|
| 1 | DAL | 23.7% | 2 | 14 (27.5% rate) | 3 | 2 | 30 | 0 | 5.0 (#43) |
| 2 | JAX | 15.5% | 1 | 9 (25.0% rate) | 2 | 1 | 5 | 0 | 1.5 (#66) |
| 5 | WAS | 8.1% | 1 | 3 (8.3% rate) | 1 | 0 | 2 | 0 | 0.2 (#65) |
| 6 | PHI | 52.6% | 8 | 11 (39.3% rate) | 3 | 2 | 78 | 0 | 9.8 (#29) |
| 7 | CIN | 50.6% | 3 | 24 (42.9% rate) | 3 | 1 | 15 | 0 | 2.5 (#56) |
| 8 | BAL | 20.3% | 0 | 10 (23.3% rate) | 1 | 1 | 3 | 0 | 1.3 (#65) |
| 9 | LAC | 15.2% | 2 | 9 (17.3% rate) | 0 | 0 | 8 | 0 | 0.8 (#67) |
| 11 | NO | 9.7% | 2 | 2 (4.0% rate) | 0 | 0 | 5 | 0 | 0.5 (#65) |
| 12 | PIT | 0.0% | 0 | 0 | 0 | 0 | 0 | 0 | 0.0 (#63) |
| 13 | DEN | 0.0% | 0 | 0 | 0 | 0 | 0 | 0 | 0.0 (#75) |
| 14 | PIT | 9.7% | 0 | 6 (13.6% rate) | 2 | 2 | 9 | 0 | 2.9 (#49) |
Box score statistics such as targets, yards, touchdowns, and fantasy points per target are updated the next day. Advanced stats and metrics are updated later in the week during the NFL season.
Value Over Stream
(VOS)Value Over Stream: Valuation scheme calculates a player's fantasy pts/game over the average waiver wire replacement in standard fantasy league formats during either the current season (or previous year during the offseason) and adjusts for positional bust rates. VOS rank in parenthesis spans all positions, enabling player comparisons across QB's, RB's, WR's, and TE's.
Pierre Strong News & Analysis
Popularity Index
Player Popularity Index (PPI) ranks PlayerProfiler page views over the last 30 days. For example, the No. 1 PPI player page is the most frequently visited page in recent weeks.
Pierre Strong Injury History
Pierre Strong College Stats
| Year Year | Games Games | Rush Attempts Rush Atts | Rushing Yards Rush Yrds | Total Touchdowns TDs | Receptions Rec | Receiving Yards Rec Yrds | Target Share Tgt Share | Age Age | School School |
|---|---|---|---|---|---|---|---|---|---|
|
2018
|
13
(RB)
|
117
|
1116
|
12
|
6
|
84
|
-
|
19
|
South Dakota State
|
|
2019
|
11
(RB)
|
143
|
1018
|
9
|
14
|
169
|
-
|
20
|
South Dakota State
|
|
2020
|
9
(RB)
|
131
|
707
|
4
|
20
|
178
|
-
|
21
|
South Dakota State
|
|
2021
|
15
(RB)
|
240
|
1686
|
18
|
22
|
150
|
-
|
22
|
South Dakota State
|


