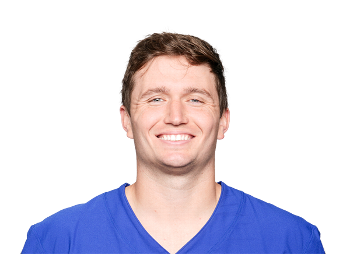
Drew Lock, Seahawks Agree To One-Year Contract
Seattle Seahawks quarterback Drew Lock agreed to a one-year ...
Year Year | Games Played Games | Pass Attempts Atts | Passing Yards Pass Yds | Completion Percentage Comp % | Yards Per Attempt YPA | Rushing Yards Rush Yds | Passing Touchdowns Pass TD | Fantasy Points Per Game Fantasy Pts/Game |
---|---|---|---|---|---|---|---|---|
2021 | 6 | 111 | 787 | 60.4% | 7.1 | 53 (2 td) | 2 | 9.0 |
2020 | 13 | 443 | 2933 | 57.3% | 6.6 | 160 (3 td) | 16 | 15.1 (#27) |
2019 | 5 | 156 | 1020 | 64.1% | 6.5 | 72 (0 td) | 7 | 14.2 |
Pass Attempts Pass Atts | Deep Ball Attempts Deep Ball Atts | Red Zone Attempts Red Zone Atts | Team Pass Plays Per Game Team Pass Plays P/G | Pace of Play | Game Script | Protection Rate |
---|---|---|---|---|---|---|
111 (18.5 p/g) | 22 (3.7 p/g) | 10 (1.7 p/g) | 31.9 | 1.91 | -0.97 | 82.5% |
#42 | #32 | #46 | #22 | #27 | #20 | - |
Passing Yards | Air Yards | Money Throws | Pressured Throws | Danger Plays | Interceptable Passes | Passing TDs |
---|---|---|---|---|---|---|
787 (131.2 p/g) | 1138 (189.7 p/g) | 5 | 24 | 8 | 11 | 2 (1.8% rate) |
#41 | #39 | #39 | #41 | #45 | #36 | #51 |
Yards Per Attempt YPA | Adjusted Yards Per Attempt (AY/A) AY/A | Air Yards Per Attempt | Best Ball Points Added Best Ball Pts Added | Fantasy Points Per Dropback Fantasy Points Per Dropback | Fantasy Points Per Game Fantasy Points P/G | Expected Fantasy Points Per Game Expected Fantasy Points P/G |
---|---|---|---|---|---|---|
7.1 | 6.1 | 10.3 | 3.4 (0.6 p/g) | 0.45 | 9.0 | 10.25 (-1.27 diff) |
- | - | - | #42 | - | - | - |
Accuracy Rating | True Completion Percentage True Comp % | Deep Ball Completion Percentage Deep Ball Comp % | Pressured Completion Percentage Pressure Comp % | Play-action Completion Percentage Play-action Comp % | Red Zone Completion Percentage Red Zone Comp % | Clean Pocket Completion Percentage Clean Pocket Comp % |
---|---|---|---|---|---|---|
7.6 | 65.0% | 27.3% | 54.2% | 48.5% | 50.0% | 62.1% |
- | - | - | - | - | - | - |
True Passer Rating | QBR | Expected Points Added (EPA) EPA | Production Premium | Receiver Target Separation | Receiver Yards After Catch Per Target Receiver YAC Per Target | Dropped Passes Drops |
---|---|---|---|---|---|---|
50.1 | - | +2.2 | -1.4 | 2.07 | 3.44 | 7 (1.17 p/g) |
- | - | #47 | - | #4 | #30 | #39 |
Red Zone Accuracy Rating Red Zone Accuracy Rating | Deep Ball Accuracy Rating Deep Ball Accuracy Rating | Under Pressure Accuracy Rating Pressured Accuracy Rating | Clean Pocket Accuracy Rating Clean Pocket Accuracy Rating | Deep Ball Catchable Pass Rate Deep Ball Catchable Pass Rate | Pressured Catchable Pass Rate Pressured Catchable Pass Rate | Catchable Pass Rate |
---|---|---|---|---|---|---|
6.0 | 5.1 | 7.0 | 7.3 | 56.5% | 76.9% | 79.3% |
- | - | - | - | - | - | #10 |
Man Coverage Throw Rate | Completion Percentage vs Man Comp % vs Man | Completion Percentage vs Zone Comp % vs Zone | Passer Rating vs Man | Passer Rating vs Zone | Accuracy Rating vs Man | Accuracy Rating vs Zone |
---|---|---|---|---|---|---|
53.2% (46.8% vs zone) | 48.5% | 62.1% | 83.3 | 91.3 | 6.6 | 7.6 |
#71 | #71 | #71 | #71 | #71 | #71 | #71 |
Carries | Carries Per Game | Red Zone Carries | RZ Carries Per Game RZ Carries P/G | Rushing Yards | Rush Yards Per Game Rush Yards P/G | Rush TDs |
---|---|---|---|---|---|---|
10 | 1.7 | 2 | 0.3 | 53 | 8.8 | 2 |
#46 | #55 | #42 | #39 | #38 | #31 | #14 |
Pass Attempts Pass Atts | Deep Ball Attempts Deep Ball Atts | Red Zone Attempts Red Zone Atts | Team Pass Plays Per Game Team Pass Plays P/G | Pace of Play | Game Script | Protection Rate |
---|---|---|---|---|---|---|
443 | 63 (4.8 p/g) | 53 (4.1 p/g) | 34.9 | 2.16 | -5.13 | 78.8% |
#20 | #11 | #23 | #47 | #7 | #72 | #30 |
Passing Yards | Air Yards | Money Throws | Pressured Throws | Danger Plays | Interceptable Passes | Passing TDs |
---|---|---|---|---|---|---|
2933 (225.6 p/g) | 3812 (293.2 p/g) | 10 | 132 | 44 | 27 | 16 (3.6% rate) |
#21 | #18 | #28 | #10 | #2 | #6 | #20 |
Yards Per Attempt YPA | Adjusted Yards Per Attempt (AY/A) AY/A | Air Yards Per Attempt | Best Ball Points Added Best Ball Pts Added | Fantasy Points Per Dropback Fantasy Points Per Dropback | Fantasy Points Per Game Fantasy Points P/G | Expected Fantasy Points Per Game Expected Fantasy Points P/G |
---|---|---|---|---|---|---|
6.6 | 5.6 | 8.6 | 17.6 (1.4 p/g) | 0.42 | 15.1 | 17.22 (-1.81 diff) |
#27 | #30 | #4 | #20 | #28 | #27 | #21 |
Accuracy Rating | True Completion Percentage True Comp % | Deep Ball Completion Percentage Deep Ball Comp % | Pressured Completion Percentage Pressure Comp % | Play-action Completion Percentage Play-action Comp % | Red Zone Completion Percentage Red Zone Comp % | Clean Pocket Completion Percentage Clean Pocket Comp % |
---|---|---|---|---|---|---|
6.7 | 62.9% | 27.0% | 32.6% | 64.5% | 56.6% | 67.8% |
#33 | #37 | #34 | #33 | #28 | #19 | #35 |
True Passer Rating | QBR | Expected Points Added (EPA) EPA | Production Premium | Receiver Target Separation | Receiver Yards After Catch Per Target Receiver YAC Per Target | Dropped Passes Drops |
---|---|---|---|---|---|---|
70.1 | - | +7.7 | -4.0 | 1.84 | 3.05 | 22 (1.69 p/g) |
#31 | - | #37 | #34 | #9 | #60 | #19 |
Red Zone Accuracy Rating Red Zone Accuracy Rating | Deep Ball Accuracy Rating Deep Ball Accuracy Rating | Under Pressure Accuracy Rating Pressured Accuracy Rating | Clean Pocket Accuracy Rating Clean Pocket Accuracy Rating | Deep Ball Catchable Pass Rate Deep Ball Catchable Pass Rate | Pressured Catchable Pass Rate Pressured Catchable Pass Rate | Catchable Pass Rate |
---|---|---|---|---|---|---|
6.8 | 5.0 | 5.7 | 7.1 | 43.5% | 44.7% | 69.8% |
#30 | #35 | #34 | #34 | #33 | #30 | #43 |
Carries | Carries Per Game | Red Zone Carries | RZ Carries Per Game RZ Carries P/G | Rushing Yards | Rush Yards Per Game Rush Yards P/G | Rush TDs |
---|---|---|---|---|---|---|
44 | 3.4 | 9 | 0.7 | 160 | 12.3 | 3 |
#16 | #21 | #16 | #19 | #18 | - | #11 |
Pass Attempts Pass Atts | Deep Ball Attempts Deep Ball Atts | Red Zone Attempts Red Zone Atts | Team Pass Plays Per Game Team Pass Plays P/G | Pace of Play | Game Script | Protection Rate |
---|---|---|---|---|---|---|
156 | 14 (2.8 p/g) | 27 (5.4 p/g) | 34.1 | 2.17 | +0.28 | 81.0% |
#38 | #39 | #34 | #25 | #27 | #11 | - |
Passing Yards | Air Yards | Money Throws | Pressured Throws | Danger Plays | Interceptable Passes | Passing TDs |
---|---|---|---|---|---|---|
1020 (204.0 p/g) | 1080 (216.0 p/g) | 2 | 41 | 7 | 5 | 7 (4.5% rate) |
#38 | #39 | #40 | #37 | #45 | #45 | #33 |
Yards Per Attempt YPA | Adjusted Yards Per Attempt (AY/A) AY/A | Air Yards Per Attempt | Best Ball Points Added Best Ball Pts Added | Fantasy Points Per Dropback Fantasy Points Per Dropback | Fantasy Points Per Game Fantasy Points P/G | Expected Fantasy Points Per Game Expected Fantasy Points P/G |
---|---|---|---|---|---|---|
6.5 | 6.4 | 6.9 | 4.7 (0.9 p/g) | 0.40 | 14.2 | - |
- | - | - | #34 | - | - | - |
Accuracy Rating | True Completion Percentage True Comp % | Deep Ball Completion Percentage Deep Ball Comp % | Pressured Completion Percentage Pressure Comp % | Play-action Completion Percentage Play-action Comp % | Red Zone Completion Percentage Red Zone Comp % | Clean Pocket Completion Percentage Clean Pocket Comp % |
---|---|---|---|---|---|---|
7.0 | 69.9% | 28.6% | 51.2% | 66.7% | 66.7% | 68.7% |
#45 | - | - | - | - | #8 | - |
True Passer Rating | QBR | Expected Points Added (EPA) EPA | Production Premium | Receiver Target Separation | Receiver Yards After Catch Per Target Receiver YAC Per Target | Dropped Passes Drops |
---|---|---|---|---|---|---|
91.8 | - | +57.1 | -10.5 | 1.95 | 3.64 | 9 (1.80 p/g) |
- | - | #47 | - | #3 | #21 | #37 |
Red Zone Accuracy Rating Red Zone Accuracy Rating | Deep Ball Accuracy Rating Deep Ball Accuracy Rating | Under Pressure Accuracy Rating Pressured Accuracy Rating | Clean Pocket Accuracy Rating Clean Pocket Accuracy Rating | Deep Ball Catchable Pass Rate Deep Ball Catchable Pass Rate | Pressured Catchable Pass Rate Pressured Catchable Pass Rate | Catchable Pass Rate |
---|---|---|---|---|---|---|
- | - | - | - | - | - | 74.4% |
- | - | - | - | - | - | #36 |
Carries | Carries Per Game | Red Zone Carries | RZ Carries Per Game RZ Carries P/G | Rushing Yards | Rush Yards Per Game Rush Yards P/G | Rush TDs |
---|---|---|---|---|---|---|
18 | 3.6 | 2 | 0.4 | 72 | 14.4 | 0 |
#35 | #11 | #33 | #27 | #26 | - | #30 |
Week Wk | Opponent Opp | Attempts Attempts | Completion Percentage Completion Percentage | Passing Yards Passing Yards | Yards Per Attempt Yards Per Attempt | Passing Touchdowns Passing Touchdowns | Rushing Yards Rushing Yards | Rushing Touchdowns Rushing Touchdowns | Fantasy Points Fantasy Points |
---|---|---|---|---|---|---|---|---|---|
4 | BAL | 21 | 57.1% | 113 (200 air) | 5.4 | 0 (1 int) | 0 | 0 | 3.5 (#35) |
12 | LAC | 7 | 57.1% | 26 (25 air) | 3.7 | 0 (1 int) | 0 | 0 | 0.0 (#34) |
15 | CIN | 12 | 50.0% | 88 (144 air) | 7.3 | 1 | -2 | 0 | 5.3 (#30) |
16 | LV | 22 | 68.2% | 153 (244 air) | 7.0 | 0 | 10 | 0 | 7.1 (#29) |
17 | LAC | 25 | 72.0% | 245 (256 air) | 9.8 | 1 | 10 | 0 | 15.9 (#15) |
18 | KC | 24 | 50.0% | 162 (269 air) | 6.8 | 0 | 35 | 2 | 22.0 (#9) |
Week Wk | Opponent Opp | Attempts Attempts | Completion Percentage Completion Percentage | Passing Yards Passing Yards | Yards Per Attempt Yards Per Attempt | Passing Touchdowns Passing Touchdowns | Rushing Yards Rushing Yards | Rushing Touchdowns Rushing Touchdowns | Fantasy Points Fantasy Points |
---|---|---|---|---|---|---|---|---|---|
1 | TEN | 33 | 66.7% | 216 (292 air) | 6.5 | 1 | 5 | 0 | 13.1 (#26) |
2 | PIT | 5 | 20.0% | 20 (97 air) | 4.0 | 0 | 0 | 0 | -1.2 (#39) |
6 | NE | 24 | 41.7% | 189 (392 air) | 7.9 | 0 (2 int) | -1 | 0 | 5.5 (#28) |
7 | KC | 40 | 60.0% | 254 (271 air) | 6.4 | 0 (2 int) | 8 | 1 | 15.0 (#22) |
8 | LAC | 41 | 63.4% | 248 (305 air) | 6.0 | 3 (1 int) | -1 | 0 | 20.8 (#7) |
9 | ATL | 48 | 52.1% | 313 (431 air) | 6.5 | 2 (1 int) | 47 | 1 | 30.2 (#4) |
10 | LV | 47 | 48.9% | 257 (408 air) | 5.5 | 1 (4 int) | 7 | 0 | 11.0 (#20) |
11 | MIA | 30 | 60.0% | 270 (327 air) | 9.0 | 0 (1 int) | 23 | 0 | 12.1 (#21) |
13 | KC | 28 | 53.6% | 151 (217 air) | 5.4 | 2 (2 int) | 9 | 0 | 12.9 (#25) |
14 | CAR | 27 | 77.8% | 280 (180 air) | 10.4 | 4 | 4 | 0 | 25.6 (#6) |
15 | BUF | 32 | 62.5% | 132 (122 air) | 4.1 | 1 | 37 | 0 | 11.0 (#30) |
16 | LAC | 47 | 51.1% | 264 (486 air) | 5.6 | 0 (2 int) | 15 | 1 | 16.1 (#21) |
17 | LV | 41 | 61.0% | 339 (284 air) | 8.3 | 2 | 7 | 0 | 24.3 (#9) |
Week Wk | Opponent Opp | Attempts Attempts | Completion Percentage Completion Percentage | Passing Yards Passing Yards | Yards Per Attempt Yards Per Attempt | Passing Touchdowns Passing Touchdowns | Rushing Yards Rushing Yards | Rushing Touchdowns Rushing Touchdowns | Fantasy Points Fantasy Points |
---|---|---|---|---|---|---|---|---|---|
13 | LAC | 28 | 64.3% | 134 | 4.8 | 2 (1 int) | 15 | 0 | 12.9 (##22) |
14 | HOU | 27 | 81.5% | 309 | 11.4 | 3 (1 int) | 15 | 0 | 23.9 (##8) |
15 | KC | 40 | 45.0% | 208 | 5.2 | 0 (1 int) | 3 | 0 | 6.6 (##31) |
16 | DET | 33 | 75.8% | 192 | 5.8 | 1 | 10 | 0 | 12.7 (##19) |
17 | OAK | 28 | 60.7% | 177 | 6.3 | 1 | 29 | 0 | 12.0 (##20) |
Seattle Seahawks quarterback Drew Lock agreed to a one-year ...
Seattle Seahawks quarterback Drew Lock missed the previous ...
Seattle Seahawks quarterback Drew Lock (illness) returned ...
Player Popularity Index (PPI) ranks PlayerProfiler page views over the last 30 days. For example, the No. 1 PPI player page is the most frequently visited page in recent weeks.
Year Year | Games Games | Pass Attempts Pass Atts | Passing Yards Pass Yds | Yards Per Attempt YPA | Completion Percentage Comp % | Passing Touchdowns Pass TDs | Rushing Yards Rush Yds | Age Age | School School |
---|---|---|---|---|---|---|---|---|---|
2015 | 12 (QB) | 263 | 1,332 | 5.1 | 49.0% | 4 (8 ints) | 28 | 17 | Missouri |
2016 | 12 (QB) | 434 | 3,399 | 7.8 | 54.6% | 23 (10 ints) | 123 | 18 | Missouri |
2017 | 13 (QB) | 419 | 3,964 | 9.5 | 57.80% | 44 (13 ints) | 111 | 19 | Missouri |
2018 | 13 (QB) | 437 | 3,498 | 8.00 | 62.93% | 28 (8 ints) | 175 | 20 | Missouri |
Drew Lock's impressive college stats and towering 6’-4” height was enough for the Broncos to take him in the second round of the 2019 NFL Draft with the No. 42 overall pick. He sprained his thumb in the preseason and was shut down for most of his rookie year, but returned to the team at the end of the season. In his first start, he was able to get the offense in position to kick a late field goal and beat the Chargers. While his overall stats were not impressive, Lock went 4-1 as starter and the Broncos felt comfortable keeping him as the starter for the future. The 2020 season would go much differently. He finished that year tied with Carson Wentz for the most interceptions thrown (15) and a completion percentage of 57.3-percent, the lowest among all quarterbacks with at least 150 passing attempts.
The Broncos brought in Teddy Bridgewater for the 2021 season. Bridgewater started the first three games until he was injured. Lock continued to play poorly when handed the job, evidenced by his 52.3 QBR in Week 4. He looked even worse in Week 12 when he recorded a 25.6 QBR. Lock finished the 2021 season with the fantasy ranking of QB 42. His draft capital and starting experience may allow him to stay in the league as a backup, but his time as a starter in the NFL is likely over. If the film wasn’t incriminating enough, the Next Gen Stats look even worse. His completion rating on deep balls has been at or under 28% every year of his career. Entering the final year of his rookie contract with the Broncos, Lock was shipped to Seattle in the Russell Wilson trade. Whether he ever starts another game is yet to be determined.