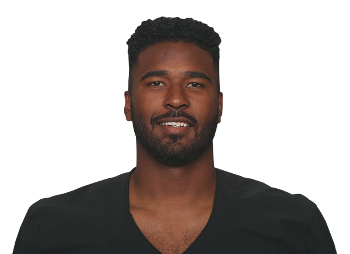
Ravens Sign Brett Hundley
The Baltimore Ravens signed quarterback Brett Hundley to ...
Year Year | Games Played Games | Pass Attempts Atts | Passing Yards Pass Yds | Completion Percentage Comp % | Yards Per Attempt YPA | Rushing Yards Rush Yds | Passing Touchdowns Pass TD | Fantasy Points Per Game Fantasy Pts/Game |
---|---|---|---|---|---|---|---|---|
2019 | 3 | 11 | 49 | 45.5% | 4.5 | 41 (0 td) | 0 | 2.0 |
2017 | 11 | 316 | 1836 | 60.8% | 5.8 | 270 (2 td) | 9 | 12.1 (#28) |
2016 | 4 | 10 | 17 | 20.0% | 1.7 | -2 (0 td) | 0 | -0.1 |
Pass Attempts Pass Atts | Deep Ball Attempts Deep Ball Atts | Red Zone Attempts Red Zone Atts | Team Pass Plays Per Game Team Pass Plays P/G | Pace of Play | Game Script | Protection Rate |
---|---|---|---|---|---|---|
11 | 3 (1.0 p/g) | 1 (0.3 p/g) | 37.8 | 2.39 | -2.94 | 90.0% |
#58 | #56 | #58 | #17 | #3 | #24 | - |
Passing Yards | Air Yards | Money Throws | Pressured Throws | Danger Plays | Interceptable Passes | Passing TDs |
---|---|---|---|---|---|---|
49 (16.3 p/g) | 108 (36.0 p/g) | 0 | 1 | 1 | 0 | 0 (0.0% rate) |
#59 | #59 | #50 | #58 | #55 | #59 | #52 |
Yards Per Attempt YPA | Adjusted Yards Per Attempt (AY/A) AY/A | Air Yards Per Attempt | Best Ball Points Added Best Ball Pts Added | Fantasy Points Per Dropback Fantasy Points Per Dropback | Fantasy Points Per Game Fantasy Points P/G | Expected Fantasy Points Per Game Expected Fantasy Points P/G |
---|---|---|---|---|---|---|
4.5 | 3.8 | 9.8 | 0.0 (0.0 p/g) | 0.30 | 2.0 | - |
- | - | - | #38 | - | - | - |
Accuracy Rating | True Completion Percentage True Comp % | Deep Ball Completion Percentage Deep Ball Comp % | Pressured Completion Percentage Pressure Comp % | Play-action Completion Percentage Play-action Comp % | Red Zone Completion Percentage Red Zone Comp % | Clean Pocket Completion Percentage Clean Pocket Comp % |
---|---|---|---|---|---|---|
8.4 | 50.0% | 33.3% | 0.0% | 25.0% | 100.0% | 50.0% |
#36 | - | - | - | - | #1 | - |
True Passer Rating | QBR | Expected Points Added (EPA) EPA | Production Premium | Receiver Target Separation | Receiver Yards After Catch Per Target Receiver YAC Per Target | Dropped Passes Drops |
---|---|---|---|---|---|---|
64.2 | - | +2.2 | -50.9 | 1.36 | 3.20 | 1 (0.33 p/g) |
- | - | #41 | - | #66 | #41 | #55 |
Red Zone Accuracy Rating Red Zone Accuracy Rating | Deep Ball Accuracy Rating Deep Ball Accuracy Rating | Under Pressure Accuracy Rating Pressured Accuracy Rating | Clean Pocket Accuracy Rating Clean Pocket Accuracy Rating | Deep Ball Catchable Pass Rate Deep Ball Catchable Pass Rate | Pressured Catchable Pass Rate Pressured Catchable Pass Rate | Catchable Pass Rate |
---|---|---|---|---|---|---|
- | - | - | - | - | - | 90.9% |
- | - | - | - | - | - | #57 |
Carries | Carries Per Game | Red Zone Carries | RZ Carries Per Game RZ Carries P/G | Rushing Yards | Rush Yards Per Game Rush Yards P/G | Rush TDs |
---|---|---|---|---|---|---|
7 | 2.3 | 2 | 0.7 | 41 | 13.7 | 0 |
#45 | #35 | #33 | #14 | #34 | - | #30 |
Pass Attempts Pass Atts | Deep Ball Attempts Deep Ball Atts | Red Zone Attempts Red Zone Atts | Team Pass Plays Per Game Team Pass Plays P/G | Pace of Play | Game Script | Protection Rate |
---|---|---|---|---|---|---|
316 | 35 (3.2 p/g) | 30 (2.7 p/g) | - | 2.25 | -1.23 | 82.9% |
#29 | #31 | #31 | - | #11 | #17 | #36 |
Passing Yards | Air Yards | Money Throws | Pressured Throws | Danger Plays | Interceptable Passes | Passing TDs |
---|---|---|---|---|---|---|
1836 (166.9 p/g) | 2364 (214.9 p/g) | 3 | - | 18 | 13 | 9 (2.8% rate) |
#30 | #30 | #40 | - | #30 | #28 | #30 |
Yards Per Attempt YPA | Adjusted Yards Per Attempt (AY/A) AY/A | Air Yards Per Attempt | Best Ball Points Added Best Ball Pts Added | Fantasy Points Per Dropback Fantasy Points Per Dropback | Fantasy Points Per Game Fantasy Points P/G | Expected Fantasy Points Per Game Expected Fantasy Points P/G |
---|---|---|---|---|---|---|
5.8 | 4.3 | 7.5 | 11.8 (1.1 p/g) | 0.35 | 12.1 | - |
#37 | #37 | #33 | #25 | #28 | #28 | - |
Accuracy Rating | True Completion Percentage True Comp % | Deep Ball Completion Percentage Deep Ball Comp % | Pressured Completion Percentage Pressure Comp % | Play-action Completion Percentage Play-action Comp % | Red Zone Completion Percentage Red Zone Comp % | Clean Pocket Completion Percentage Clean Pocket Comp % |
---|---|---|---|---|---|---|
- | 67.1% | 22.9% | 21.5% | - | 53.3% | 77.2% |
- | #21 | #34 | #36 | - | #25 | #4 |
True Passer Rating | QBR | Expected Points Added (EPA) EPA | Production Premium | Receiver Target Separation | Receiver Yards After Catch Per Target Receiver YAC Per Target | Dropped Passes Drops |
---|---|---|---|---|---|---|
76.3 | 41.6 | +30.3 | -5.3 | 1.18 | - | 21 (1.91 p/g) |
#29 | #28 | #31 | #23 | #71 | - | #26 |
Red Zone Accuracy Rating Red Zone Accuracy Rating | Deep Ball Accuracy Rating Deep Ball Accuracy Rating | Under Pressure Accuracy Rating Pressured Accuracy Rating | Clean Pocket Accuracy Rating Clean Pocket Accuracy Rating | Deep Ball Catchable Pass Rate Deep Ball Catchable Pass Rate | Pressured Catchable Pass Rate Pressured Catchable Pass Rate | Catchable Pass Rate |
---|---|---|---|---|---|---|
- | - | - | - | - | - | 74.4% |
- | - | - | - | - | - | #24 |
Carries | Carries Per Game | Red Zone Carries | RZ Carries Per Game RZ Carries P/G | Rushing Yards | Rush Yards Per Game Rush Yards P/G | Rush TDs |
---|---|---|---|---|---|---|
36 | 3.3 | 8 | 0.7 | 270 | - | 2 |
#16 | #17 | #11 | #13 | #10 | - | #11 |
Pass Attempts Pass Atts | Deep Ball Attempts Deep Ball Atts | Red Zone Attempts Red Zone Atts | Team Pass Plays Per Game Team Pass Plays P/G | Pace of Play | Game Script | Protection Rate |
---|---|---|---|---|---|---|
10 | 2 (0.5 p/g) | 2 (0.5 p/g) | - | 2.35 | -0.35 | - |
#62 | #54 | #53 | - | #4 | #14 | - |
Passing Yards | Air Yards | Money Throws | Pressured Throws | Danger Plays | Interceptable Passes | Passing TDs |
---|---|---|---|---|---|---|
17 (4.2 p/g) | 91 | - | - | - | - | 0 (0.0% rate) |
#66 | #60 | - | - | - | - | #55 |
Yards Per Attempt YPA | Adjusted Yards Per Attempt (AY/A) AY/A | Air Yards Per Attempt | Best Ball Points Added Best Ball Pts Added | Fantasy Points Per Dropback Fantasy Points Per Dropback | Fantasy Points Per Game Fantasy Points P/G | Expected Fantasy Points Per Game Expected Fantasy Points P/G |
---|---|---|---|---|---|---|
1.7 | -2.8 | 9.1 | 0.0 (0.0 p/g) | -0.04 | -0.1 | - |
- | - | - | #39 | - | - | - |
Accuracy Rating | True Completion Percentage True Comp % | Deep Ball Completion Percentage Deep Ball Comp % | Pressured Completion Percentage Pressure Comp % | Play-action Completion Percentage Play-action Comp % | Red Zone Completion Percentage Red Zone Comp % | Clean Pocket Completion Percentage Clean Pocket Comp % |
---|---|---|---|---|---|---|
- | - | 0.0% | 0.0% | - | 0.0% | 22.2% |
- | - | - | - | - | #56 | - |
True Passer Rating | QBR | Expected Points Added (EPA) EPA | Production Premium | Receiver Target Separation | Receiver Yards After Catch Per Target Receiver YAC Per Target | Dropped Passes Drops |
---|---|---|---|---|---|---|
- | 6.3 | -10.3 | -86.4 | - | - | - |
- | - | #36 | - | #8 | - | - |
Carries | Carries Per Game | Red Zone Carries | RZ Carries Per Game RZ Carries P/G | Rushing Yards | Rush Yards Per Game Rush Yards P/G | Rush TDs |
---|---|---|---|---|---|---|
3 | 0.8 | 0 | 0.0 | -2 | - | 0 |
#54 | - | #46 | - | #61 | - | #27 |
Week Wk | Opponent Opp | Attempts Attempts | Completion Percentage Completion Percentage | Passing Yards Passing Yards | Yards Per Attempt Yards Per Attempt | Passing Touchdowns Passing Touchdowns | Rushing Yards Rushing Yards | Rushing Touchdowns Rushing Touchdowns | Fantasy Points Fantasy Points |
---|---|---|---|---|---|---|---|---|---|
8 | NO | 1 | 0.0% | 0 | 0.0 | 0 (0 int) | 0 | 0 | 0.0 (##32) |
16 | SEA | 9 | 44.4% | 49 | 5.4 | 0 (0 int) | 35 | 0 | 5.5 (##33) |
17 | LA | 1 | 100.0% | 0 | 0.0 | 0 (0 int) | 6 | 0 | 0.6 (##34) |
Week Wk | Opponent Opp | Attempts Attempts | Completion Percentage Completion Percentage | Passing Yards Passing Yards | Yards Per Attempt Yards Per Attempt | Passing Touchdowns Passing Touchdowns | Rushing Yards Rushing Yards | Rushing Touchdowns Rushing Touchdowns | Fantasy Points Fantasy Points |
---|---|---|---|---|---|---|---|---|---|
4 | CHI | 1 | 100.0% | 0 | 0.0 | 0 (0 int) | 0 | 0 | 0.0 (##35) |
6 | MIN | 33 | 54.5% | 157 | 4.8 | 1 (3 int) | 0 | 0 | 7.3 (##27) |
7 | NO | 25 | 48.0% | 87 | 3.5 | 0 (1 int) | 44 | 1 | 12.9 (##19) |
9 | DET | 38 | 68.4% | 245 | 6.4 | 0 (0 int) | 22 | 1 | 18.0 (##14) |
10 | CHI | 25 | 72.0% | 212 | 8.5 | 1 (0 int) | 16 | 0 | 14.1 (##22) |
11 | BAL | 36 | 58.3% | 239 | 6.6 | 0 (3 int) | 19 | 0 | 7.5 (##27) |
12 | PIT | 26 | 65.4% | 245 | 9.4 | 3 (0 int) | 6 | 0 | 22.4 (##9) |
13 | TB | 22 | 59.1% | 84 | 3.8 | 0 (1 int) | 66 | 0 | 9.0 (##29) |
14 | CLE | 46 | 76.1% | 265 | 5.8 | 3 (0 int) | 31 | 0 | 25.7 (##4) |
16 | MIN | 40 | 42.5% | 130 | 3.2 | 0 (2 int) | 48 | 0 | 8.0 (##27) |
17 | DET | 24 | 58.3% | 172 | 7.2 | 1 (2 int) | 15 | 0 | 10.4 (##23) |
Week Wk | Opponent Opp | Attempts Attempts | Completion Percentage Completion Percentage | Passing Yards Passing Yards | Yards Per Attempt Yards Per Attempt | Passing Touchdowns Passing Touchdowns | Rushing Yards Rushing Yards | Rushing Touchdowns Rushing Touchdowns | Fantasy Points Fantasy Points |
---|---|---|---|---|---|---|---|---|---|
10 | TEN | - | 25.0% | 8 | 2.0 | 0 (0 int) | 0 | 0 tds | 0.3 (##29) |
11 | WAS | - | 33.3% | 9 | 3.0 | 0 (1 int) | 0 | 0 tds | -0.6 (##33) |
14 | SEA | - | 0.0% | 0 | 0.0 | 0 (0 int) | -2 | 0 tds | -0.2 (##35) |
16 | MIN | - | 0.0% | 0 | 0.0 | 0 (0 int) | 0 | 0 tds | 0.0 (##37) |
The Baltimore Ravens signed quarterback Brett Hundley to ...
The Baltimore Ravens have signed free-agent quarterback ...
The Indianapolis Colts released quarterback Brett Hundley ...
Year Year | Games Games | Pass Attempts Pass Atts | Passing Yards Pass Yds | Yards Per Attempt YPA | Completion Percentage Comp % | Passing Touchdowns Pass TDs | Rushing Yards Rush Yds | Age Age | School School |
---|---|---|---|---|---|---|---|---|---|
2012 | 14 (QB) | 478 | 3740 | 7.8 | 66.50% | 29 (11 ints) | 355 | 19 | UCLA |
2013 | 13 (QB) | 371 | 3071 | 8.3 | 66.80% | 24 (9 ints) | 748 | 20 | UCLA |
2014 | 13 (QB) | 392 | 3,155 | 8.0 | 69.1% | 22 (5 ints) | 644 | 21 | UCLA |