
Passing is more efficient than rushing in the NFL. In 2015, teams averaged 4.1 yards per rush attempt vs. 6.8 yards per pass — an incredible 2.7 yards per play difference. Over the last 11 seasons, running backs have averaged 7.9 yards per reception and 4.2 yards per rush — a staggering 3.7 yards per touch difference.
Fantasy football enthusiasts often associated high reception totals with “PPR league” premium. While reception-based scoring naturally puts a premium on skill position players who score an inordinate number of receptions, Rich Hribar argues that this “PPR effect” is often overstated, and passing game opportunity is a value driver in both PPR and non-PPR formats. Target volume supercharges RB upside while also establishing a higher floor across all fantasy formats.
Recently on RotoViz.com, Shawn Siegele analyzed Devonta Freeman’s sublime 2015 fantasy season. Siegele came away pleasantly surprised by how receptions and receiving yards bolstered Freeman’s value despite sub-par athleticism (see Workout Metrics below). He started his analysis expecting to build a case against Freeman, and walked away with a new appreciation for how Freeman’s activity in the passing game enhanced his fantasy value. Though Freeman is already a top-5 dynasty running back by all ADP sources, Siegele contends that Freeman is wildly undervalued in dynasty leagues, largely because most fantasy gamers do not yet fully appreciate the power of running back receptions.
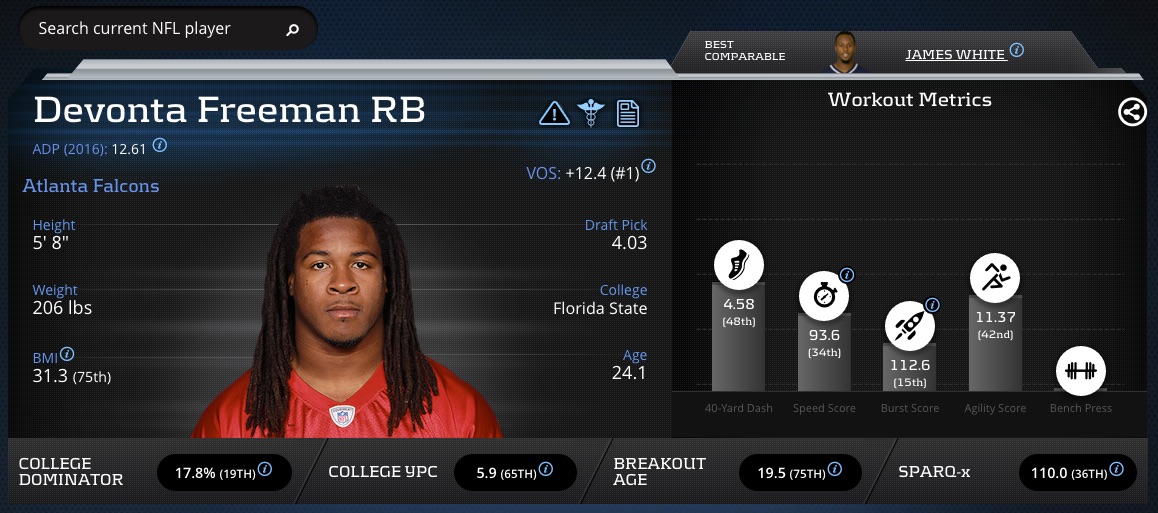
Devonta Freeman Advanced Metrics Profile
While conducting my own RB analysis, I noticed that the most efficient running backs according to PlayerProfiler‘s Production Premium each year are highly active in the passing game from Darren Sproles in 2013 to Roy Helu in 2014 to Theo Riddick in 2015.
From the PlayerProfiler Terms Glossary:
Production Premium isolates a player’s situational efficiency. Production Premium compares all of a particular player’s opportunities (pass attempts, carries, and targets) to the average fantasy points that are typically scored in those particular game situations (yard line, down, and distance). Production Premium also takes into account time remaining and game score to account for non-standard situations such as 2-minute drills, clock-milking, and garbage time.
Positive values indicate that a player is more efficient than the average full-time player, while negative values indicate that a player is less efficient than his peers with similar opportunities.
Every player’s on-field performance is affected by his teammates. When a given player’s supporting cast changes (via trade or free agency), this metric is particularly helpful, because it measures that player’s capabilities in the average situation
Using the PlayerProfiler’s Data Analysis Tool, I pulled running backs who secured 100-plus touches and posted a positive Production Premium since 2013. Running backs with 100-plus touches in a season also averaged ~3.0 targets per game in those moderate to heavy usage seasons.

Top-10 Production Premium Running Backs (2013-2015)
43 out of the 56 positive Production Premium seasons for running backs from 2013 through 2015 were posted by running backs receiving 3.0-plus targets per game. Think Matt Forte, Danny Woodhead, and Jamaal Charles. How did Matt Forte finish 2014 with a positive Production Premium despite an abysmal 3.9 yards per carry? Forte led all NFL running backs with 101-receptions and 49.6-receiving yards per game that season, which allowed him to post a 5.0-yards per touch. While Forte struggled in on relatively inefficient rush plays (4.2 YPC historically), he was heavily utilized in the more efficient pass plays (7.9 YPR historically) and went on to finish 2014 with 21.3 (No. 3) fantasy points per game.
When in doubt, choose efficiency. All-purpose bell cows and scat backs are generally more efficient than their power back brethren who are generally less active in the passing game and more at the mercy of random chance week to week. Running backs who are trusted in the passing game are often deployed in situations that maximize efficiency, and their all-field skill sets makes them less dependent on game situation or touches in high leverage situations (e.g. goal line carries). Given that external factors such as game flow, offensive line effectiveness, and overall offense efficiency are difficult to forecast year-to-year (game flow is the most random), stocking a fantasy roster with target magnet running backs is a sound fantasy roster construction tactic.
By simply focusing on receptions per game, players such as Isaiah Crowell (1.4 rec/g, -14.7 Prod Prem), Jeremy Hill (1.2 rec/g, -6.1 Prod Prem), and Alfred Morris (0.8 rec/g, -36.6 Prod Prem) would have been avoided in 2015.
Looking ahead to 2016, here are three back with low receptions per game and top-10 ADPs to avoid in the first round:
• Thomas Rawls (0.9 rec/g)
• Todd Gurley (2.0 rec/g)
• Adrian Peterson (2.2 rec/g)
Here are three backs with ADPs outside the top-25 who could ride a wave of passing game efficiency to be this season’s Devonta Freeman:
• Javorius Allen (2.8 rec/g overall, 5.3 rec/g as a starter)
• Charles Sims (4.4 rec/g)
• Duke Johnson (4.7 rec/g)
Target RB targets. Stockpile all-purpose bell cows and scat backs who are often deployed in situations that maximize their efficiency and all-field skill sets.

