
This started out with me asking myself a simple question. Has recency bias clouded my view of Todd Gurley and Melvin Gordon? In mock after mock, I find myself taking Gordon ahead of Gurley. I am not the only one. Based on their respective MyFantasyLeague ADPs, Gordon is ranked as the No. 9 overall and being drafted at 9.39 on average. On the other hand, Gurley is currently being drafted as the No. 21 overall player with an average draft price of 21.96. But when I looked at my projections workbook, which calculates projections from historical data, Gurley is ranked ahead of Gordon by two spots in both standard scoring and PPR formats. What am I missing?
I decided to start with a little social experiment. On Twitter, I posted two polls, on the same exact day, with the same exact players and got nearly the same number of votes. In one, I just simply asked, who would you rather have, and listed the players by name. Gordon won that poll decisively with 61-percent.
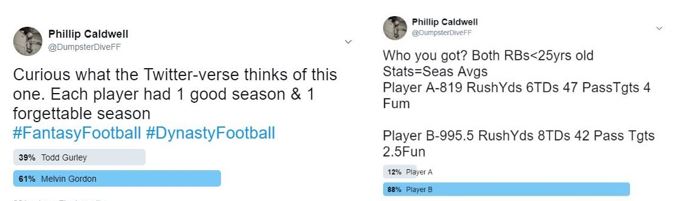
On the second one, I omitted the players’ names but listed their career season averages. Player A was Melvin Gordon, and player B was Todd Gurley. Here you can see Gurley dominated with 88-percent of the vote when the players’ names were omitted.
Considering these two very different results, I wanted to find out; are we leaning too much on the 2016 season and the two players will revert to their historical means? Or do I need to change my rankings having only two years of data?
Opportunity
When looking at the player cards for both Melvin Gordon and Todd Gurley, you can see that both players had very similar opportunities. They were both obviously the featured running back for their teams, and both teams did very little to impact that status in either the draft or free agency.
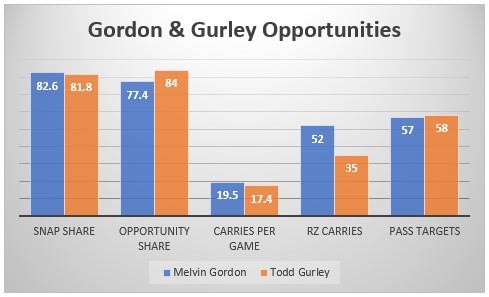
The Rams did add Lance Dunbar to replace Benny Cunningham as the pass catching back, who could see a decent amount of opportunities. In Sean McVay’s 2016 Washington offense, Chris Thompson held that role and received a 49.7-percent snap share and a 30.1-percent Opportunity Share compared to Cunningham eating into Gurley’s time only 27.7-percent of the snaps and 15.4-percent of the opportunity share. However, Washington’s backfield was in flux at the beginning of the season before Rob Kelley took over the job decisively. With an established player like Gurley commanding the top of the depth chart, it is safe to assume Dunbar finds himself somewhere in between Cunningham’s 15.4-percent and Thompson’s 30.1-percent of the opportunity share leaving Gurley around the 80-percent mark still.
https://www.youtube.com/watch?v=eQDyqzi0Rek
This might seem to give the advantage to Melvin Gordon now, but remember Branden Oliver was injured for 2016 and is coming back healthy this season. In 2015 he was on the field for 42-percent of the snap share and saw 19.4-percent opportunity share. Oliver should see a similar amount of playing time, if not a slight uptick in an effort to keep Gordon healthy and able for a full 16 games after getting dinged up in each of the past two seasons.
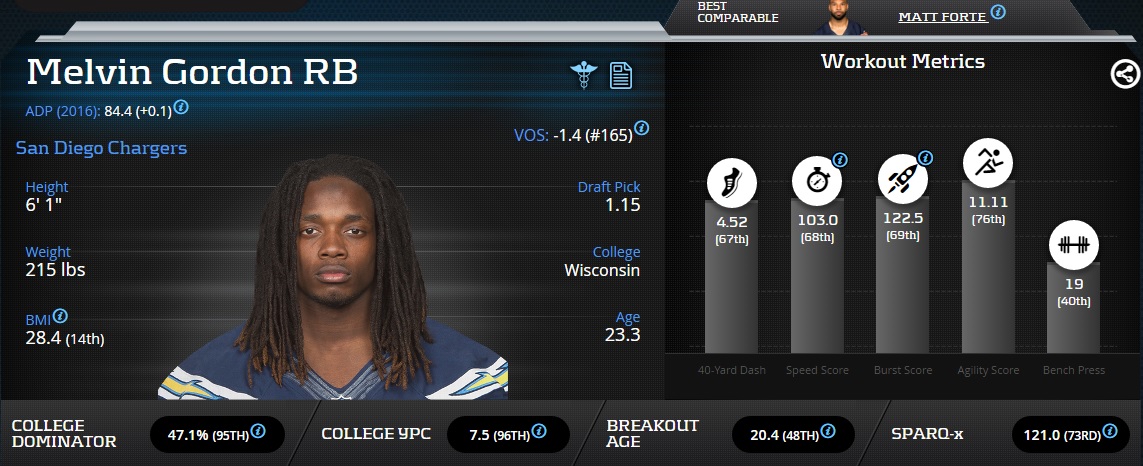
Melvin Gordon Advanced Stats & Metrics Profile
In conclusion, both players will likely have very similar opportunities in 2017. Both teams have seen coaching changes, which typically favors the amount of rushing attempts, so neither gets an advantage for that either. The only real difference is the amount of red zone carries then, where Melvin Gordon ranked No.4 with 52, compared to Todd Gurley’s 35 carries in the red zone, good for No.15 in 2016. The main difference here would be, the Chargers were simply in the red zone more often. The Chargers ranked No.9 in points per game with 25.6, compared to the Rams being dead last in the league with only 14 points per game. If you believe in Sean McVay to rejuvenate that dismal Rams offense, then with that belief, must come an increase in red zone carries for Gurley as well. However, until I see Goff and company legitimately threaten teams in the passing game, I can’t buy in.
Advantage: Melvin Gordon
Efficiency
Sports writers like Gary Klein of the Los Angeles times calling Todd Gurley a “dynamic threat capable of carrying an offense”. Images of him hurtling defenders, and guys like NFL.com’s Lance Zierlein describing him as being able to “side-step and jet” make us believe that Gurley must be highly efficient with all of his touches. Mike Pettine was even quoted in the New York Post saying “He can make you miss, jump over you”. Whereas everyone’s favorite stat on Melvin Gordon seems to be that his yards per carry in 2016 were an uninspiring 3.9, leading you to believe Gordon is nothing more than “volume play.”
Photo Credit: Billy Hurst-USA TODAY
However, this is nothing more than cognitive dissonance when you look at the numbers. Both players recorded the same number of evaded tackles (57) their rookie campaigns. In 2016, Todd Gurley recorded 10 less evaded tackles (47) whereas Melvin Gordon recorded 6 more (63) his sophomore season. Gordon also out performed him in Juke Rate with a 21.4-percent compared to Gurley’s 14.6-percent score. Gurley’s reputation as an whirling, hurdling playmaker masks an unfortunate truth: The advanced metrics indicate that Gurley is simply not good at avoiding tackles. That’s a problem.
https://www.youtube.com/watch?v=1zmwK3k21EA
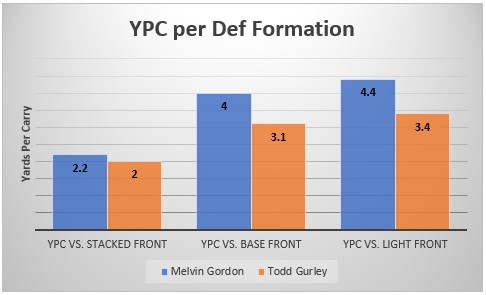
Both Melvin Gordon and Todd Gurley finished 2016 with a YPC under 4.0, which alone, seems discouraging for both players. But we all know that 1 standalone stat, like YPC, does not tell the whole story. A more telling stat is a player’s yards per touch, which includes a player’s involvement in the passing attack.
There Melvin Gordon (ranked No.38 among RBs) steps ahead as his 4.8 yards per touch is a full yard better than Todd Gurley, who had only 3.8, and finished ranked No.75 in that stat for 2016. Gordon was able to produce a full yard more per touch, than Gurley, while seeing a “Stacked” front more than two times as often as Gurley.
Check out Melvin Gordon on the Updated PlayerProfiler Seasonal & Dynasty Rankings:

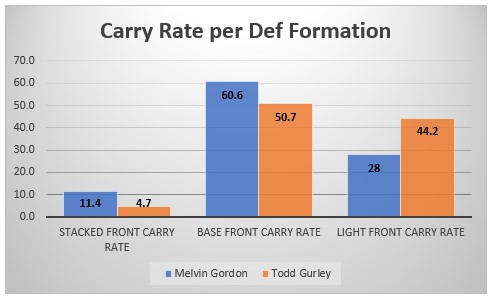
Speaking of stacked fronts, when we pair that up with the aforementioned YPC stat, it also helps us highlight how well each player is doing with their opportunities. In this case, Gordon again shows an advantage as he outperformed Todd Gurley in YPC regardless of the number of defenders at the line of scrimmage.
Whereas Melvin Gordon did perform nearly 2 yards per carry worse against a stacked front in comparison to base or light fronts, I do believe he will see fewer defenders at the line of scrimmage in 2017. His fourth most red zone carries are far more apt to see 8-plus defenders at the line of scrimmage. Especially when you take into account Keenan Allen who missed all of 2016, Travis Benjamin who missed much of it as well, and Hunter Henry who was unknown in the beginning of the year. With everyone healthy, Mike Williams added to the fold, and Henry, a legitimate red zone weapon defenses are well aware of now, the field should open up for Gordon in 2017 as far as defensive formations go, which should increase his efficiency with the ball even more.
Advantage: Melvin Gordon
Fantasy Finishes
Todd Gurley had a much harder 2016 fantasy schedule going up against the more difficult defenses, in terms of fantasy points given up to the running back position, in ten games versus only four games for Melvin Gordon. To find out how this could affect their 2017 outlook, I wanted to research their individual weekly finishes compared to their defensive matchup. Gordon, again, finished higher or tied against each matchup compared to Gurley.
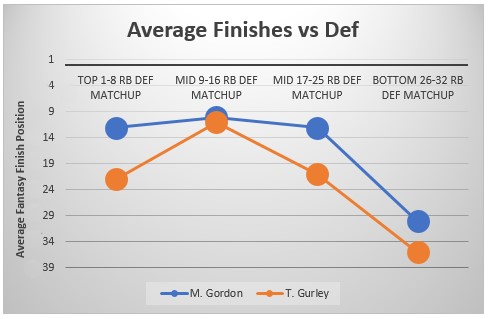
Furthermore, it does not bode well for Todd Gurley in 2017. Whereas Melvin Gordon only matches up against 3 of the most friendly matchups for a running back in 2017 (based on 2016 points given up to the RB Position), he has 5 matchups vs the mid 9-16 ranked matchups and only 3 against the worst matchups for RB. Gurley, however, sees none against the second tier of RB friendly defenses (9-16) and 11 against the bottom half of RB matchup teams, 7 of those 11 are against the hardest opponents for RBs. Now I never recommend taking strength of schedule too seriously during the offseason. A lot of things have and will change between the end of the 2016 season and the start of the 2017 season. But looking at how the two players would finish on average against the strength of their opponents and getting a general idea of their upcoming schedule can be a good tiebreaker, or in this case, give us some idea of who is going to finish higher at year end. Since Gurley has 11 unfavorable matchups, 7 of which are against the toughest opponents from a year ago, compared to Gordon’s 7 unfavorable matchups in total, means Gordon has an easier path to a higher fantasy finish in 2017.
Advantage: Melvin Gordon
Conclusion: Get Melvin Gordon
Todd Gurley’s Production Premium grade moved in the wrong direction from 2015 (+10.1) to 2016 (-24.4) whereas Melvin Gordon’s did the exact opposite moving from -24.1 to -0.2 in 2016. That trend should continue in 2017 as Gordon seemingly has every advantage over Gurley when it comes to opportunities, efficiency, and week to week fantasy finishes. This changes my rankings of Gordon and Gurley and means I still have few kinks in my projections model to work out when it comes to young players with only a few seasons of stats to measure out.

