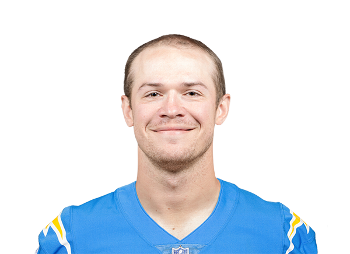
Tyler Huntley Re-Signs With Ravens
Baltimore Ravens quarterback Tyler Huntley has re-signed ...
Year Year | Games Played Games | Pass Attempts Atts | Passing Yards Pass Yds | Completion Percentage Comp % | Yards Per Attempt YPA | Rushing Yards Rush Yds | Passing Touchdowns Pass TD | Fantasy Points Per Game Fantasy Pts/Game |
---|---|---|---|---|---|---|---|---|
2022 | 6 | 112 | 658 | 67.0% | 5.9 | 137 (1 td) | 2 | 8.8 |
2021 | 7 | 188 | 1081 | 64.9% | 5.8 | 294 (2 td) | 3 | 12.4 |
2020 | 2 | 5 | 15 | 60.0% | 3.0 | 23 (0 td) | 0 | 1.5 |
Pass Attempts Pass Atts | Deep Ball Attempts Deep Ball Atts | Red Zone Attempts Red Zone Atts | Team Pass Plays Per Game Team Pass Plays P/G | Pace of Play | Game Script | Protection Rate |
---|---|---|---|---|---|---|
112 (18.7 p/g) | 14 (2.3 p/g) | 15 (2.5 p/g) | 28.7 | 2.00 | +1.30 | 84.0% |
#44 | #42 | #42 | #28 | #24 | #7 | - |
Passing Yards | Air Yards | Money Throws | Pressured Throws | Danger Plays | Interceptable Passes | Passing TDs |
---|---|---|---|---|---|---|
658 (109.7 p/g) | 861 (143.5 p/g) | 2 | 16 | 8 | 8 | 2 (1.8% rate) |
#48 | #43 | #55 | #50 | #47 | #43 | #48 |
Yards Per Attempt YPA | Adjusted Yards Per Attempt (AY/A) AY/A | Air Yards Per Attempt | Best Ball Points Added Best Ball Pts Added | Fantasy Points Per Dropback Fantasy Points Per Dropback | Fantasy Points Per Game Fantasy Points P/G | Expected Fantasy Points Per Game Expected Fantasy Points P/G |
---|---|---|---|---|---|---|
5.9 | 4.7 | 7.7 | 0.0 (0.0 p/g) | 0.45 | 8.8 | 12.69 (-3.85 diff) |
- | - | - | - | - | - | #42 |
Accuracy Rating | True Completion Percentage True Comp % | Deep Ball Completion Percentage Deep Ball Comp % | Pressured Completion Percentage Pressure Comp % | Play-action Completion Percentage Play-action Comp % | Red Zone Completion Percentage Red Zone Comp % | Clean Pocket Completion Percentage Clean Pocket Comp % |
---|---|---|---|---|---|---|
7.6 | 72.1% | 21.4% | 62.5% | 51.6% | 66.7% | 67.7% |
- | - | - | - | - | - | - |
True Passer Rating | QBR | Expected Points Added (EPA) EPA | Production Premium | Receiver Target Separation | Receiver Yards After Catch Per Target Receiver YAC Per Target | Dropped Passes Drops |
---|---|---|---|---|---|---|
62.9 | - | -7.2 | -24.3 | 1.64 | 2.74 | 4 (0.67 p/g) |
- | - | #63 | - | #78 | #79 | #44 |
Red Zone Accuracy Rating Red Zone Accuracy Rating | Deep Ball Accuracy Rating Deep Ball Accuracy Rating | Under Pressure Accuracy Rating Pressured Accuracy Rating | Clean Pocket Accuracy Rating Clean Pocket Accuracy Rating | Deep Ball Catchable Pass Rate Deep Ball Catchable Pass Rate | Pressured Catchable Pass Rate Pressured Catchable Pass Rate | Catchable Pass Rate |
---|---|---|---|---|---|---|
7.0 | 4.4 | 6.5 | 7.5 | 30.8% | 76.2% | 77.7% |
- | - | - | - | - | - | #19 |
Man Coverage Throw Rate | Completion Percentage vs Man Comp % vs Man | Completion Percentage vs Zone Comp % vs Zone | Passer Rating vs Man | Passer Rating vs Zone | Accuracy Rating vs Man | Accuracy Rating vs Zone |
---|---|---|---|---|---|---|
51.3% (48.8% vs zone) | 56.1% | 89.7% | 81.4 | 111.9 | 7.3 | 8.4 |
#69 | #69 | #69 | #69 | #69 | #69 | #69 |
Carries | Carries Per Game | Red Zone Carries | RZ Carries Per Game RZ Carries P/G | Rushing Yards | Rush Yards Per Game Rush Yards P/G | Rush TDs |
---|---|---|---|---|---|---|
43 | 7.2 | 11 | 1.8 | 137 | 22.8 | 1 |
#18 | #7 | #11 | #4 | #18 | #14 | #20 |
Pass Attempts Pass Atts | Deep Ball Attempts Deep Ball Atts | Red Zone Attempts Red Zone Atts | Team Pass Plays Per Game Team Pass Plays P/G | Pace of Play | Game Script | Protection Rate |
---|---|---|---|---|---|---|
188 (26.9 p/g) | 18 (2.6 p/g) | 28 (4.0 p/g) | 35.6 | 1.98 | -1.29 | 86.9% |
#34 | #37 | #33 | #7 | #17 | #22 | - |
Passing Yards | Air Yards | Money Throws | Pressured Throws | Danger Plays | Interceptable Passes | Passing TDs |
---|---|---|---|---|---|---|
1081 (154.4 p/g) | 1430 (204.3 p/g) | 12 | 29 | 10 | 7 | 3 (1.6% rate) |
#36 | #35 | #32 | #38 | #40 | #43 | #45 |
Yards Per Attempt YPA | Adjusted Yards Per Attempt (AY/A) AY/A | Air Yards Per Attempt | Best Ball Points Added Best Ball Pts Added | Fantasy Points Per Dropback Fantasy Points Per Dropback | Fantasy Points Per Game Fantasy Points P/G | Expected Fantasy Points Per Game Expected Fantasy Points P/G |
---|---|---|---|---|---|---|
5.8 | 4.7 | 7.6 | 17.3 (2.5 p/g) | 0.42 | 12.4 | 15.73 (-3.35 diff) |
- | - | - | #22 | - | - | - |
Accuracy Rating | True Completion Percentage True Comp % | Deep Ball Completion Percentage Deep Ball Comp % | Pressured Completion Percentage Pressure Comp % | Play-action Completion Percentage Play-action Comp % | Red Zone Completion Percentage Red Zone Comp % | Clean Pocket Completion Percentage Clean Pocket Comp % |
---|---|---|---|---|---|---|
7.6 | 70.5% | 22.2% | 31.0% | 43.3% | 67.9% | 71.1% |
- | - | - | - | - | - | - |
True Passer Rating | QBR | Expected Points Added (EPA) EPA | Production Premium | Receiver Target Separation | Receiver Yards After Catch Per Target Receiver YAC Per Target | Dropped Passes Drops |
---|---|---|---|---|---|---|
75.8 | - | +0.5 | -18.8 | 1.81 | 2.79 | 10 (1.43 p/g) |
- | - | #52 | - | #22 | #81 | #35 |
Red Zone Accuracy Rating Red Zone Accuracy Rating | Deep Ball Accuracy Rating Deep Ball Accuracy Rating | Under Pressure Accuracy Rating Pressured Accuracy Rating | Clean Pocket Accuracy Rating Clean Pocket Accuracy Rating | Deep Ball Catchable Pass Rate Deep Ball Catchable Pass Rate | Pressured Catchable Pass Rate Pressured Catchable Pass Rate | Catchable Pass Rate |
---|---|---|---|---|---|---|
6.8 | 5.9 | 6.6 | 7.3 | 52.9% | 61.3% | 75.5% |
- | - | - | - | - | - | #25 |
Man Coverage Throw Rate | Completion Percentage vs Man Comp % vs Man | Completion Percentage vs Zone Comp % vs Zone | Passer Rating vs Man | Passer Rating vs Zone | Accuracy Rating vs Man | Accuracy Rating vs Zone |
---|---|---|---|---|---|---|
51.5% (48.5% vs zone) | 61.8% | 70.3% | 87.2 | 87.4 | 7.4 | 7.7 |
#75 | #75 | #75 | #75 | #75 | #75 | #75 |
Carries | Carries Per Game | Red Zone Carries | RZ Carries Per Game RZ Carries P/G | Rushing Yards | Rush Yards Per Game Rush Yards P/G | Rush TDs |
---|---|---|---|---|---|---|
47 | 6.7 | 6 | 0.9 | 294 | 42.0 | 2 |
#16 | #4 | #29 | #13 | #12 | #4 | #14 |
Pass Attempts Pass Atts | Deep Ball Attempts Deep Ball Atts | Red Zone Attempts Red Zone Atts | Team Pass Plays Per Game Team Pass Plays P/G | Pace of Play | Game Script | Protection Rate |
---|---|---|---|---|---|---|
5 | 2 (1.0 p/g) | 0 (0.0 p/g) | 25.4 | 1.77 | +6.62 | 80.0% |
#73 | #63 | #69 | #79 | #32 | #1 | - |
Passing Yards | Air Yards | Money Throws | Pressured Throws | Danger Plays | Interceptable Passes | Passing TDs |
---|---|---|---|---|---|---|
15 (7.5 p/g) | 71 (35.5 p/g) | 0 | 2 | 0 | 0 | 0 (0.0% rate) |
#76 | #70 | #60 | #65 | #72 | #69 | #62 |
Yards Per Attempt YPA | Adjusted Yards Per Attempt (AY/A) AY/A | Air Yards Per Attempt | Best Ball Points Added Best Ball Pts Added | Fantasy Points Per Dropback Fantasy Points Per Dropback | Fantasy Points Per Game Fantasy Points P/G | Expected Fantasy Points Per Game Expected Fantasy Points P/G |
---|---|---|---|---|---|---|
3.0 | 3.0 | 14.2 | 0.0 (0.0 p/g) | 0.58 | 1.5 | - |
- | - | - | #42 | - | - | - |
Accuracy Rating | True Completion Percentage True Comp % | Deep Ball Completion Percentage Deep Ball Comp % | Pressured Completion Percentage Pressure Comp % | Play-action Completion Percentage Play-action Comp % | Red Zone Completion Percentage Red Zone Comp % | Clean Pocket Completion Percentage Clean Pocket Comp % |
---|---|---|---|---|---|---|
7.0 | 60.0% | 0.0% | 50.0% | 0.0% | 0.0% | 66.7% |
- | - | - | - | - | - | - |
True Passer Rating | QBR | Expected Points Added (EPA) EPA | Production Premium | Receiver Target Separation | Receiver Yards After Catch Per Target Receiver YAC Per Target | Dropped Passes Drops |
---|---|---|---|---|---|---|
64.6 | - | -14.5 | -78.0 | 1.75 | 3.12 | 0 (0.00 p/g) |
- | - | #77 | #79 | #20 | #51 | #65 |
Red Zone Accuracy Rating Red Zone Accuracy Rating | Deep Ball Accuracy Rating Deep Ball Accuracy Rating | Under Pressure Accuracy Rating Pressured Accuracy Rating | Clean Pocket Accuracy Rating Clean Pocket Accuracy Rating | Deep Ball Catchable Pass Rate Deep Ball Catchable Pass Rate | Pressured Catchable Pass Rate Pressured Catchable Pass Rate | Catchable Pass Rate |
---|---|---|---|---|---|---|
- | - | - | - | - | - | 80.0% |
- | - | - | - | - | - | #79 |
Carries | Carries Per Game | Red Zone Carries | RZ Carries Per Game RZ Carries P/G | Rushing Yards | Rush Yards Per Game Rush Yards P/G | Rush TDs |
---|---|---|---|---|---|---|
10 | 5.0 | 0 | 0.0 | 23 | 11.5 | 0 |
#42 | #10 | #56 | #54 | #42 | - | #39 |
Week Wk | Opponent Opp | Attempts Attempts | Completion Percentage Completion Percentage | Passing Yards Passing Yards | Yards Per Attempt Yards Per Attempt | Passing Touchdowns Passing Touchdowns | Rushing Yards Rushing Yards | Rushing Touchdowns Rushing Touchdowns | Fantasy Points Fantasy Points |
---|---|---|---|---|---|---|---|---|---|
12 | JAX | 0 | 0.0% | 0 | 0.0 | 0 | 0 | 0 | 0.0 (#34) |
13 | DEN | 32 | 84.4% | 187 (210 air) | 5.8 | 0 (1 int) | 41 | 1 | 16.6 (#15) |
14 | PIT | 12 | 66.7% | 88 (83 air) | 7.3 | 0 | 31 | 0 | 6.6 (#26) |
15 | CLE | 30 | 56.7% | 138 (205 air) | 4.6 | 0 (1 int) | 15 | 0 | 6.0 (#31) |
16 | ATL | 17 | 52.9% | 115 (201 air) | 6.8 | 1 | 26 | 0 | 13.2 (#18) |
17 | PIT | 21 | 66.7% | 130 (162 air) | 6.2 | 1 (1 int) | 24 | 0 | 10.6 (#21) |
19 | CIN | 29 | 58.6% | 226 (187 air) | 7.8 | 2 (1 int) | 54 | 0 | 19.4 (#9) |
Week Wk | Opponent Opp | Attempts Attempts | Completion Percentage Completion Percentage | Passing Yards Passing Yards | Yards Per Attempt Yards Per Attempt | Passing Touchdowns Passing Touchdowns | Rushing Yards Rushing Yards | Rushing Touchdowns Rushing Touchdowns | Fantasy Points Fantasy Points |
---|---|---|---|---|---|---|---|---|---|
6 | LAC | 0 | 0.0% | 0 | 0.0 | 0 | 10 | 0 | 1.0 (#30) |
7 | CIN | 11 | 45.5% | 39 (142 air) | 3.5 | 0 | 0 | 0 | 1.6 (#31) |
11 | CHI | 36 | 72.2% | 219 (224 air) | 6.1 | 0 (1 int) | 40 | 0 | 11.8 (#18) |
14 | CLE | 38 | 71.1% | 270 (292 air) | 7.1 | 1 | 45 | 0 | 15.3 (#19) |
15 | GB | 40 | 70.0% | 215 (252 air) | 5.4 | 2 | 73 | 2 | 35.9 (#1) |
17 | LAR | 32 | 62.5% | 197 (251 air) | 6.2 | 0 (1 int) | 54 | 0 | 12.3 (#21) |
18 | PIT | 31 | 51.6% | 141 (269 air) | 4.5 | 0 (2 int) | 72 | 0 | 8.8 (#33) |
Week Wk | Opponent Opp | Attempts Attempts | Completion Percentage Completion Percentage | Passing Yards Passing Yards | Yards Per Attempt Yards Per Attempt | Passing Touchdowns Passing Touchdowns | Rushing Yards Rushing Yards | Rushing Touchdowns Rushing Touchdowns | Fantasy Points Fantasy Points |
---|---|---|---|---|---|---|---|---|---|
15 | JAX | 4 | 50.0% | 7 (66 air) | 1.8 | 0 | 18 | 0 | 2.1 (#37) |
17 | CIN | 1 | 100.0% | 8 (5 air) | 8.0 | 0 | 5 | 0 | 0.8 (#36) |
Value Over Stream: Valuation scheme calculates a player’s fantasy pts/game over the average waiver wire replacement in standard fantasy league formats during either the current season (or previous year during the offseason) and adjusts for positional bust rates. VOS rank in parenthesis spans all positions, enabling player comparisons across QB's, RB's, WR's, and TE's.
Baltimore Ravens quarterback Tyler Huntley has re-signed ...
The Baltimore Ravens will use the low restricted free-agent ...
Baltimore Ravens quarterback Tyler Huntley has been named ...
Player Popularity Index (PPI) ranks PlayerProfiler page views over the last 30 days. For example, the No. 1 PPI player page is the most frequently visited page in recent weeks.
Year Year | Games Games | Pass Attempts Pass Atts | Passing Yards Pass Yds | Yards Per Attempt YPA | Completion Percentage Comp % | Passing Touchdowns Pass TDs | Rushing Yards Rush Yds | Age Age | School School |
---|---|---|---|---|---|---|---|---|---|
2016 | 4 (QB) | 7 | 60 | 8.6 | 57.1% | 0 | 15 | 19 | Utah |
2017 | 10 (QB) | 312 | 2,411 | 7.7 | 63.80% | 15 (10 ints) | 537 | 20 | Utah |
2018 | 9 (QB) | 234 | 1,788 | 7.64 | 64.10% | 12 (6 ints) | 304 | 21 | Utah |
2019 | 14 (QB) | 301 | 3,092 | 10.3 | 73.09% | 19 (4 ints) | 290 | 22 | Utah |
When Tyler Huntley did throw, his college stats were solid, leading the 2019 Pac-12 with a 10.3 (93rd-percentile) Yards per Attempt, 73.1-percent Completion Percentage and 8.4 Yards Per Play; besting, among others, Oregon’s Justin Herbert in all these categories. His career 8.6 Yards per Attempt ranks third in Pac-12 history, behind only Marcus Mariota and Andrew Luck. While he rushed quite a bit for the Utes, he was not particularly effective, posting only 2.9 Yards Per Carry across 389 career rushes.
Despite leading his team to a Rose Bowl appearance, Huntley's Pac-12 numbers, an 80.5 (73rd-percentile) College QBR and a 4.61 (92nd-percentile) 40 time, Huntley went undrafted in 2020. He eventually signed with the Ravens to back up Jackson and Robert Griffin III. During his rookie year, he saw just a handful of late-season snaps, mop-up duty in routes over Jacksonville and Cincinnati.
In 2021, Huntley returned as backup to Jackson, this time alongside Josh Johnson. When Lamar was ruled out due to illness for Week 11 vs Chicago, John Harbaugh turned to Huntley, who responded by helping the Ravens overcome two fourth-quarter deficits & pull off a last-minute win. Jackson returned the next week, but left early in Week 14 due an ankle injury. Again, enter Huntley. This time, in just under three quarters, he threw for 270 yards and a score, and rushed for 45 more yards. While his efforts fell short by a two-point conversion in the final minute, he showed enough poise to be given three more starts the rest of the way.
Huntley didn’t post particularly strong passing efficiency metrics in 2021, finishing outside the top 32 in air yards, yards per attempt, deep ball completion percentage, completion percentage under pressure and No. 24 in Next Gen Stats’ Expected Completion Percentage. Most importantly for Huntley, though, he earned the confidence of Baltimore’s coaching staff. In Huntley’s four starts, with the help of his rushing yards - his 6.3 yards per carry just slightly behind those of teammate Lamar Jackson, Huntley posted one No. 1 overall QB fantasy ranking and two QB2 performances.