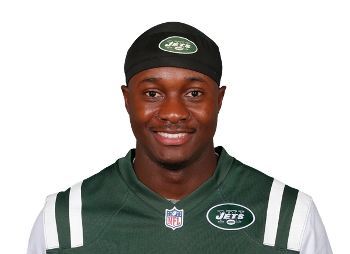
Bilal Powell Officially Retires
Running back Bilal Powell signed a one-day contract on ...
Year Year | Games Played Games | Rush Attempts Atts | Rush Yards Rush Yds | Yards Per Carry YPC | Receptions Rec | Receiving Yards Rec Yds | Total Touchdowns TD | Fantasy Points Per Game Fantasy Pts/Game |
---|---|---|---|---|---|---|---|---|
2019 | 12 | 59 | 229 | 3.9 | 7 | 33 | 0 | 2.8 (#81) |
2018 | 7 | 80 | 343 | 4.3 | 11 | 110 | 1 | 8.6 |
2017 | 15 | 178 | 772 | 4.3 | 23 | 170 | 5 | 9.7 (#31) |
2016 | 16 | 131 | 722 | 5.5 | 58 | 388 | 4 | 11.9 (#23) |
2015 | 11 | 70 | 313 | 4.5 | 47 | 388 | 3 | 12.3 (#16) |
2014 | 14 | 33 | 141 | 4.3 | 11 | 92 | 1 | 2.9 (#87) |
2013 | 16 | 176 | 697 | 4.0 | 36 | 272 | 1 | 8.8 (#39) |
2012 | 14 | 110 | 437 | 4.0 | 17 | 140 | 4 | 7.0 (#42) |
2011 | 2 | 13 | 21 | 1.6 | 1 | 7 | 0 | 1.9 |
Snap Share | Opportunity Share | Weighted Opportunities | Team Run Plays Per Game Team Run Plays/Gm | Carries | Targets | Red Zone Touches |
---|---|---|---|---|---|---|
21.2% | 20.9% | 54.2 (4.5 p/g) | - (0.00 pace) | 59 (4.9 p/g) | 12 (1.0 p/g) | 6 (0 gl) |
#92 | #72 | #72 | - | #62 | #77 | #78 |
Rushing Yards | Receiving Yards | Receptions | Total TDs | Fantasy Points Per Opportunity Fantasy Pts/Opportunity | Fantasy Points Per Game | Expected Fantasy Points Per Game Expected Fantasy Pts/Gm |
---|---|---|---|---|---|---|
229 (19.1 p/g) | 33 (2.8 p/g) | 7 (0.6 p/g) | 0 (0.0% rate) | 0.47 | 2.8 | - |
#62 | #103 | #85 | #96 | #127 | #81 | - |
Target Share | Routes Run | Route Participation Route % | Yards Per Reception | Yards Per Route Run | Catch Rate Catch Rate | Drops |
---|---|---|---|---|---|---|
3.2% | 45 (3.8 p/g) | 11.4% | 4.7 (2.8 ypt) | 0.73 | 58.3% | 3 (25.0% rate) |
- | #77 | - | - | - | - | #20 |
True Yards Per Carry | Yards Per Touch | Juke Rate | Evaded Tackles | Breakaway Run Rate | Breakaway Runs | Best Ball Points Added |
---|---|---|---|---|---|---|
3.8 (3.9 ypc) | 4.0 | 13.6% | 9 (0.8 p/g) | 1.7% | 1 (0.1 p/g) | 2.5 (0.20 p/g) |
#47 | - | - | #76 | - | #63 | #86 |
Yards Created | Yards Created Per Touch Yards Created/Touch | Production Premium | Expected Points Added (EPA) Expected Pts Added | Dominator Rating | Game Script | Run Blocking Rating |
---|---|---|---|---|---|---|
52 (4.3 p/g) | 0.79 | -39.9 | -3.5 | 7.1% | 0.00 | 72.4 |
#71 | - | #76 | #39 | #86 | - | #27 |
Average Defenders In The Box Defenders In The Box | Stacked Front Carry Rate Stacked Front Carry % | Base Front Carry Rate Base Front Carry % | Light Front Carry Rate Light Front Carry % | Shotgun Carry Rate Shotgun Carry % | Under Center Carry Rate Under Center Carry % | Stuffed Runs |
---|---|---|---|---|---|---|
6.8 | 20.3% (2.8 ypc) | 42.4% (4.1 ypc) | 37.3% (4.2 ypc) | 44.1% (4.3 ypc) | 55.9% (3.5 ypc) | 13 (21.7% rate) |
#24 | - | #38 | - | - | - | #57 |
Snap Share | Opportunity Share | Weighted Opportunities | Team Run Plays Per Game Team Run Plays/Gm | Carries | Targets | Red Zone Touches |
---|---|---|---|---|---|---|
47.6% | 47.6% | 76.3 (10.9 p/g) | - (0.00 pace) | 80 (11.4 p/g) | 18 (2.6 p/g) | 10 (0 gl) |
#38 | #31 | #65 | - | #56 | #68 | #66 |
Rushing Yards | Receiving Yards | Receptions | Total TDs | Fantasy Points Per Opportunity Fantasy Pts/Opportunity | Fantasy Points Per Game | Expected Fantasy Points Per Game Expected Fantasy Pts/Gm |
---|---|---|---|---|---|---|
343 (49.0 p/g) | 110 (15.7 p/g) | 11 (1.6 p/g) | 1 (1.1% rate) | 0.62 | 8.6 | - |
#54 | #62 | #72 | #73 | #104 | - | - |
Target Share | Routes Run | Route Participation Route % | Yards Per Reception | Yards Per Route Run | Catch Rate Catch Rate | Drops |
---|---|---|---|---|---|---|
8.3% | 65 (9.3 p/g) | 29.4% | 10.0 (6.1 ypt) | 1.69 | 61.1% | 1 (5.6% rate) |
- | #68 | - | - | - | - | #49 |
True Yards Per Carry | Yards Per Touch | Juke Rate | Evaded Tackles | Breakaway Run Rate | Breakaway Runs | Best Ball Points Added |
---|---|---|---|---|---|---|
4.1 (4.3 ypc) | 5.0 | 18.7% | 17 (2.4 p/g) | 5.0% | 4 (0.6 p/g) | 9.5 (1.40 p/g) |
#41 | #29 | #47 | #65 | #26 | #43 | #76 |
Yards Created | Yards Created Per Touch Yards Created/Touch | Production Premium | Expected Points Added (EPA) Expected Pts Added | Dominator Rating | Game Script | Run Blocking Rating |
---|---|---|---|---|---|---|
127 (18.1 p/g) | 1.40 | -17.5 | - | 12.5% | 0.00 | - |
#51 | #27 | #62 | - | #55 | - | - |
Average Defenders In The Box Defenders In The Box | Stacked Front Carry Rate Stacked Front Carry % | Base Front Carry Rate Base Front Carry % | Light Front Carry Rate Light Front Carry % | Shotgun Carry Rate Shotgun Carry % | Under Center Carry Rate Under Center Carry % | Stuffed Runs |
---|---|---|---|---|---|---|
6.9 | 25.0% (4.8 ypc) | 40.0% (4.3 ypc) | 35.0% (3.9 ypc) | 28.7% (4.6 ypc) | 71.2% (4.2 ypc) | 17 (21.2% rate) |
#29 | #18 | #72 | #31 | #34 | #27 | #50 |
Snap Share | Opportunity Share | Weighted Opportunities | Team Run Plays Per Game Team Run Plays/Gm | Carries | Targets | Red Zone Touches |
---|---|---|---|---|---|---|
42.8% | 46.4% | 158.6 (10.6 p/g) | - (0.00 pace) | 178 (11.9 p/g) | 33 (2.2 p/g) | 24 (7 gl) |
#41 | #32 | #29 | - | #23 | #48 | #30 |
Rushing Yards | Receiving Yards | Receptions | Total TDs | Fantasy Points Per Opportunity Fantasy Pts/Opportunity | Fantasy Points Per Game | Expected Fantasy Points Per Game Expected Fantasy Pts/Gm |
---|---|---|---|---|---|---|
772 (51.5 p/g) | 170 (11.3 p/g) | 23 (1.5 p/g) | 5 (2.5% rate) | 0.69 | 9.7 | - |
#21 | #52 | #46 | #29 | #86 | #31 | - |
Target Share | Routes Run | Route Participation Route % | Yards Per Reception | Yards Per Route Run | Catch Rate Catch Rate | Drops |
---|---|---|---|---|---|---|
7.3% | 92 (6.1 p/g) | 19.9% | 7.4 (5.2 ypt) | 1.85 | 69.7% | 2 (6.1% rate) |
- | #52 | - | - | - | - | #38 |
True Yards Per Carry | Yards Per Touch | Juke Rate | Evaded Tackles | Breakaway Run Rate | Breakaway Runs | Best Ball Points Added |
---|---|---|---|---|---|---|
3.7 (4.3 ypc) | 4.7 | 28.9% | 58 (3.9 p/g) | 5.1% | 9 (0.6 p/g) | 42.9 (2.90 p/g) |
#36 | #25 | #10 | #16 | #13 | #13 | #32 |
Yards Created | Yards Created Per Touch Yards Created/Touch | Production Premium | Expected Points Added (EPA) Expected Pts Added | Dominator Rating | Game Script | Run Blocking Rating |
---|---|---|---|---|---|---|
371 (24.7 p/g) | 1.85 | -15.1 | - | 18.2% | 0.00 | - |
#12 | #6 | #62 | - | #30 | - | - |
Average Defenders In The Box Defenders In The Box | Stacked Front Carry Rate Stacked Front Carry % | Base Front Carry Rate Base Front Carry % | Light Front Carry Rate Light Front Carry % | Shotgun Carry Rate Shotgun Carry % | Under Center Carry Rate Under Center Carry % | Stuffed Runs |
---|---|---|---|---|---|---|
0.0 | 5.1% (0.2 ypc) | 55.1% (4.3 ypc) | 39.3% (4.9 ypc) | 0.0% (0.0 ypc) | 0.0% (0.0 ypc) | 53 (29.8% rate) |
- | #26 | #65 | #29 | - | - | #8 |
Snap Share | Opportunity Share | Weighted Opportunities | Team Run Plays Per Game Team Run Plays/Gm | Carries | Targets | Red Zone Touches |
---|---|---|---|---|---|---|
0.0% | 41.4% | 196.4 (12.3 p/g) | - (0.00 pace) | 131 (8.2 p/g) | 75 (4.7 p/g) | 31 (1 gl) |
- | #42 | #16 | - | #31 | #4 | #26 |
Rushing Yards | Receiving Yards | Receptions | Total TDs | Fantasy Points Per Opportunity Fantasy Pts/Opportunity | Fantasy Points Per Game | Expected Fantasy Points Per Game Expected Fantasy Pts/Gm |
---|---|---|---|---|---|---|
722 (45.1 p/g) | 388 (24.2 p/g) | 58 (3.6 p/g) | 4 (2.1% rate) | 0.93 | 11.9 | - |
#23 | #10 | #4 | #40 | #43 | #23 | - |
Target Share | Routes Run | Route Participation Route % | Yards Per Reception | Yards Per Route Run | Catch Rate Catch Rate | Drops |
---|---|---|---|---|---|---|
13.7% | - (0.0 p/g) | 0.0% | 6.7 (5.2 ypt) | 0.00 | 77.3% | 3 (4.0% rate) |
#6 | - | - | #30 | - | #16 | #11 |
True Yards Per Carry | Yards Per Touch | Juke Rate | Evaded Tackles | Breakaway Run Rate | Breakaway Runs | Best Ball Points Added |
---|---|---|---|---|---|---|
5.3 (5.5 ypc) | 5.9 | 29.6% | 56 (3.5 p/g) | 6.9% | 9 (0.6 p/g) | 85.3 (5.30 p/g) |
#3 | #7 | #7 | #15 | #9 | #15 | #17 |
Yards Created | Yards Created Per Touch Yards Created/Touch | Production Premium | Expected Points Added (EPA) Expected Pts Added | Dominator Rating | Game Script | Run Blocking Rating |
---|---|---|---|---|---|---|
268 (16.8 p/g) | 1.42 | +3.3 | - | 17.9% | 0.00 | - |
#17 | #13 | #27 | - | #33 | - | - |
Average Defenders In The Box Defenders In The Box | Stacked Front Carry Rate Stacked Front Carry % | Base Front Carry Rate Base Front Carry % | Light Front Carry Rate Light Front Carry % | Shotgun Carry Rate Shotgun Carry % | Under Center Carry Rate Under Center Carry % | Stuffed Runs |
---|---|---|---|---|---|---|
0.0 | 2.3% (1.7 ypc) | 36.6% (5.3 ypc) | 61.1% (5.8 ypc) | 0.0% (0.0 ypc) | 0.0% (0.0 ypc) | 17 (13.0% rate) |
- | #53 | #103 | #10 | - | - | #46 |
Snap Share | Opportunity Share | Weighted Opportunities | Team Run Plays Per Game Team Run Plays/Gm | Carries | Targets | Red Zone Touches |
---|---|---|---|---|---|---|
0.0% | 34.6% | 140.9 (12.8 p/g) | - (0.00 pace) | 70 (6.4 p/g) | 63 (5.7 p/g) | 11 (0 gl) |
- | #53 | #38 | - | #58 | #8 | #62 |
Rushing Yards | Receiving Yards | Receptions | Total TDs | Fantasy Points Per Opportunity Fantasy Pts/Opportunity | Fantasy Points Per Game | Expected Fantasy Points Per Game Expected Fantasy Pts/Gm |
---|---|---|---|---|---|---|
313 (28.5 p/g) | 388 (35.3 p/g) | 47 (4.3 p/g) | 3 (2.6% rate) | 1.02 | 12.3 | - |
#54 | #13 | #9 | #44 | #29 | #16 | - |
Target Share | Routes Run | Route Participation Route % | Yards Per Reception | Yards Per Route Run | Catch Rate Catch Rate | Drops |
---|---|---|---|---|---|---|
15.3% | - (0.0 p/g) | 0.0% | 8.3 (6.2 ypt) | 0.00 | 74.6% | - (0.0% rate) |
#4 | - | - | #19 | - | #23 | - |
True Yards Per Carry | Yards Per Touch | Juke Rate | Evaded Tackles | Breakaway Run Rate | Breakaway Runs | Best Ball Points Added |
---|---|---|---|---|---|---|
4.3 (4.5 ypc) | 6.0 | 29.9% | 35 (3.2 p/g) | 0.0% | - (0.0 p/g) | 58.5 (5.30 p/g) |
#14 | #5 | #13 | #42 | - | - | #26 |
Yards Created | Yards Created Per Touch Yards Created/Touch | Production Premium | Expected Points Added (EPA) Expected Pts Added | Dominator Rating | Game Script | Run Blocking Rating |
---|---|---|---|---|---|---|
- (0.0 p/g) | 0.00 | +22.9 | - | 12.8% | 0.00 | - |
- | - | #16 | - | #53 | - | - |
Average Defenders In The Box Defenders In The Box | Stacked Front Carry Rate Stacked Front Carry % | Base Front Carry Rate Base Front Carry % | Light Front Carry Rate Light Front Carry % | Shotgun Carry Rate Shotgun Carry % | Under Center Carry Rate Under Center Carry % | Stuffed Runs |
---|---|---|---|---|---|---|
0.0 | 0.0% (0.0 ypc) | 0.0% (0.0 ypc) | 0.0% (0.0 ypc) | 0.0% (0.0 ypc) | 0.0% (0.0 ypc) | 13 (18.6% rate) |
- | - | #23 | - | - | - | #59 |
Snap Share | Opportunity Share | Weighted Opportunities | Team Run Plays Per Game Team Run Plays/Gm | Carries | Targets | Red Zone Touches |
---|---|---|---|---|---|---|
0.0% | 11.4% | 43.4 (3.1 p/g) | - (0.00 pace) | 33 (2.4 p/g) | 15 (1.1 p/g) | 10 (3 gl) |
- | - | - | - | #86 | #72 | #67 |
Rushing Yards | Receiving Yards | Receptions | Total TDs | Fantasy Points Per Opportunity Fantasy Pts/Opportunity | Fantasy Points Per Game | Expected Fantasy Points Per Game Expected Fantasy Pts/Gm |
---|---|---|---|---|---|---|
141 (10.1 p/g) | 92 (6.6 p/g) | 11 (0.8 p/g) | 1 (2.3% rate) | 0.84 | 2.9 | - |
#85 | #72 | #70 | #78 | #50 | #87 | - |
Target Share | Routes Run | Route Participation Route % | Yards Per Reception | Yards Per Route Run | Catch Rate Catch Rate | Drops |
---|---|---|---|---|---|---|
3.6% | - (0.0 p/g) | 0.0% | 8.4 (6.1 ypt) | 0.00 | 73.3% | - (0.0% rate) |
- | - | - | - | - | - | - |
True Yards Per Carry | Yards Per Touch | Juke Rate | Evaded Tackles | Breakaway Run Rate | Breakaway Runs | Best Ball Points Added |
---|---|---|---|---|---|---|
4.2 (4.3 ypc) | 5.3 | 0.0% | - (0.0 p/g) | 0.0% | - (0.0 p/g) | - |
- | - | - | - | - | - | - |
Yards Created | Yards Created Per Touch Yards Created/Touch | Production Premium | Expected Points Added (EPA) Expected Pts Added | Dominator Rating | Game Script | Run Blocking Rating |
---|---|---|---|---|---|---|
- (0.0 p/g) | 0.00 | -14.6 | - | 4.4% | 0.00 | - |
- | - | - | - | #116 | - | - |
Average Defenders In The Box Defenders In The Box | Stacked Front Carry Rate Stacked Front Carry % | Base Front Carry Rate Base Front Carry % | Light Front Carry Rate Light Front Carry % | Shotgun Carry Rate Shotgun Carry % | Under Center Carry Rate Under Center Carry % | Stuffed Runs |
---|---|---|---|---|---|---|
0.0 | 0.0% (0.0 ypc) | 0.0% (0.0 ypc) | 0.0% (0.0 ypc) | 0.0% (0.0 ypc) | 0.0% (0.0 ypc) | 10 (30.3% rate) |
- | - | #21 | - | - | - | - |
Snap Share | Opportunity Share | Weighted Opportunities | Team Run Plays Per Game Team Run Plays/Gm | Carries | Targets | Red Zone Touches |
---|---|---|---|---|---|---|
0.0% | 48.7% | 195.1 (12.2 p/g) | - (0.00 pace) | 176 (11.0 p/g) | 57 (3.6 p/g) | 22 (3 gl) |
- | #31 | #22 | - | #28 | #20 | #37 |
Rushing Yards | Receiving Yards | Receptions | Total TDs | Fantasy Points Per Opportunity Fantasy Pts/Opportunity | Fantasy Points Per Game | Expected Fantasy Points Per Game Expected Fantasy Pts/Gm |
---|---|---|---|---|---|---|
697 (43.6 p/g) | 272 (17.0 p/g) | 36 (2.2 p/g) | 1 (0.5% rate) | 0.60 | 8.8 | - |
#27 | #27 | #22 | #75 | #111 | #39 | - |
Target Share | Routes Run | Route Participation Route % | Yards Per Reception | Yards Per Route Run | Catch Rate Catch Rate | Drops |
---|---|---|---|---|---|---|
11.9% | - (0.0 p/g) | 0.0% | 7.6 (4.8 ypt) | 0.00 | 63.2% | - (0.0% rate) |
#15 | - | - | #25 | - | #37 | - |
True Yards Per Carry | Yards Per Touch | Juke Rate | Evaded Tackles | Breakaway Run Rate | Breakaway Runs | Best Ball Points Added |
---|---|---|---|---|---|---|
3.8 (4.0 ypc) | 4.6 | 0.0% | - (0.0 p/g) | 0.0% | - (0.0 p/g) | - |
#38 | #28 | - | - | - | - | - |
Yards Created | Yards Created Per Touch Yards Created/Touch | Production Premium | Expected Points Added (EPA) Expected Pts Added | Dominator Rating | Game Script | Run Blocking Rating |
---|---|---|---|---|---|---|
- (0.0 p/g) | 0.00 | -23.0 | - | 10.9% | 0.00 | - |
- | - | #72 | - | #64 | - | - |
Average Defenders In The Box Defenders In The Box | Stacked Front Carry Rate Stacked Front Carry % | Base Front Carry Rate Base Front Carry % | Light Front Carry Rate Light Front Carry % | Shotgun Carry Rate Shotgun Carry % | Under Center Carry Rate Under Center Carry % | Stuffed Runs |
---|---|---|---|---|---|---|
0.0 | 0.0% (0.0 ypc) | 0.0% (0.0 ypc) | 0.0% (0.0 ypc) | 0.0% (0.0 ypc) | 0.0% (0.0 ypc) | 29 (16.5% rate) |
- | - | #22 | - | - | - | #34 |
Snap Share | Opportunity Share | Weighted Opportunities | Team Run Plays Per Game Team Run Plays/Gm | Carries | Targets | Red Zone Touches |
---|---|---|---|---|---|---|
0.0% | 32.8% | 122.5 (8.8 p/g) | - (0.00 pace) | 110 (7.9 p/g) | 36 (2.6 p/g) | 20 (1 gl) |
- | #44 | #40 | - | #36 | #27 | #38 |
Rushing Yards | Receiving Yards | Receptions | Total TDs | Fantasy Points Per Opportunity Fantasy Pts/Opportunity | Fantasy Points Per Game | Expected Fantasy Points Per Game Expected Fantasy Pts/Gm |
---|---|---|---|---|---|---|
437 (31.2 p/g) | 140 (10.0 p/g) | 17 (1.2 p/g) | 4 (3.1% rate) | 0.68 | 7.0 | - |
#36 | #49 | #48 | #31 | #97 | #42 | - |
Target Share | Routes Run | Route Participation Route % | Yards Per Reception | Yards Per Route Run | Catch Rate Catch Rate | Drops |
---|---|---|---|---|---|---|
9.2% | - (0.0 p/g) | 0.0% | 8.2 (3.9 ypt) | 0.00 | 47.2% | - (0.0% rate) |
#22 | - | - | #14 | - | #31 | - |
True Yards Per Carry | Yards Per Touch | Juke Rate | Evaded Tackles | Breakaway Run Rate | Breakaway Runs | Best Ball Points Added |
---|---|---|---|---|---|---|
3.9 (4.0 ypc) | 4.5 | 0.0% | - (0.0 p/g) | 0.0% | - (0.0 p/g) | - |
#32 | #32 | - | - | - | - | - |
Yards Created | Yards Created Per Touch Yards Created/Touch | Production Premium | Expected Points Added (EPA) Expected Pts Added | Dominator Rating | Game Script | Run Blocking Rating |
---|---|---|---|---|---|---|
- (0.0 p/g) | 0.00 | -16.4 | - | 15.5% | 0.00 | - |
- | - | #65 | - | #35 | - | - |
Average Defenders In The Box Defenders In The Box | Stacked Front Carry Rate Stacked Front Carry % | Base Front Carry Rate Base Front Carry % | Light Front Carry Rate Light Front Carry % | Shotgun Carry Rate Shotgun Carry % | Under Center Carry Rate Under Center Carry % | Stuffed Runs |
---|---|---|---|---|---|---|
0.0 | 0.0% (0.0 ypc) | 0.0% (0.0 ypc) | 0.0% (0.0 ypc) | 0.0% (0.0 ypc) | 0.0% (0.0 ypc) | 19 (17.3% rate) |
- | - | #25 | - | - | - | #45 |
Snap Share | Opportunity Share | Weighted Opportunities | Team Run Plays Per Game Team Run Plays/Gm | Carries | Targets | Red Zone Touches |
---|---|---|---|---|---|---|
0.0% | 17.1% | 9.4 (4.7 p/g) | - (0.00 pace) | 13 (6.5 p/g) | 1 (0.5 p/g) | 2 (1 gl) |
- | - | - | - | #111 | #139 | #114 |
Rushing Yards | Receiving Yards | Receptions | Total TDs | Fantasy Points Per Opportunity Fantasy Pts/Opportunity | Fantasy Points Per Game | Expected Fantasy Points Per Game Expected Fantasy Pts/Gm |
---|---|---|---|---|---|---|
21 (10.5 p/g) | 7 (3.5 p/g) | 1 (0.5 p/g) | 0 (0.0% rate) | 0.27 | 1.9 | - |
#124 | #133 | #132 | #100 | #143 | - | - |
Target Share | Routes Run | Route Participation Route % | Yards Per Reception | Yards Per Route Run | Catch Rate Catch Rate | Drops |
---|---|---|---|---|---|---|
1.7% | - (0.0 p/g) | 0.0% | 7.0 (7.0 ypt) | 0.00 | 100.0% | - (0.0% rate) |
- | - | - | - | - | - | - |
True Yards Per Carry | Yards Per Touch | Juke Rate | Evaded Tackles | Breakaway Run Rate | Breakaway Runs | Best Ball Points Added |
---|---|---|---|---|---|---|
1.6 (1.6 ypc) | 2.0 | 0.0% | - (0.0 p/g) | 0.0% | - (0.0 p/g) | - |
- | - | - | - | - | - | - |
Yards Created | Yards Created Per Touch Yards Created/Touch | Production Premium | Expected Points Added (EPA) Expected Pts Added | Dominator Rating | Game Script | Run Blocking Rating |
---|---|---|---|---|---|---|
- (0.0 p/g) | 0.00 | -15.4 | - | 4.1% | 0.00 | - |
- | - | - | - | #107 | - | - |
Average Defenders In The Box Defenders In The Box | Stacked Front Carry Rate Stacked Front Carry % | Base Front Carry Rate Base Front Carry % | Light Front Carry Rate Light Front Carry % | Shotgun Carry Rate Shotgun Carry % | Under Center Carry Rate Under Center Carry % | Stuffed Runs |
---|---|---|---|---|---|---|
0.0 | 0.0% (0.0 ypc) | 0.0% (0.0 ypc) | 0.0% (0.0 ypc) | 0.0% (0.0 ypc) | 0.0% (0.0 ypc) | 4 (30.8% rate) |
- | - | #22 | - | - | - | - |
Week Wk | Opponent Opp | Snap Share Snap Share | Carries Carries | Routes Routes | Targets Targets | Receptions Receptions | Total Yards Total Yards | Total TDs Total TDs | Fantasy Points Fantasy Points |
---|---|---|---|---|---|---|---|---|---|
5 | PHI | 4.4% | 1 (0 rz) | 0 | 0 | 0 | 4 | 0 | 0.4 (##75) |
6 | DAL | 13.5% | 1 (0 rz) | 5 | 1 | 0 | 5 | 0 | 0.5 (##64) |
7 | NE | 7.7% | 1 (0 rz) | 0 | 0 | 0 | 3 | 0 | 0.3 (##70) |
8 | JAC | 15.6% | 4 (0 rz) | 2 | 0 | 0 | 11 | 0 | 1.1 (##67) |
9 | MIA | 8.3% | 2 (0 rz) | 1 | 0 | 0 | 16 | 0 | 1.6 (##59) |
10 | NYG | 16.9% | 7 (0 rz) | 1 | 0 | 0 | 15 | 0 | 1.5 (##52) |
11 | WAS | 25.0% | 7 (1 rz) | 6 | 2 | 1 | 47 | 0 | 5.7 (##46) |
12 | OAK | 16.9% | 5 (2 rz) | 6 | 2 | 1 | 20 | 0 | 3.0 (##52) |
13 | CIN | 18.5% | 4 (0 rz) | 7 | 2 | 2 | 18 | 0 | 3.8 (##52) |
14 | MIA | 80.9% | 20 (2 rz) | 14 | 3 | 2 | 88 | 0 | 10.8 (##29) |
16 | PIT | 6.9% | 1 (0 rz) | 2 | 2 | 1 | 8 | 0 | 1.8 (##66) |
17 | BUF | 22.2% | 7 (0 rz) | 1 | 0 | 0 | 27 | 0 | 2.7 (##58) |
Week Wk | Opponent Opp | Snap Share Snap Share | Carries Carries | Routes Routes | Targets Targets | Receptions Receptions | Total Yards Total Yards | Total TDs Total TDs | Fantasy Points Fantasy Points |
---|---|---|---|---|---|---|---|---|---|
1 | DET | 38.6% | 12 (0 rz) | 5 | 2 | 1 | 65 | 0 | 7.5 (##41) |
2 | MIA | 55.0% | 5 (0 rz) | 17 | 6 | 5 | 80 | 1 | 19.0 (##9) |
3 | CLE | 55.7% | 14 (2 rz) | 12 | 1 | 0 | 73 | 0 | 7.3 (##42) |
4 | JAC | 68.8% | 8 (2 rz) | 15 | 7 | 4 | 52 | 0 | 9.2 (##32) |
5 | DEN | 53.3% | 20 (4 rz) | 9 | 0 | 0 | 99 | 0 | 8.9 (##34) |
6 | IND | 43.9% | 16 (2 rz) | 5 | 1 | 0 | 59 | 0 | 5.9 (##39) |
7 | MIN | 24.2% | 5 (0 rz) | 2 | 1 | 1 | 25 | 0 | 3.5 (##48) |
Week Wk | Opponent Opp | Snap Share Snap Share | Carries Carries | Routes Routes | Targets Targets | Receptions Receptions | Total Yards Total Yards | Total TDs Total TDs | Fantasy Points Fantasy Points |
---|---|---|---|---|---|---|---|---|---|
1 | BUF | 55.6% | 7 (0 rz) | 2 | 6 | 5 | 39 | 0 | 8.9 (##32) |
2 | OAK | 32.0% | 6 (0 rz) | 0 | 2 | 0 | 13 | 0 | 1.3 (##73) |
3 | MIA | 42.1% | 15 (2 rz) | 4 | 0 | 0 | 37 | 1 | 9.7 (##32) |
4 | JAC | 71.9% | 21 (1 rz) | 13 | 5 | 4 | 190 | 1 | 29.0 (##5) |
5 | CLE | 31.2% | 2 (0 rz) | 8 | 5 | 4 | 33 | 0 | 7.3 (##36) |
7 | MIA | 36.7% | 9 (2 rz) | 6 | 2 | 2 | 83 | 0 | 10.3 (##26) |
8 | ATL | 47.3% | 14 (0 rz) | 0 | 3 | 3 | 61 | 0 | 9.1 (##29) |
9 | BUF | 23.0% | 9 (2 rz) | 0 | 0 | 0 | 74 | 0 | 7.4 (##30) |
10 | TB | 53.4% | 10 (0 rz) | 15 | 2 | 1 | 36 | 0 | 3.6 (##57) |
12 | CAR | 32.3% | 9 (1 rz) | 4 | 1 | 1 | 46 | 0 | 5.6 (##44) |
13 | KC | 37.6% | 18 (7 rz) | 3 | 3 | 2 | 50 | 1 | 13.0 (##21) |
14 | DEN | 44.4% | 13 (0 rz) | 4 | 0 | 0 | 35 | 0 | 3.5 (##60) |
15 | NO | 36.4% | 13 (4 rz) | 1 | 1 | 0 | 44 | 1 | 10.4 (##28) |
16 | LAC | 39.7% | 19 (1 rz) | 3 | 1 | 0 | 145 | 1 | 20.5 (##9) |
17 | NE | 58.2% | 13 (0 rz) | 10 | 2 | 1 | 56 | 0 | 6.6 (##40) |
Week Wk | Opponent Opp | Snap Share Snap Share | Carries Carries | Routes Routes | Targets Targets | Receptions Receptions | Total Yards Total Yards | Total TDs Total TDs | Fantasy Points Fantasy Points |
---|---|---|---|---|---|---|---|---|---|
1 | CIN | 26.2% | 4 | - | 4 tgts | 2 | 48 | 0 | 6.8 (##43) |
2 | BUF | 24.3% | 1 | - | 2 tgts | 1 | 3 | 0 | 1.3 (##81) |
3 | KC | 42.4% | 4 | - | 7 tgts | 6 | 71 | 0 | 12.1 (##23) |
4 | SEA | 60.7% | 4 | - | 9 tgts | 6 | 80 | 0 | 14.0 (##20) |
5 | PIT | 49.1% | 4 | - | 8 tgts | 6 | 51 | 0 | 11.1 (##21) |
6 | ARI | 76.5% | 3 | - | 4 tgts | 3 | 22 | 0 | 5.2 (##41) |
7 | BAL | 14.8% | 4 | - | 0 tgts | 0 | 18 | 0 | 1.8 (##61) |
8 | CLE | 43.5% | 6 | - | 3 tgts | 1 | 79 | 1 | 14.9 (##15) |
9 | MIA | 51.0% | 6 | - | 4 tgts | 4 | 43 | 0 | 8.3 (##27) |
10 | LA | 56.1% | 4 | - | 7 tgts | 7 | 85 | 1 | 15.5 (##10) |
12 | NE | 50.9% | 8 | - | 3 tgts | 1 | 43 | 0 | 5.3 (##45) |
13 | IND | 54.9% | 1 | - | 1 tgts | 0 | 3 | 0 | 0.3 (##72) |
14 | SF | 87.0% | 29 | - | 5 tgts | 5 | 179 | 2 | 34.9 (##2) |
15 | MIA | 92.8% | 16 | - | 12 tgts | 11 | 162 | 0 | 27.2 (##4) |
16 | NE | 60.4% | 15 | - | 3 tgts | 2 | 74 | 0 | 9.4 (##35) |
17 | BUF | 71.7% | 22 | - | 3 tgts | 3 | 137 | 1 | 22.7 (##9) |
Week Wk | Opponent Opp | Snap Share Snap Share | Carries Carries | Routes Routes | Targets Targets | Receptions Receptions | Total Yards Total Yards | Total TDs Total TDs | Fantasy Points Fantasy Points |
---|---|---|---|---|---|---|---|---|---|
1 | CLE | 51.7% | 12 | - | 4 tgts | 2 | 78 | 0 | 9.8 |
2 | IND | 67.2% | 12 | - | 5 tgts | 4 | 54 | 0 | 9.4 |
3 | PHI | 100.0% | 10 | - | 8 tgts | 7 | 75 | 0 | 14.5 |
4 | MIA | 5.6% | 0 | - | 1 tgts | 1 | 12 | 0 | 2.2 |
6 | WAS | 100.0% | 4 | - | 1 tgts | 1 | -1 | 0 | 0.9 |
11 | HOU | 63.3% | 4 | - | 7 tgts | 5 | 89 | 0 | 13.9 |
12 | MIA | 45.1% | 6 | - | 5 tgts | 2 | 35 | 0 | 5.5 |
13 | NYG | 62.2% | 6 | - | 13 tgts | 8 | 108 | 1 | 24.8 |
14 | TEN | 31.4% | 3 | - | 5 tgts | 5 | 82 | 1 | 19.2 |
15 | DAL | 60.0% | 6 | - | 7 tgts | 7 | 79 | 1 | 20.9 |
16 | NE | 60.3% | 7 | - | 7 tgts | 5 | 90 | 0 | 14.0 |
Week Wk | Opponent Opp | Snap Share Snap Share | Carries Carries | Routes Routes | Targets Targets | Receptions Receptions | Total Yards Total Yards | Total TDs Total TDs | Fantasy Points Fantasy Points |
---|---|---|---|---|---|---|---|---|---|
1 | OAK | 18.8% | - | - | 0 tgts | 0 | 4 | 0 | 0.4 |
2 | GB | 24.6% | - | - | 2 tgts | 2 | 48 | 0 | 6.8 |
3 | CHI | 24.6% | - | - | 3 tgts | 2 | 19 | 0 | 3.9 |
5 | SD | 30.8% | - | - | 0 tgts | 0 | 6 | 0 | 0.6 |
6 | DEN | 31.0% | - | - | 0 tgts | 0 | 4 | 0 | 0.4 |
7 | NE | 15.4% | - | - | 2 tgts | 1 | 19 | 0 | 2.9 |
8 | BUF | 28.2% | - | - | 0 tgts | 0 | 28 | 1 | 8.8 |
9 | KC | 33.3% | - | - | 0 tgts | 0 | 20 | 0 | 2.0 |
10 | PIT | 20.4% | - | - | 1 tgts | 0 | 4 | 0 | 0.4 |
13 | MIA | 25.8% | - | - | 3 tgts | 2 | 23 | 0 | 4.3 |
14 | MIN | 28.2% | - | - | 0 tgts | 0 | 6 | 0 | 0.6 |
15 | TEN | 22.4% | - | - | 2 tgts | 2 | 18 | 0 | 3.8 |
16 | NE | 30.5% | - | - | 2 tgts | 2 | 34 | 0 | 5.4 |
17 | MIA | 19.7% | - | - | 0 tgts | 0 | 0 | 0 | 0.0 |
Week Wk | Opponent Opp | Snap Share Snap Share | Carries Carries | Routes Routes | Targets Targets | Receptions Receptions | Total Yards Total Yards | Total TDs Total TDs | Fantasy Points Fantasy Points |
---|---|---|---|---|---|---|---|---|---|
1 | TB | 0.0% | 12 (0 rz) | - | 5 | 4 | 64 | 0 | 10.4 (#22) |
2 | NE | 0.0% | 13 (1 rz) | - | 5 | 2 | 70 | 1 | 15.0 (#15) |
3 | BUF | 0.0% | 27 (3 rz) | - | 3 | 2 | 158 | 0 | 17.8 (#11) |
4 | TEN | 0.0% | 14 ( rz) | - | 5 | 3 | 108 | 0 | 13.8 (#19) |
5 | ATL | 0.0% | 12 (3 rz) | - | 2 | 1 | 47 | 0 | 5.7 (#38) |
6 | PIT | 0.0% | 9 (2 rz) | - | 3 | 3 | 50 | 0 | 8.0 (#36) |
7 | NE | 0.0% | 3 ( rz) | - | 2 | 0 | 6 | 0 | 0.6 (#74) |
8 | CIN | 0.0% | 10 ( rz) | - | 6 | 4 | 39 | 0 | 7.9 (#33) |
9 | NO | 0.0% | 9 (3 rz) | - | 3 | 0 | 29 | 0 | 2.9 (#53) |
11 | BUF | 0.0% | 5 (0 rz) | - | 1 | 1 | 28 | 0 | 3.8 (#57) |
12 | BAL | 0.0% | 11 (0 rz) | - | 4 | 3 | 65 | 0 | 9.5 (#26) |
13 | MIA | 0.0% | 7 (1 rz) | - | 5 | 3 | 59 | 0 | 8.9 (#35) |
14 | OAK | 0.0% | 8 (1 rz) | - | 1 | 1 | 38 | 0 | 4.8 (#54) |
15 | CAR | 0.0% | 8 (1 rz) | - | 4 | 4 | 56 | 0 | 9.6 (#33) |
16 | CLE | 0.0% | 7 (1 rz) | - | 5 | 4 | 80 | 0 | 12.0 (#21) |
17 | MIA | 0.0% | 21 (3 rz) | - | 3 | 1 | 72 | 0 | 9.4 (#32) |
Week Wk | Opponent Opp | Snap Share Snap Share | Carries Carries | Routes Routes | Targets Targets | Receptions Receptions | Total Yards Total Yards | Total TDs Total TDs | Fantasy Points Fantasy Points |
---|---|---|---|---|---|---|---|---|---|
1 | BUF | 0.0% | 3 ( rz) | - | 1 | 1 | 26 | 0 | 3.6 (#50) |
2 | PIT | 0.0% | 9 ( rz) | - | 2 | 0 | 33 | 0 | 3.3 (#60) |
3 | MIA | 0.0% | 10 ( rz) | - | 5 | 2 | 69 | 0 | 8.9 (#30) |
4 | SF | 0.0% | 4 ( rz) | - | 3 | 0 | 11 | 0 | 1.1 (#87) |
5 | HOU | 0.0% | 4 (1 rz) | - | 4 | 0 | 18 | 0 | 1.8 (#63) |
6 | IND | 0.0% | 4 (1 rz) | - | 2 | 1 | 15 | 0 | 2.5 (#61) |
10 | SEA | 0.0% | 1 ( rz) | - | 1 | 1 | 11 | 0 | 2.1 (#58) |
11 | STL | 0.0% | 11 (5 rz) | - | 2 | 2 | 60 | 2 | 20.0 (#4) |
12 | NE | 0.0% | 12 (2 rz) | - | 3 | 2 | 53 | 1 | 13.3 (#26) |
13 | ARI | 0.0% | 12 (2 rz) | - | 1 | 0 | 58 | 0 | 5.8 (#44) |
14 | JAC | 0.0% | 19 (5 rz) | - | 0 | 0 | 78 | 1 | 13.8 (#22) |
15 | TEN | 0.0% | 6 (2 rz) | - | 2 | 2 | 43 | 0 | 6.3 (#38) |
16 | SD | 0.0% | 3 ( rz) | - | 4 | 4 | 34 | 0 | 7.4 (#34) |
17 | BUF | 0.0% | 12 (2 rz) | - | 6 | 2 | 68 | 0 | 8.8 (#33) |
Week Wk | Opponent Opp | Snap Share Snap Share | Carries Carries | Routes Routes | Targets Targets | Receptions Receptions | Total Yards Total Yards | Total TDs Total TDs | Fantasy Points Fantasy Points |
---|---|---|---|---|---|---|---|---|---|
11 | DEN | 0.0% | 7 (1 rz) | - | 1 | 1 | 18 | 0 | 2.8 (#53) |
14 | KC | 0.0% | 6 ( rz) | - | 0 | 0 | 10 | 0 | 1.0 (#82) |
Running back Bilal Powell signed a one-day contract on ...
New York Jets running back Bilal Powell (ankle, illness) is not expected to play Thursday night at Baltimore. Powell, who was filling in for Le'Veon Bell (illness) injured his ankle at the end of the Jets Week 14 win over the Dolphins. Powell is also apparently dealing with the flu but head coach ...
New York Jets running back Bilal Powell would be in line for a starter's workload if running back Le'Veon Bell (illness) misses the game. Bell missed practice Thursday and Friday with an illness and is officially listed as questionable for Sunday's home date with Miami. Ty Montgomery would also ...
Year Year | Games Games | Rush Attempts Rush Atts | Rushing Yards Rush Yrds | Total Touchdowns TDs | Receptions Rec | Receiving Yards Rec Yrds | Target Share Tgt Share | Age Age | School School |
---|---|---|---|---|---|---|---|---|---|
2007 | 8 (RB) | 24 | 187 (2 tds) | 2 | 3 (5 tgts) | 25 | 1.0% | 18 | Louisville |
2008 | 11 (RB) | 75 | 354 (2 tds) | 2 | 12 (17 tgts) | 58 | 4.3% | 19 | Louisville |
2009 | 11 (RB) | 108 | 392 (4 tds) | 4 | 12 (16 tgts) | 103 | 4.4% | 20 | Louisville |
2010 | 12 (RB) | 229 | 1405 (11 tds) | 14 | 18 (19 tgts) | 158 | 5.2% | 21 | Louisville |