
Oregon’s C.J. Verdell is the next subject in a series in which I evaluate 2022 rookie running backs solely on their ability to run the ball. The Breakout Finder installments can be found here. The PlayerProfiler installments can be found here. If you happened to already catch those and don’t need a refresher on my methodology, feel free to skip to the player-focused analysis.
The Player
C.J. Verdell blew up early on in his college career. He went for over 1,000 rushing yards in each of his redshirt freshman and redshirt sophomore seasons. He missed some games while dealing with injuries as an upperclassman in 2020 and 2021. But his 28.8-percent per-game Dominator Rating as a redshirt senior last season was actually the highest of his career. Let’s dive into the rushing efficiency profile of this Duck running back.
The Metrics
On 541 carries over his four seasons at Oregon, C.J. Verdell averaged 0.06 more yards per carry than did the other backs on the team, while lagging behind those guys in 10-yard run rate by 0.77-percent. Those team-relative numbers land in the 31st and 33rd-percentiles, respectively, among running backs drafted since 2007. He was similarly unimpressive as a big-play guy, with a 26.1-percent (30th-percentile) Breakaway Conversion Rate.
Verdell posted those numbers (at least the team-relative ones) while facing box counts that were 0.09 defenders lighter, on average, than those his teammates ran against. That discrepancy is in the 27th-percentile. While his path to efficiency was substantially easier than those for other Duck runners, he failed to take advantage in a way that would be up to snuff relative to other future NFL backs.
This is reflected in his Box-Adjusted Efficiency Rating. It shows that the average Verdell carry was worth just 95.0-percent the output of the average non-Verdell carry during his time in Eugene, only a 10th-percentile mark. He was also less consistent than his teammates. His Relative Success Rate (which assigns a binary success/failure tag to the outcome of each rushing attempt based on yards gained as well as down and distance prior to the snap, “relative” here means adjusted for box counts in the same way that BAE Rating is) was 6.1-percent lower than theirs. It’s the worst mark I’ve seen in the class so far.
Some More Context
Part of the equation here is the talent-level of those Oregon teammates. With an average 3.16-star rating as high school recruits, they were just a 47th-percentile group.
Given the fast start to Verdell’s career and then the recent drop-off, it’s reasonable to wonder a) why his raw productivity took a dip, and b) what might we be getting in the NFL if he’s the dude we saw early on. The answer to the first question is probably injuries. He missed much of 2021 with a lower leg injury and was also banged up in 2020. As for the second question, I’m not super optimistic about Verdell’s NFL prospects. Even if we are getting the guy who ran for over 2,200 yards and 18 TDs in 2018 and 2019.
In those two seasons, he outpaced his backfield mates by 0.37 yards per carry and 0.18-percent in Chunk Rate. While positive relative to his teammates, those numbers would both rank in the 43rd-percentile. Even peak Verdell was a below-average ballcarrier among backs who get drafted. In 2020 and 2021, his YPC+ and Chunk Rate+ dipped to -0.83 and -2.90-percent; landing in the 9th and 16th-percentiles, respectively.
Rushing Efficiency Score and Comps
In a composite Rushing Efficiency Score that accounts for all the non-BAE metrics we’ve touched on here (in addition to overall team quality, rushing volume, offensive line play, and opponent strength), C.J. Verdell earns a 37.0 out of 100. In a composite score that does account for the box count-adjusted metrics, he earns a 14.6. Which is the second-lowest mark in the class, ahead of only Jashaun Corbin.
Using the same metrics that contribute to the Rushing Efficiency composite (as well as physical measurables), I’m also able to generate comps that indicate the degree of similarity between a current prospect and historical prospects. Assuming he runs a 4.50 40-yard dash at a projected 5-8 and 210-pounds, his most similar players in the “pure runner” category are the following:
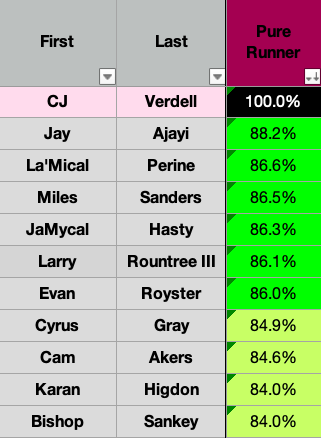
Intellectual honesty means I am obligated to point that there are several decent NFL players on this list. Cam Akers is (allegedly) great. Miles Sanders is (overrated but) a reasonably effective player. And Jay Ajayi once ran for over 1,200 yards in a season. The rest of the list is made up of complete JAGs. And I will point out that these comps don’t account for box count data. Verdell’s poor efficiency is reflected in both raw efficiency stats and box-count adjusted numbers, where a guy like Akers had somewhat poor raw team-relative efficiency but looks much better via metrics like BAE Rating or Relative Success Rate. I say all of that to say that his strongest comp on this list (if we agree that it’s Akers) is a bit misleading.
Last Word
C.J. Verdell was a productive college player who was fraudulently propped up as a future NFL stud by over-eager devy enthusiasts. He’s probably a JAG. Hoping he becomes Jay Ajayi or Miles Sanders is misguided, given that those guys aren’t really that good either.
remember three years ago when your favorite devy analyst was pumping up cj verdell 🤢
— noah hills (@noahmoreparties) February 15, 2022
A JAG with volume is good for fantasy, but it’s not very predictable (at least pre-draft). Look elsewhere in your rookie draft.

